Statistics Assignment - MBA Student Survey and Analysis
VerifiedAdded on 2020/04/01
|8
|1194
|634
Homework Assignment
AI Summary
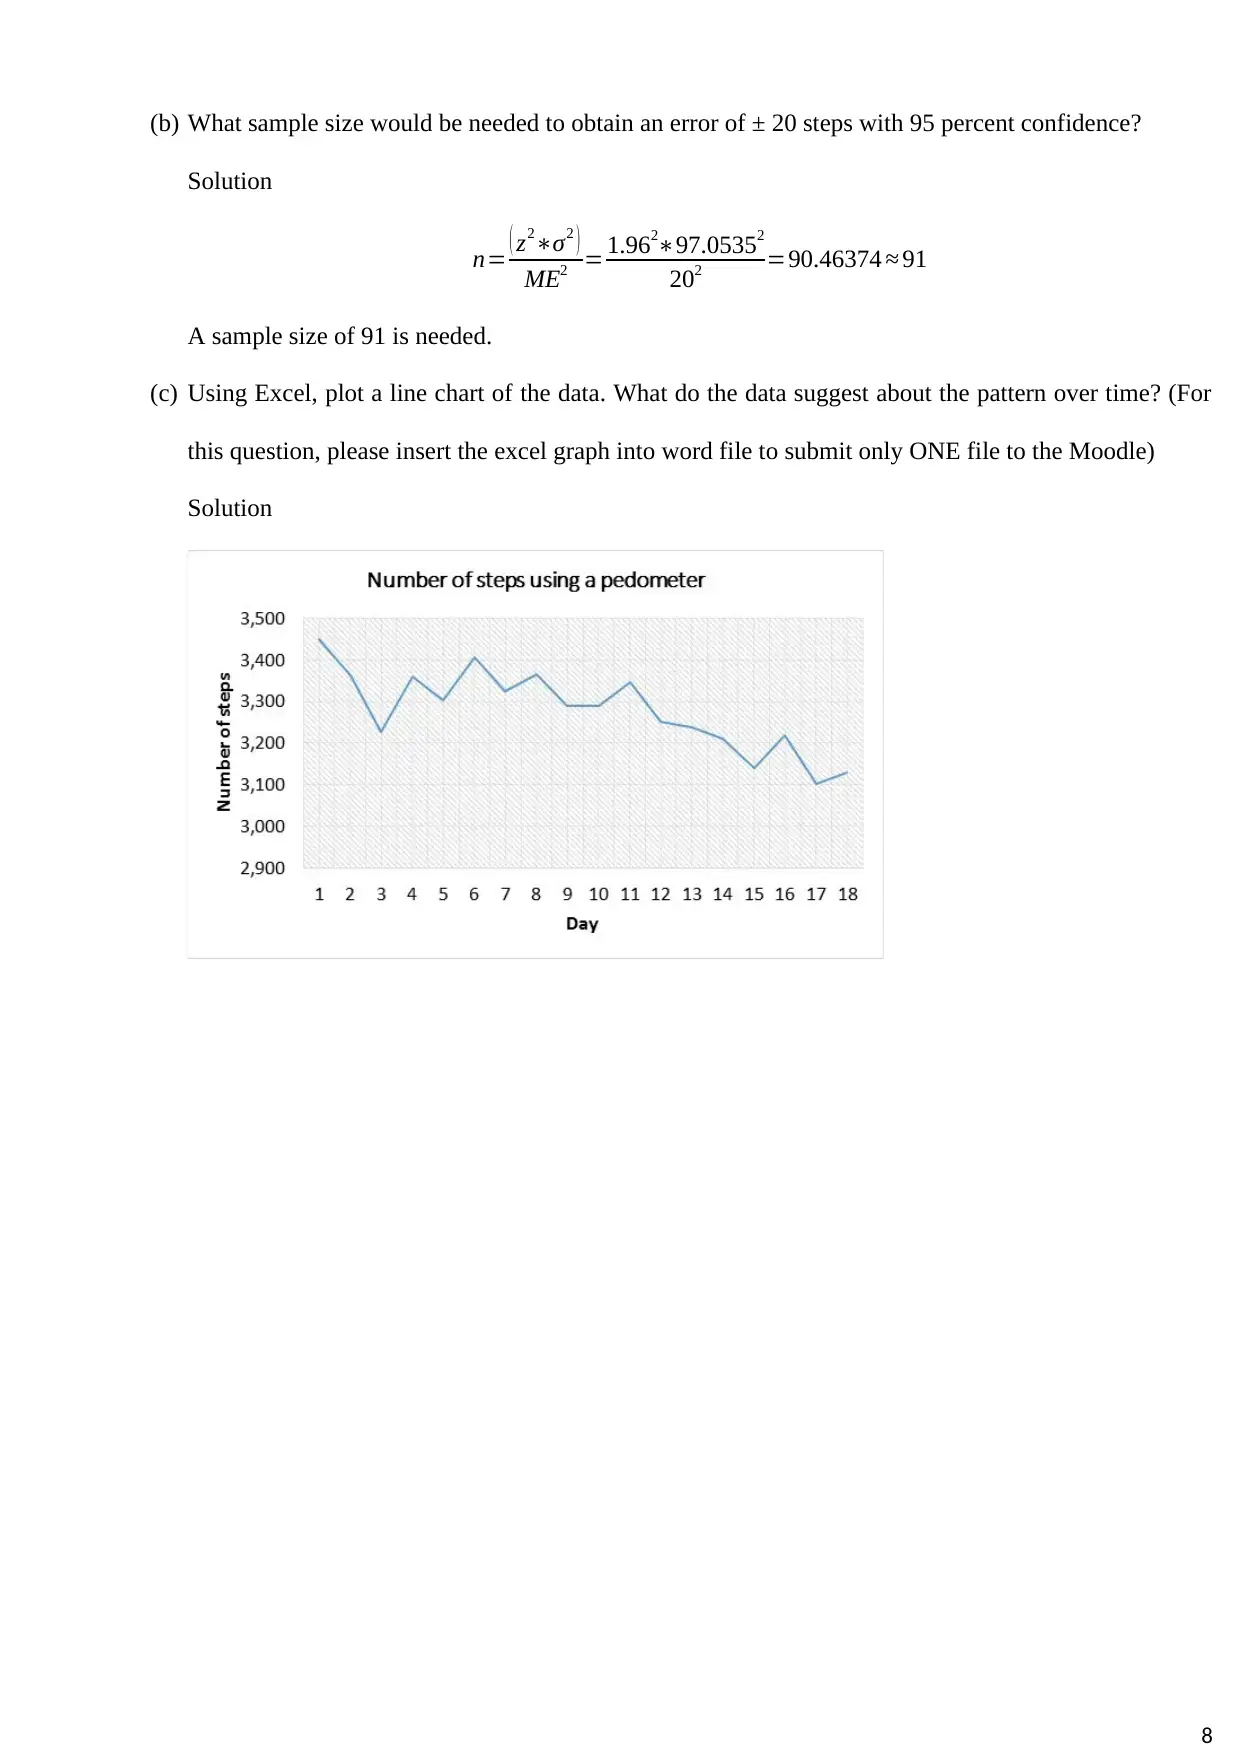
This statistics assignment presents a comprehensive analysis of various statistical concepts. The first question explores data types and measurement levels through a survey of MBA students, analyzing categorical, discrete numerical, and continuous numerical data with nominal, ordinal, interval, and ratio scales. The second question delves into measures of central tendency (mean, median, and mode), standard deviation, and outlier identification using a dataset of monthly rents. The third question examines quiz scores, comparing measures of center, assessing symmetry and skewness, and describing student performance. The fourth question tackles probability calculations related to airplane alternator failures. Finally, the fifth question focuses on constructing a 95% confidence interval for the mean number of steps a jogger takes and determining the necessary sample size for a specified error margin, also including a line chart analysis of the data.

Statistics
Name
Institution
Instructor
26th September 2017
1
Name
Institution
Instructor
26th September 2017
1
Paraphrase This Document
Need a fresh take? Get an instant paraphrase of this document with our AI Paraphraser

Question 1:
Below are five questions from a survey of MBA students. Answers were written in the blank at the left of
each question. For each question, state the data type (categorical, discrete numerical, or continuous
numerical) and measurement level (nominal, ordinal, interval, ratio). Explain your reasoning. If there is
doubt, discuss the alternatives.
1. What is your gender? (Male = 0, Female = 1)
Solution
Data Type Measurement level
Categorical Nominal
2. What is your approximate undergraduate college GPA? (1.0 to 4.0)
Solution
Data Type Measurement level
Continuous numerical Interval
3. About how many hours per week do you expect to work at an outside job this semester?
Solution
Data Type Measurement level
Continuous numerical Ratio
4. What do you think is the ideal number of children for a married couple?
Solution
Data Type Measurement level
Discrete numerical Interval
5. On a 1 to 5 scale, which best describes your parents? (1 = Mother clearly dominant ⟷ 5 = Father
clearly dominant)
Solution
Data Type Measurement level
Discrete numerical Ordinal
2

Question 2:
Below are monthly rents paid by 30 students who live off campus. (a) Find the mean, median, and mode. (b)
Do the measures of central tendency agree? Explain. (c) Calculate the standard deviation. (d) Sort and
standardize the data. (e) Are there outliers or unusual data values? (f) Using the Empirical Rule, do you think
the data could be from a normal population?
730 730 730 930 700 570
690 1,030 740 620 720 670
560 740 650 660 850 930
600 620 760 690 710 500
730 800 820 840 720 700
(a) Find the mean, median, and mode.
Solution
Mean=∑ xi
n = 21740
30 =724.6667
Median= 15 th value+16 th value
2 = 720+720
2 =72 0
Mode=Most frequent=730
(b) Do the measures of central tendency agree?
Solution
Yes the measures of central tendency agree; there is no much variation between the three values
(c) Calculate the standard deviation
Solution
Standard deviation= √ ∑ ( xi−x )2
n−1 = √ 378746.7
29 = √ 13060.23=114.2814
(d) Sort and standardize the data.
Solution
3
⊘ This is a preview!⊘
Do you want full access?
Subscribe today to unlock all pages.

Trusted by 1+ million students worldwide

-1.96591 -0.91587 -0.30334 -0.04083 0.134172 1.009205
-1.44089 -0.65336 -0.21584 0.046668 0.134172 1.096708
-1.35338 -0.56585 -0.21584 0.046668 0.309178 1.796735
-1.09087 -0.47835 -0.12834 0.046668 0.659192 1.796735
-0.91587 -0.30334 -0.04083 0.046668 0.834198 2.671768
(e) Are there outliers or unusual data values?
Solution
There are no outliers in the dataset; none of the standardized values is greater than 3 or less than -3.
There is one standardized value greater than 2. The last observation has a z score = 2.6718 so we
would consider this an unusual value
(f) Using the Empirical Rule, do you think the data could be from a normal population?
Solution
The data could come from a normal population
Question 3:
Prof. Hardtack gave four Friday quizzes last semester in his 10-student senior tax accounting class.
a) Find the mean, median, and mode for each quiz.
Solution
For quiz 1:
Mean=∑ xi
n = 720
1 0 =72
Median= 5 th value+ 6 thvalue
2 = 71+73
2 =72
Mode=Most frequent=6 0
For quiz 2:
Mean=∑ xi
n = 720
10 =72
Median= 5 thvalue+ 6 thvalue
2 = 70+74
2 =72
Mode=Most frequent=65∧79
4
Paraphrase This Document
Need a fresh take? Get an instant paraphrase of this document with our AI Paraphraser

For quiz 3:
Mean=∑ xi
n = 76 0
10 =76
Median= 5 th value+ 6 thvalue
2 = 72+72
2 =72
Mode=Most frequent=7 2
For quiz 4:
Mean=∑ xi
n = 76 0
10 =76
Median= 5 th value+ 6 thvalue
2 = 85+88
2 =86.5
Mode=Most frequent=¿
b) Do these measures of center agree? Explain.
Solution
No
c) For each data set, note strengths or weaknesses of each statistic of center.
For quiz 1, the distribution seems to be symmetrical hence mean is the most appropriate as the
statistic of center; weakness of mean is that it is greatly affected by the outliers
For quiz 2, the distribution seems to be symmetrical hence mean is the most appropriate as the
statistic of center; weakness of mean is that it is greatly affected by the outliers
For quiz 3, the distribution seems not to be symmetrical hence median is the most appropriate as
the statistic of center; strength of median is that it is not greatly affected by outliers
For quiz 4, the distribution seems not to be symmetrical hence median is the most appropriate as
the statistic of center; strength of median is that it is not greatly affected by outliers
d) Are the data symmetric or skewed? If skewed, which direction?
Solution
5
Mean=∑ xi
n = 76 0
10 =76
Median= 5 th value+ 6 thvalue
2 = 72+72
2 =72
Mode=Most frequent=7 2
For quiz 4:
Mean=∑ xi
n = 76 0
10 =76
Median= 5 th value+ 6 thvalue
2 = 85+88
2 =86.5
Mode=Most frequent=¿
b) Do these measures of center agree? Explain.
Solution
No
c) For each data set, note strengths or weaknesses of each statistic of center.
For quiz 1, the distribution seems to be symmetrical hence mean is the most appropriate as the
statistic of center; weakness of mean is that it is greatly affected by the outliers
For quiz 2, the distribution seems to be symmetrical hence mean is the most appropriate as the
statistic of center; weakness of mean is that it is greatly affected by the outliers
For quiz 3, the distribution seems not to be symmetrical hence median is the most appropriate as
the statistic of center; strength of median is that it is not greatly affected by outliers
For quiz 4, the distribution seems not to be symmetrical hence median is the most appropriate as
the statistic of center; strength of median is that it is not greatly affected by outliers
d) Are the data symmetric or skewed? If skewed, which direction?
Solution
5

For quiz 1: is symmetric
For quiz 2: is symmetric
For quiz 3: is skewed to the right
For quiz 4: is skewed to the left
e) Briefly describe and compare student performance on each quiz.
Solution
In quiz 1, the performance is well distributed and as such this can regarded as a good performance
In quiz 2, just like in quiz 1, the performance is well distributed and as such this can regarded as a
good performance
In quiz 3, just like in quiz 1 and 2, the performance is well distributed and as such this can
regarded as a good performance
In quiz 4, despite having a higher mean score, the performance is not well distributed and as such
this can regarded as a poor performance since some scores are as low as 10.
Quizzes:
• Quiz 1: 60, 60, 60, 60, 71, 73, 74, 75, 88, 99
• Quiz 2: 65, 65, 65, 65, 70, 74, 79, 79, 79, 79
• Quiz 3: 66, 67, 70, 71, 72, 72, 74, 74, 95, 99
• Quiz 4: 10, 49, 70, 80, 85, 88, 90, 93, 97, 98
Question 4:
A certain airplane has two independent alternators to provide electrical power. The probability that a given
alternator will fail on a one-hour flight is .02. What is the probability that
(a) Both will fail?
Solution
P ( Both fail ) =0.02∗0.02=0.0004
(b) Neither will fail?
Solution
P ( Neither fail ) =P ( Alt ¿1OK )∗P ( Alt¿2 OK )=0.98∗0.98=0.9604
6
⊘ This is a preview!⊘
Do you want full access?
Subscribe today to unlock all pages.

Trusted by 1+ million students worldwide

(c) One or the other will fail? Show all steps carefully.
Solution
P ( one∨the other fail ) =P ( Alt ¿1 fails∧ Alt¿2 Ok )∨P ( Alt ¿2 fails∧ Alt ¿1Ok )
P ( one∨the other fail ) =0.02∗0.98+ 0.02∗0.98=0.0392
Question 5:
Dave the jogger runs the same route every day (about 2.2 miles). On 18 consecutive days, he recorded the
number of steps using a pedometer. The results were
3,450 3,363 3,228 3,360 3,304 3,407 3,324 3,365 3,290
3,289 3,346 3,252 3,237 3,210 3,140 3,220 3,103 3,129
(a) Construct a 95 percent confidence interval for the true mean number of steps Dave takes on his run.
Solution
95% C.I: X ± Margin Error
X =∑ xi
n = 59017
18 =3278.722
Margin Error= Zα /2 σ
√ n
Standard deviation , σ= √ ∑ ( xi−x ) 2
n−1 = √ 160130
17 = √ 9419.389=97.0535
Zα /2 =1.96
Margin Error= 1.96∗97.0535
√18 =44.83645
95% C.I: 3278.722 ± 44.83645
Lower limit: 3278.722−44.83645=3233.88555
Upper limit: 3278.722+44.83645=3323.55845
Thus we are 95% confident that the true mean of steps Dave takes on his run is between 3233.88555
and 3323.55845.
7
Solution
P ( one∨the other fail ) =P ( Alt ¿1 fails∧ Alt¿2 Ok )∨P ( Alt ¿2 fails∧ Alt ¿1Ok )
P ( one∨the other fail ) =0.02∗0.98+ 0.02∗0.98=0.0392
Question 5:
Dave the jogger runs the same route every day (about 2.2 miles). On 18 consecutive days, he recorded the
number of steps using a pedometer. The results were
3,450 3,363 3,228 3,360 3,304 3,407 3,324 3,365 3,290
3,289 3,346 3,252 3,237 3,210 3,140 3,220 3,103 3,129
(a) Construct a 95 percent confidence interval for the true mean number of steps Dave takes on his run.
Solution
95% C.I: X ± Margin Error
X =∑ xi
n = 59017
18 =3278.722
Margin Error= Zα /2 σ
√ n
Standard deviation , σ= √ ∑ ( xi−x ) 2
n−1 = √ 160130
17 = √ 9419.389=97.0535
Zα /2 =1.96
Margin Error= 1.96∗97.0535
√18 =44.83645
95% C.I: 3278.722 ± 44.83645
Lower limit: 3278.722−44.83645=3233.88555
Upper limit: 3278.722+44.83645=3323.55845
Thus we are 95% confident that the true mean of steps Dave takes on his run is between 3233.88555
and 3323.55845.
7
Paraphrase This Document
Need a fresh take? Get an instant paraphrase of this document with our AI Paraphraser

(b) What sample size would be needed to obtain an error of ± 20 steps with 95 percent confidence?
Solution
n= ( z2∗σ2 )
ME2 = 1.962∗97.05352
202 =90.46374 ≈ 91
A sample size of 91 is needed.
(c) Using Excel, plot a line chart of the data. What do the data suggest about the pattern over time? (For
this question, please insert the excel graph into word file to submit only ONE file to the Moodle)
Solution
8
Solution
n= ( z2∗σ2 )
ME2 = 1.962∗97.05352
202 =90.46374 ≈ 91
A sample size of 91 is needed.
(c) Using Excel, plot a line chart of the data. What do the data suggest about the pattern over time? (For
this question, please insert the excel graph into word file to submit only ONE file to the Moodle)
Solution
8
1 out of 8
Related Documents

Your All-in-One AI-Powered Toolkit for Academic Success.
+13062052269
info@desklib.com
Available 24*7 on WhatsApp / Email
Unlock your academic potential
Copyright © 2020–2025 A2Z Services. All Rights Reserved. Developed and managed by ZUCOL.