Data Analysis Report: Web Server Statistics and Visualization
VerifiedAdded on 2022/08/13
|7
|1100
|146
Report
AI Summary
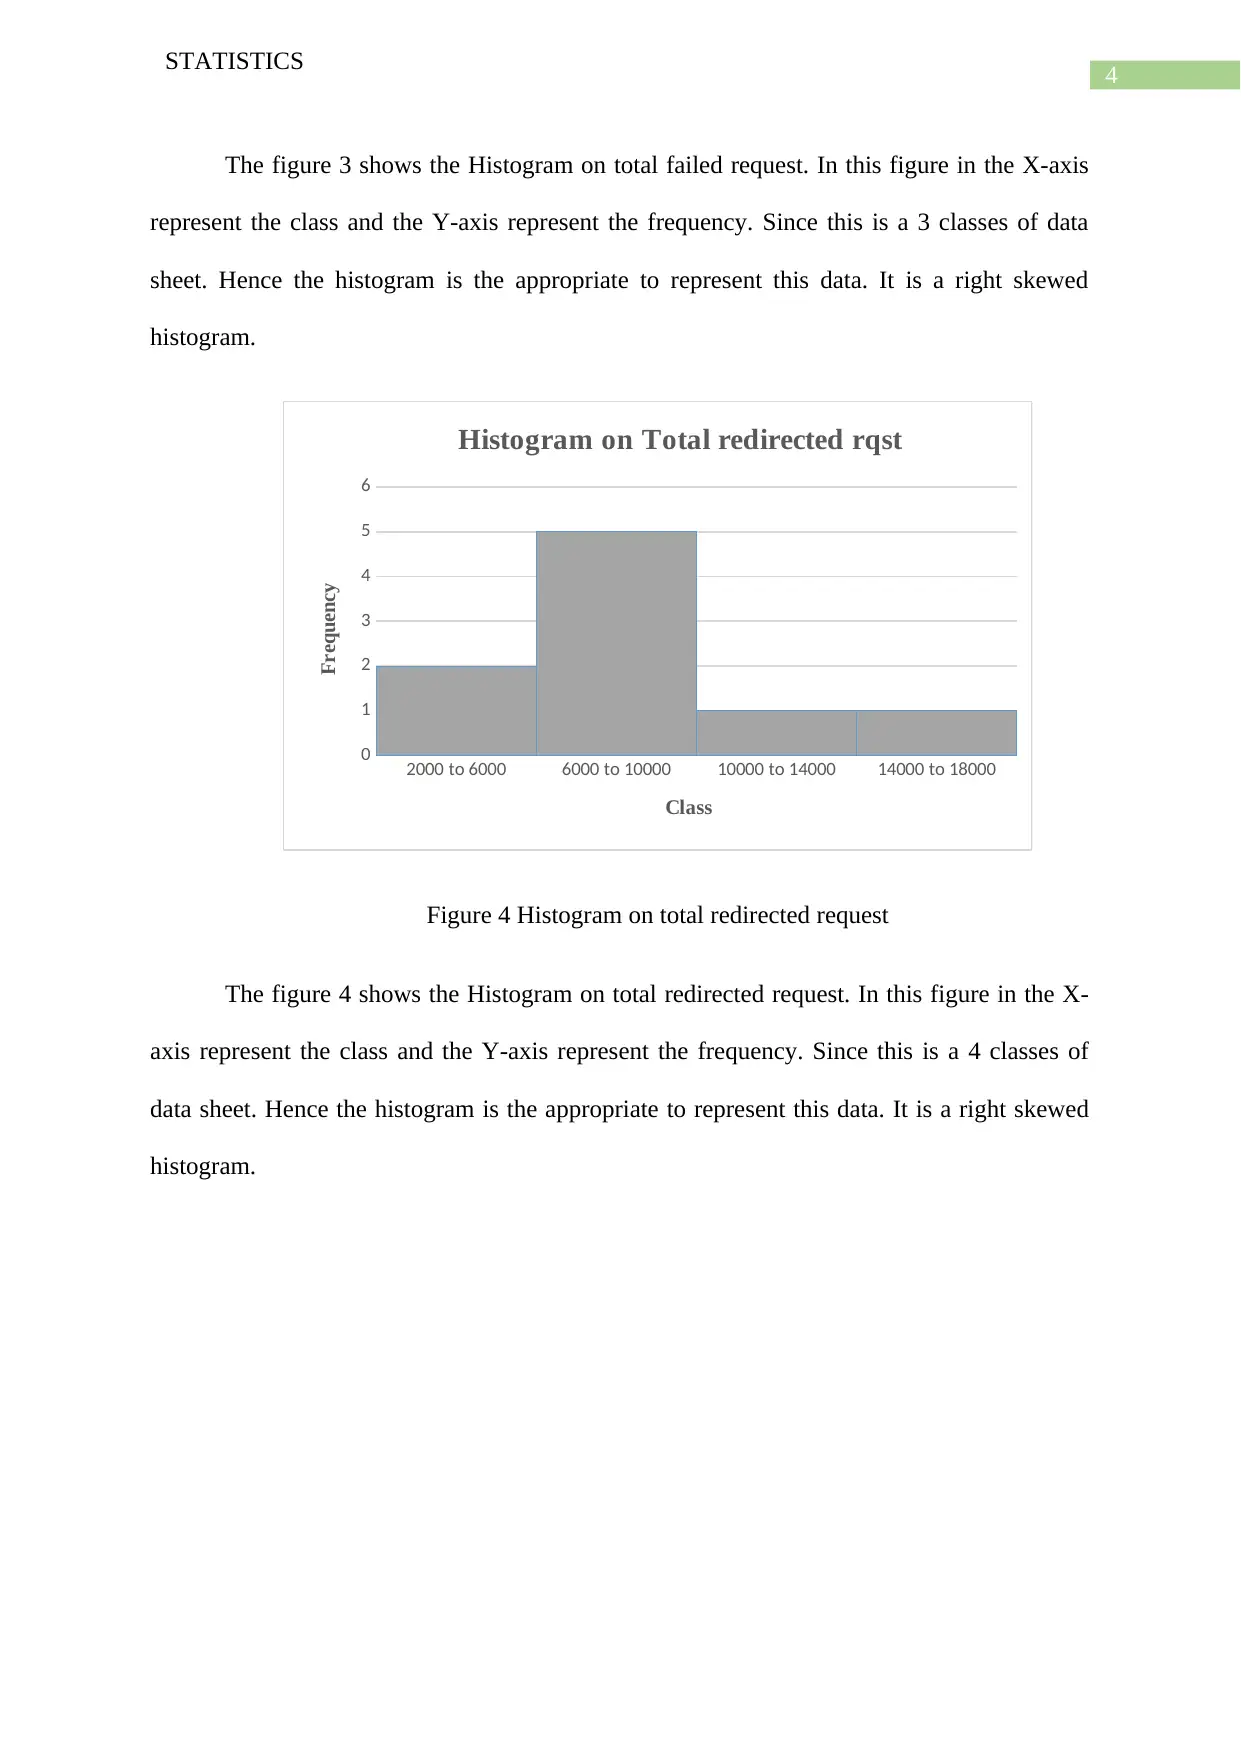
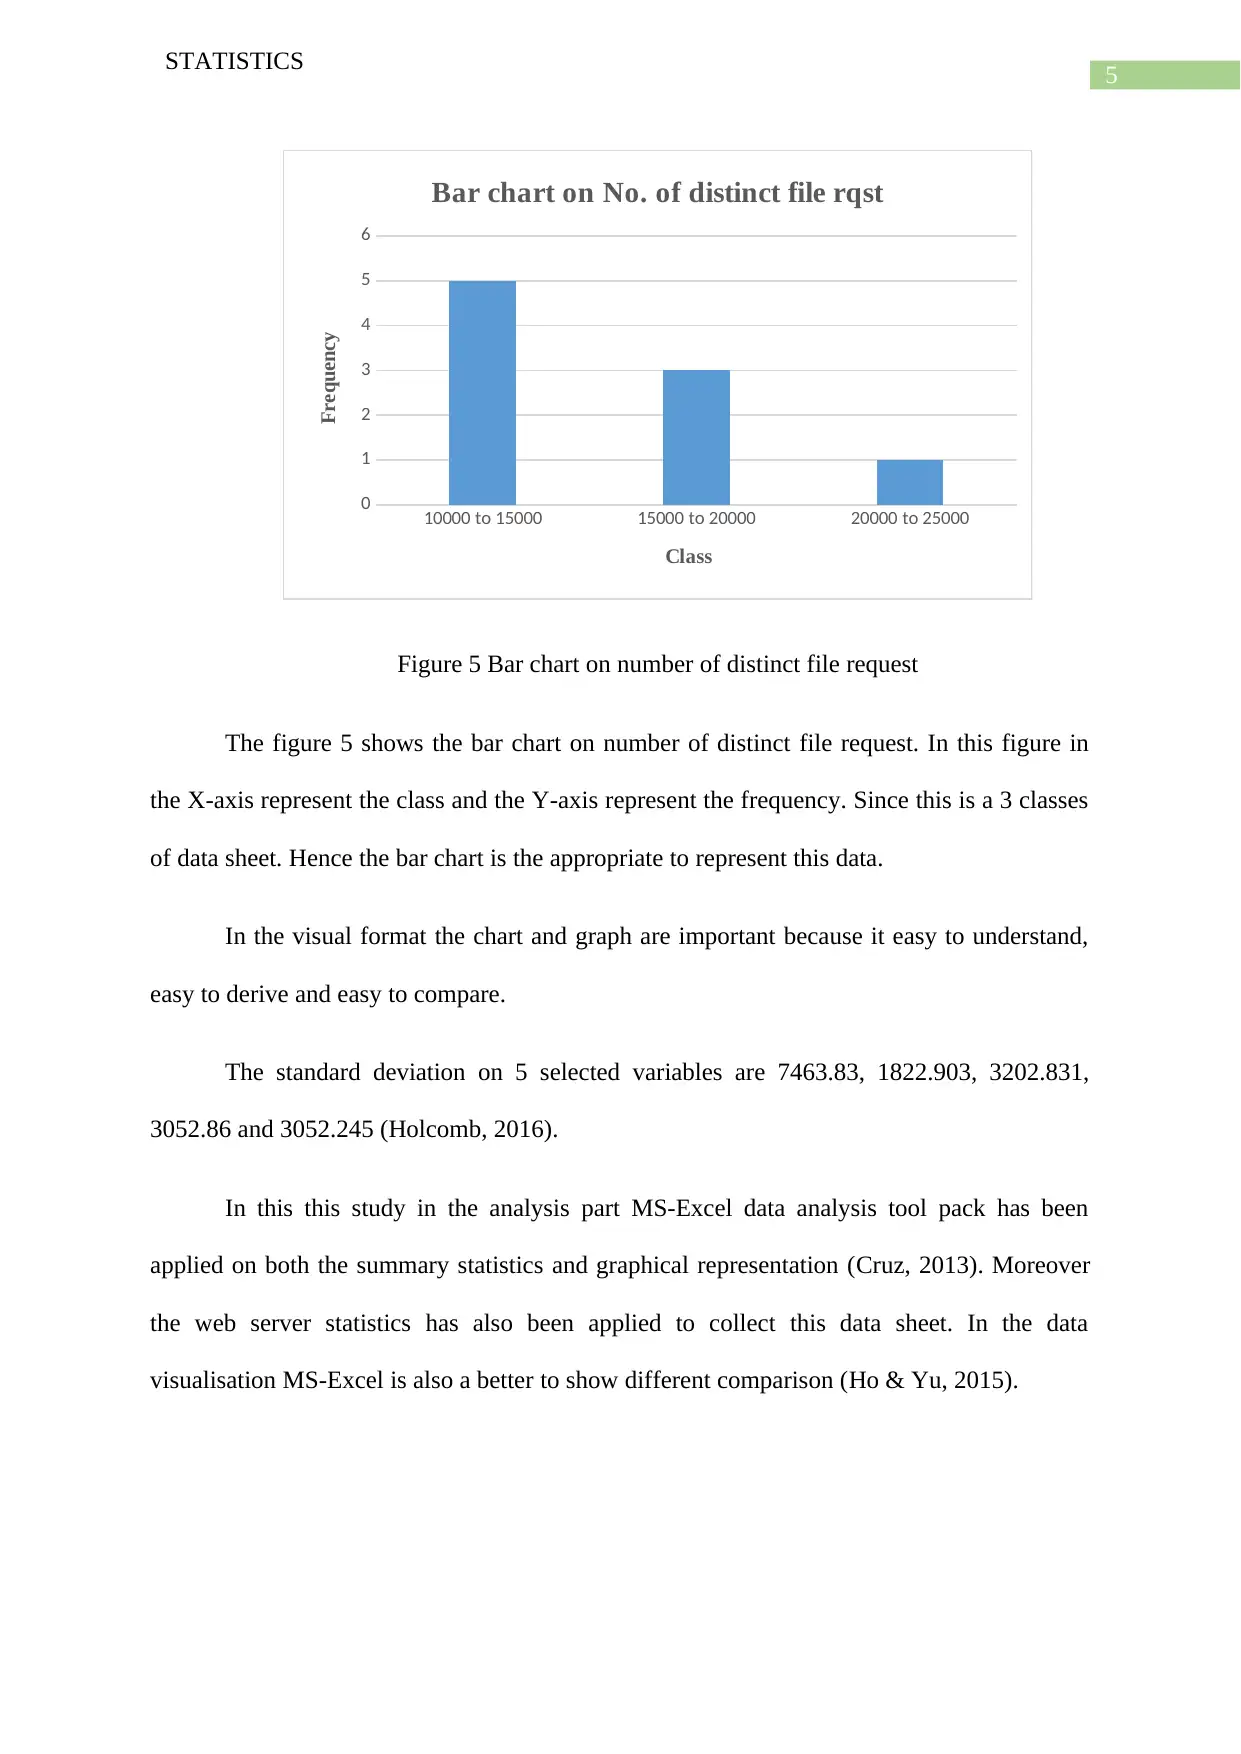
This report provides a comprehensive analysis of web server statistics from a computer science department, focusing on data collected over nine weeks across eleven variables. The analysis identifies anomalies in the average successful requests per day, particularly in the third and fifth weeks, indicating irregular data patterns. Five key variables—average successful requests per day, average successful requests for pages per day, total failed requests, total redirected requests, and number of distinct file requests—were selected using a simple random sampling lottery method. The report details measures of central tendency (mean, median, mode) and dispersion (range, standard deviation, quartile deviation) for each selected variable. Graphical representations, including bar charts, pie charts, and histograms, are used to visualize the data, with explanations for the suitability of each chart type. The study employs MS-Excel for both statistical analysis and graphical representation, highlighting the importance of charts and graphs for easy understanding and comparison. The standard deviations for the selected variables are calculated, and references to relevant statistical methods and tools are included.
1 out of 7
Related Documents


Your All-in-One AI-Powered Toolkit for Academic Success.
+13062052269
info@desklib.com
Available 24*7 on WhatsApp / Email
![[object Object]](/_next/static/media/star-bottom.7253800d.svg)
Copyright © 2020–2026 A2Z Services. All Rights Reserved. Developed and managed by ZUCOL.