Statistics for Management: Analysis of Data and Performance Report
VerifiedAdded on 2020/06/04
|19
|3677
|54
Report
AI Summary
This report analyzes statistical data relevant to management, covering topics such as public and private sector earnings of men and women, student performance, and delivery numbers. The report includes calculations of average earnings, variance, and growth rates, along with graphical representations to aid in understanding the data. It also explores the differences in earnings between men and women in both sectors, analyzes student marks, identifies strengths and weaknesses, and determines the average weights of children using a line of best fit. The report further examines the number of deliveries made annually and the implications of statistical formulas for EOQ measurement, providing a comprehensive overview of statistical analysis in a management context.
Statistics for management
Paraphrase This Document
Need a fresh take? Get an instant paraphrase of this document with our AI Paraphraser
TABLE OF CONTENTS
INTRODUCTION...........................................................................................................................1
TASK 1............................................................................................................................................1
A. Determining the differences between men and women earning in public sector..............1
B. Analysing the variation in the private sector earnings of men and women.......................2
C. Drafting a time chart for group A during 2009-2016........................................................3
D. Identifying the annual growth rate of four group in table A with the help of above
presented chart........................................................................................................................4
TASK 2............................................................................................................................................5
Section A..........................................................................................................................................5
2.1 Presenting the data in the form of Diagram......................................................................5
2.2 Analysing the average marks obtained by students as well as their strength and weakness
................................................................................................................................................6
2.3 Drafting report which contains the informations relevant with the performance of students
................................................................................................................................................8
Section B..........................................................................................................................................9
2.4 Determining the average weights of children with the help of line of best fit.................9
TASK 3..........................................................................................................................................10
A Analysing the numbers of deliveries currently made in each year...................................10
B Determining the numbers of deliveries for olive oil bottles.............................................11
C Implication of the proper statistical formula for EOQ measurement...............................11
TASK 4..........................................................................................................................................12
4.1 Presenting each data with the help of various charts......................................................12
4.2 Analysing the relationship between prices of house and bedrooms in the three streets.14
CONCLUSION..............................................................................................................................15
REFERENCES..............................................................................................................................16
INTRODUCTION
To have the successful organisational operations there is need to have proper statistics
and measurement of the findings, which will be helpful for accurate decision-making. In the
present report there will be discussion based on various analysis, which are relevant with the
public and private sector earning capacity of men and women. There will be graphical
presentation of various data or information, which will be helpful for clear observations and
understanding.
TASK 1
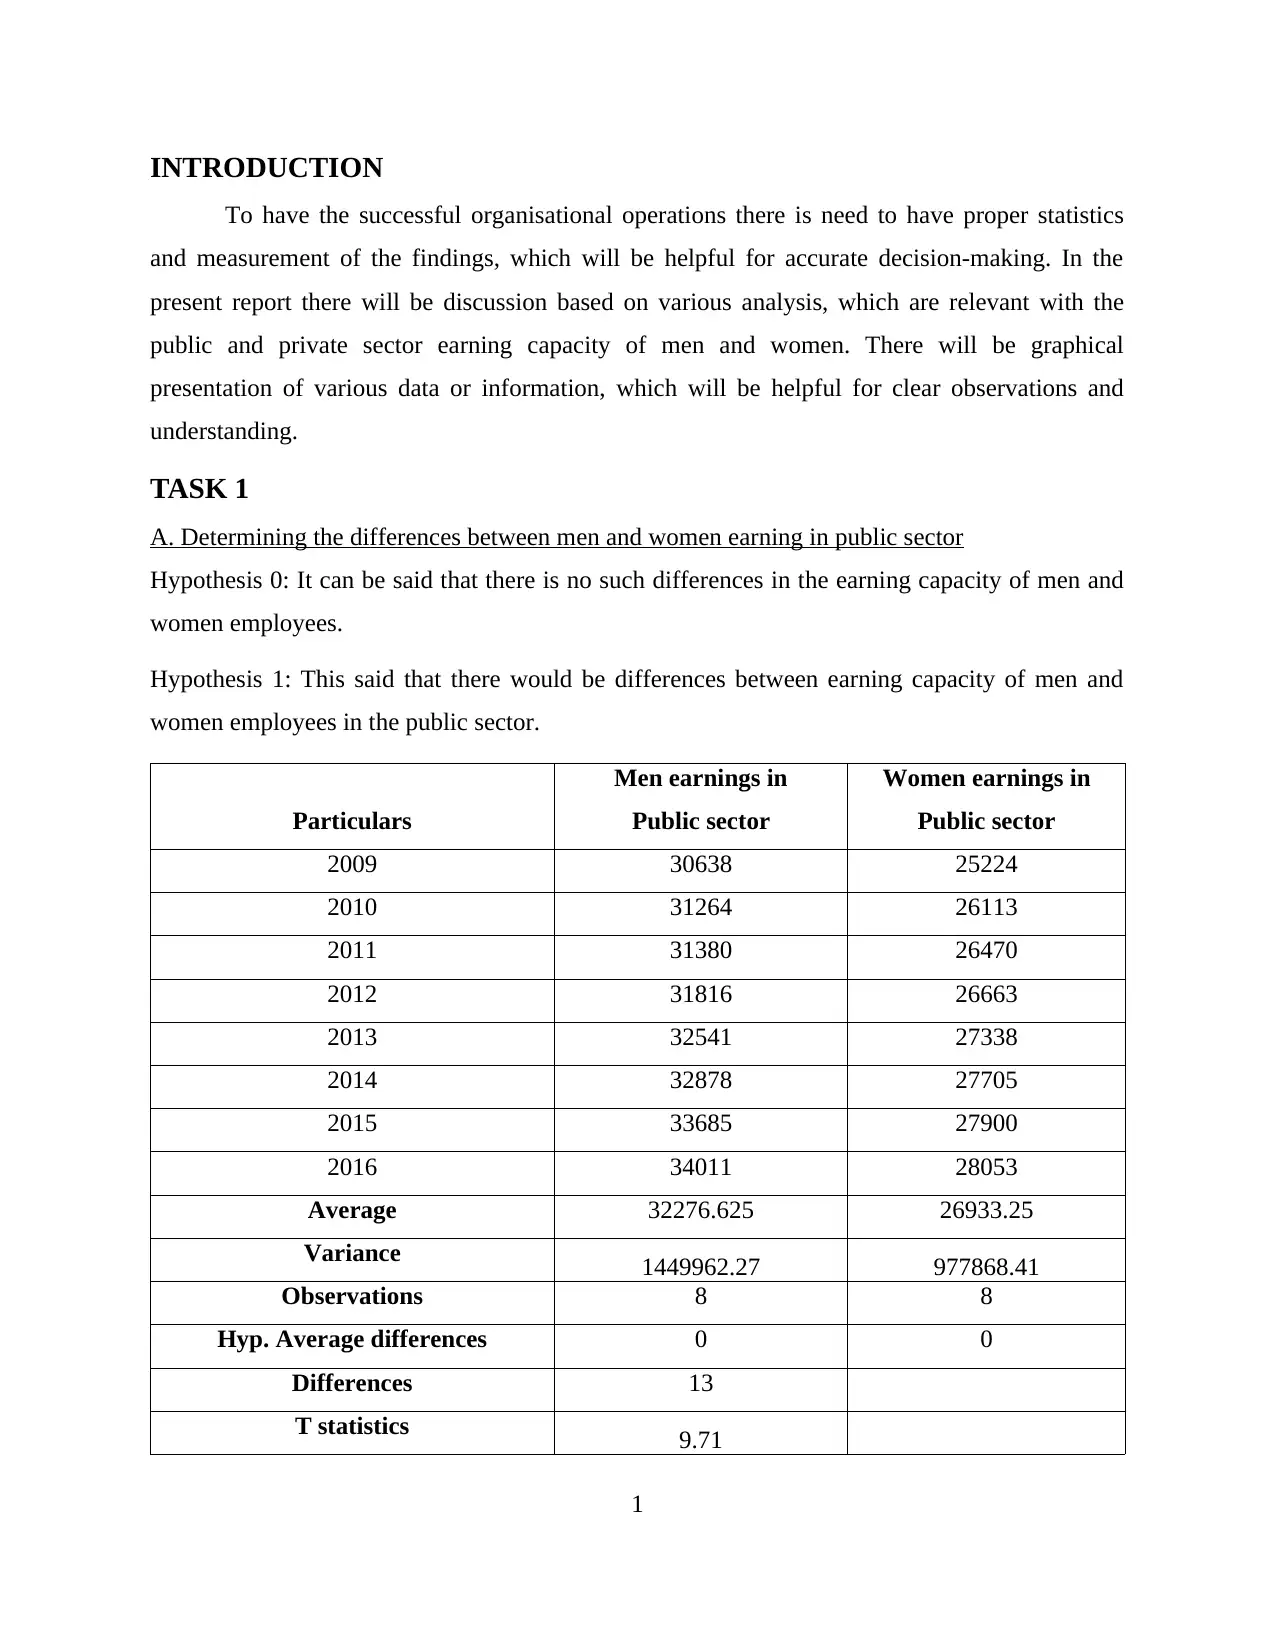
A. Determining the differences between men and women earning in public sector
Hypothesis 0: It can be said that there is no such differences in the earning capacity of men and
women employees.
Hypothesis 1: This said that there would be differences between earning capacity of men and
women employees in the public sector.
Particulars
Men earnings in
Public sector
Women earnings in
Public sector
2009 30638 25224
2010 31264 26113
2011 31380 26470
2012 31816 26663
2013 32541 27338
2014 32878 27705
2015 33685 27900
2016 34011 28053
Average 32276.625 26933.25
Variance 1449962.27 977868.41
Observations 8 8
Hyp. Average differences 0 0
Differences 13
T statistics 9.71
1
To have the successful organisational operations there is need to have proper statistics
and measurement of the findings, which will be helpful for accurate decision-making. In the
present report there will be discussion based on various analysis, which are relevant with the
public and private sector earning capacity of men and women. There will be graphical
presentation of various data or information, which will be helpful for clear observations and
understanding.
TASK 1
A. Determining the differences between men and women earning in public sector
Hypothesis 0: It can be said that there is no such differences in the earning capacity of men and
women employees.
Hypothesis 1: This said that there would be differences between earning capacity of men and
women employees in the public sector.
Particulars
Men earnings in
Public sector
Women earnings in
Public sector
2009 30638 25224
2010 31264 26113
2011 31380 26470
2012 31816 26663
2013 32541 27338
2014 32878 27705
2015 33685 27900
2016 34011 28053
Average 32276.625 26933.25
Variance 1449962.27 977868.41
Observations 8 8
Hyp. Average differences 0 0
Differences 13
T statistics 9.71
1
⊘ This is a preview!⊘
Do you want full access?
Subscribe today to unlock all pages.
Trusted by 1+ million students worldwide
P(T<=t) one-tail 1.2709E-07
t Critical one-tail 1.770933396
P(T<=t) two-tail 2.54179E-07
t Critical two-tail 2.160368656
Interpretation: In accordance with the above mentioned report it can be said that, there is
no such differences in the earning capacity of men and women it can be understand as per
1.27>0.05. Therefore, such analysis present that there is no such difference in their earning
capacity. Thus, it can be said that the ratio of their remuneration acquisition is same as per the
increment in the level of education and the reduction of dependency of women over men's. There
may be fewer numbers of women employees are available in the environment but they have the
adequate revenue generation which is balancing the ratio (Jimenez, Miller and Bridle, 2017).
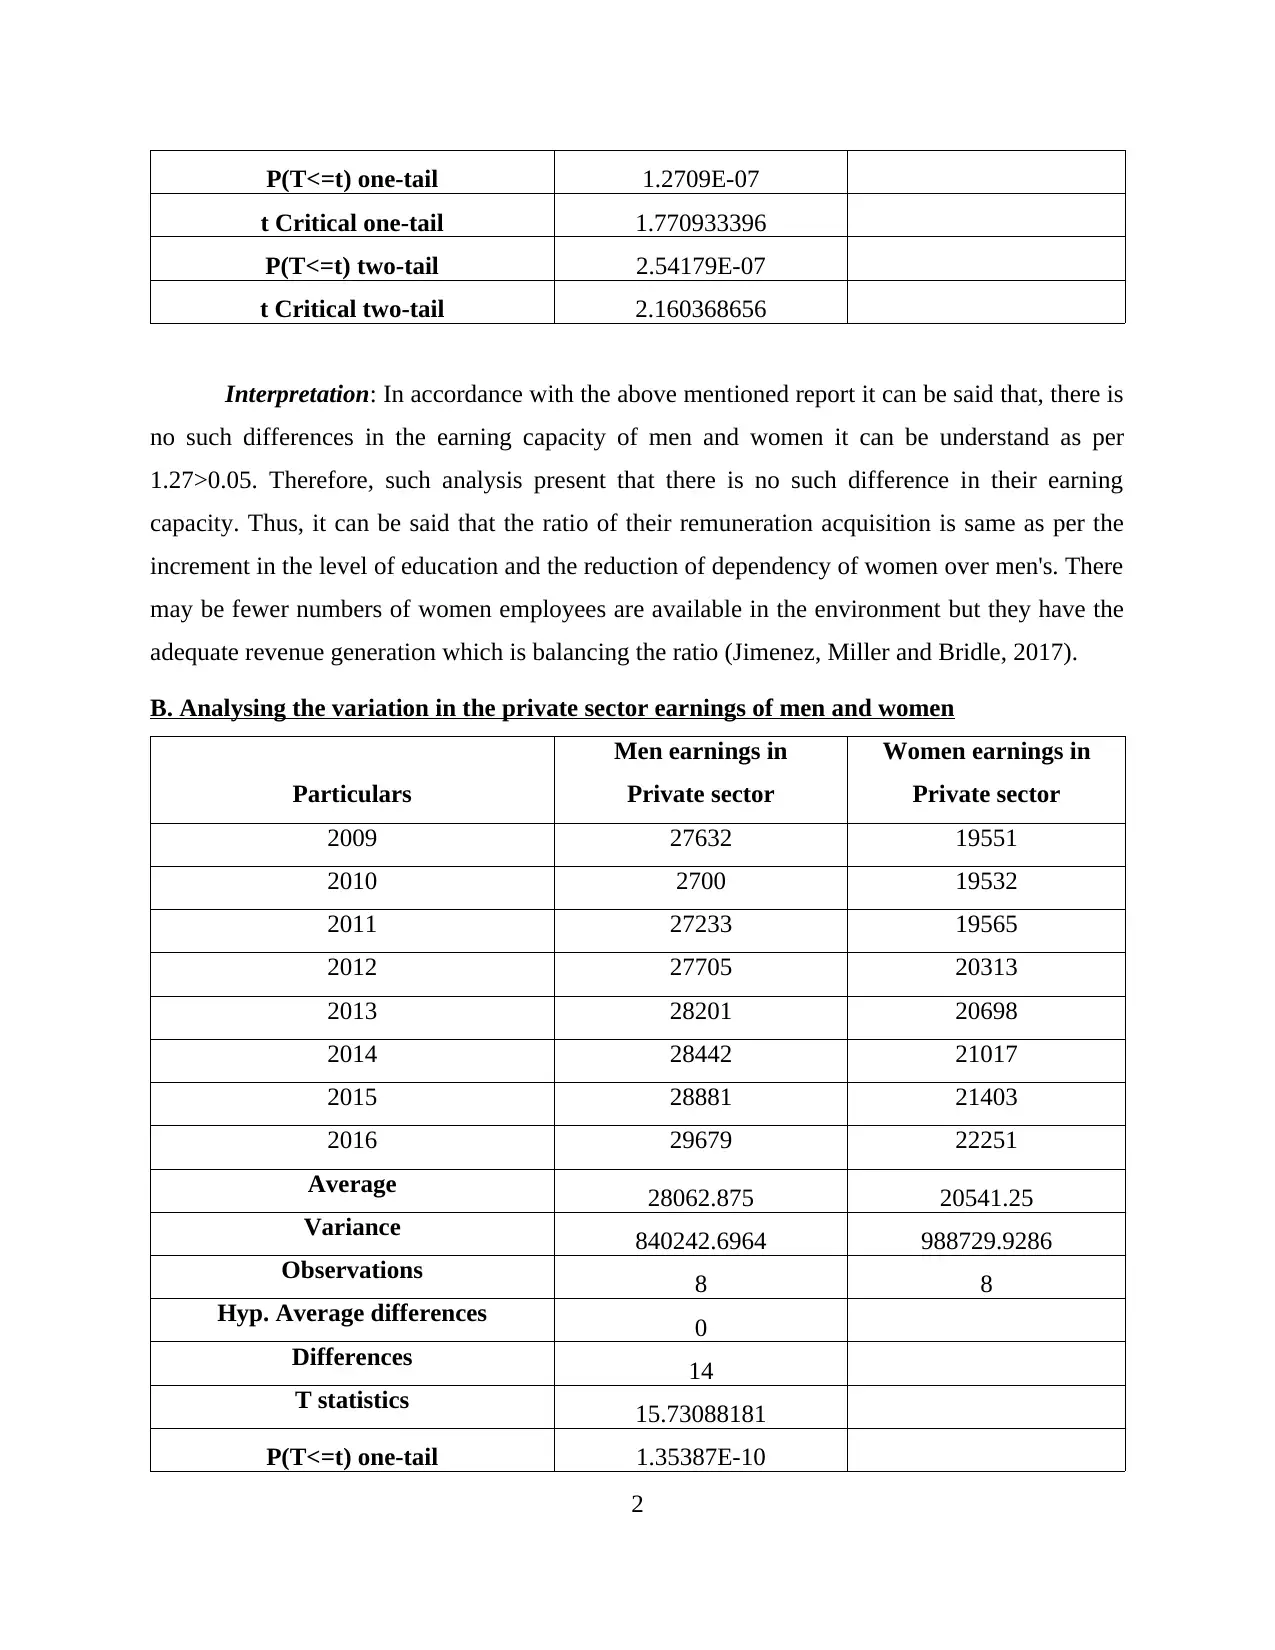
B. Analysing the variation in the private sector earnings of men and women
Particulars
Men earnings in
Private sector
Women earnings in
Private sector
2009 27632 19551
2010 2700 19532
2011 27233 19565
2012 27705 20313
2013 28201 20698
2014 28442 21017
2015 28881 21403
2016 29679 22251
Average 28062.875 20541.25
Variance 840242.6964 988729.9286
Observations 8 8
Hyp. Average differences 0
Differences 14
T statistics 15.73088181
P(T<=t) one-tail 1.35387E-10
2
t Critical one-tail 1.770933396
P(T<=t) two-tail 2.54179E-07
t Critical two-tail 2.160368656
Interpretation: In accordance with the above mentioned report it can be said that, there is
no such differences in the earning capacity of men and women it can be understand as per
1.27>0.05. Therefore, such analysis present that there is no such difference in their earning
capacity. Thus, it can be said that the ratio of their remuneration acquisition is same as per the
increment in the level of education and the reduction of dependency of women over men's. There
may be fewer numbers of women employees are available in the environment but they have the
adequate revenue generation which is balancing the ratio (Jimenez, Miller and Bridle, 2017).
B. Analysing the variation in the private sector earnings of men and women
Particulars
Men earnings in
Private sector
Women earnings in
Private sector
2009 27632 19551
2010 2700 19532
2011 27233 19565
2012 27705 20313
2013 28201 20698
2014 28442 21017
2015 28881 21403
2016 29679 22251
Average 28062.875 20541.25
Variance 840242.6964 988729.9286
Observations 8 8
Hyp. Average differences 0
Differences 14
T statistics 15.73088181
P(T<=t) one-tail 1.35387E-10
2
Paraphrase This Document
Need a fresh take? Get an instant paraphrase of this document with our AI Paraphraser
t Critical one-tail 1.761310136
P(T<=t) two-tail 2.70773E-10
t Critical two-tail 2.144786688
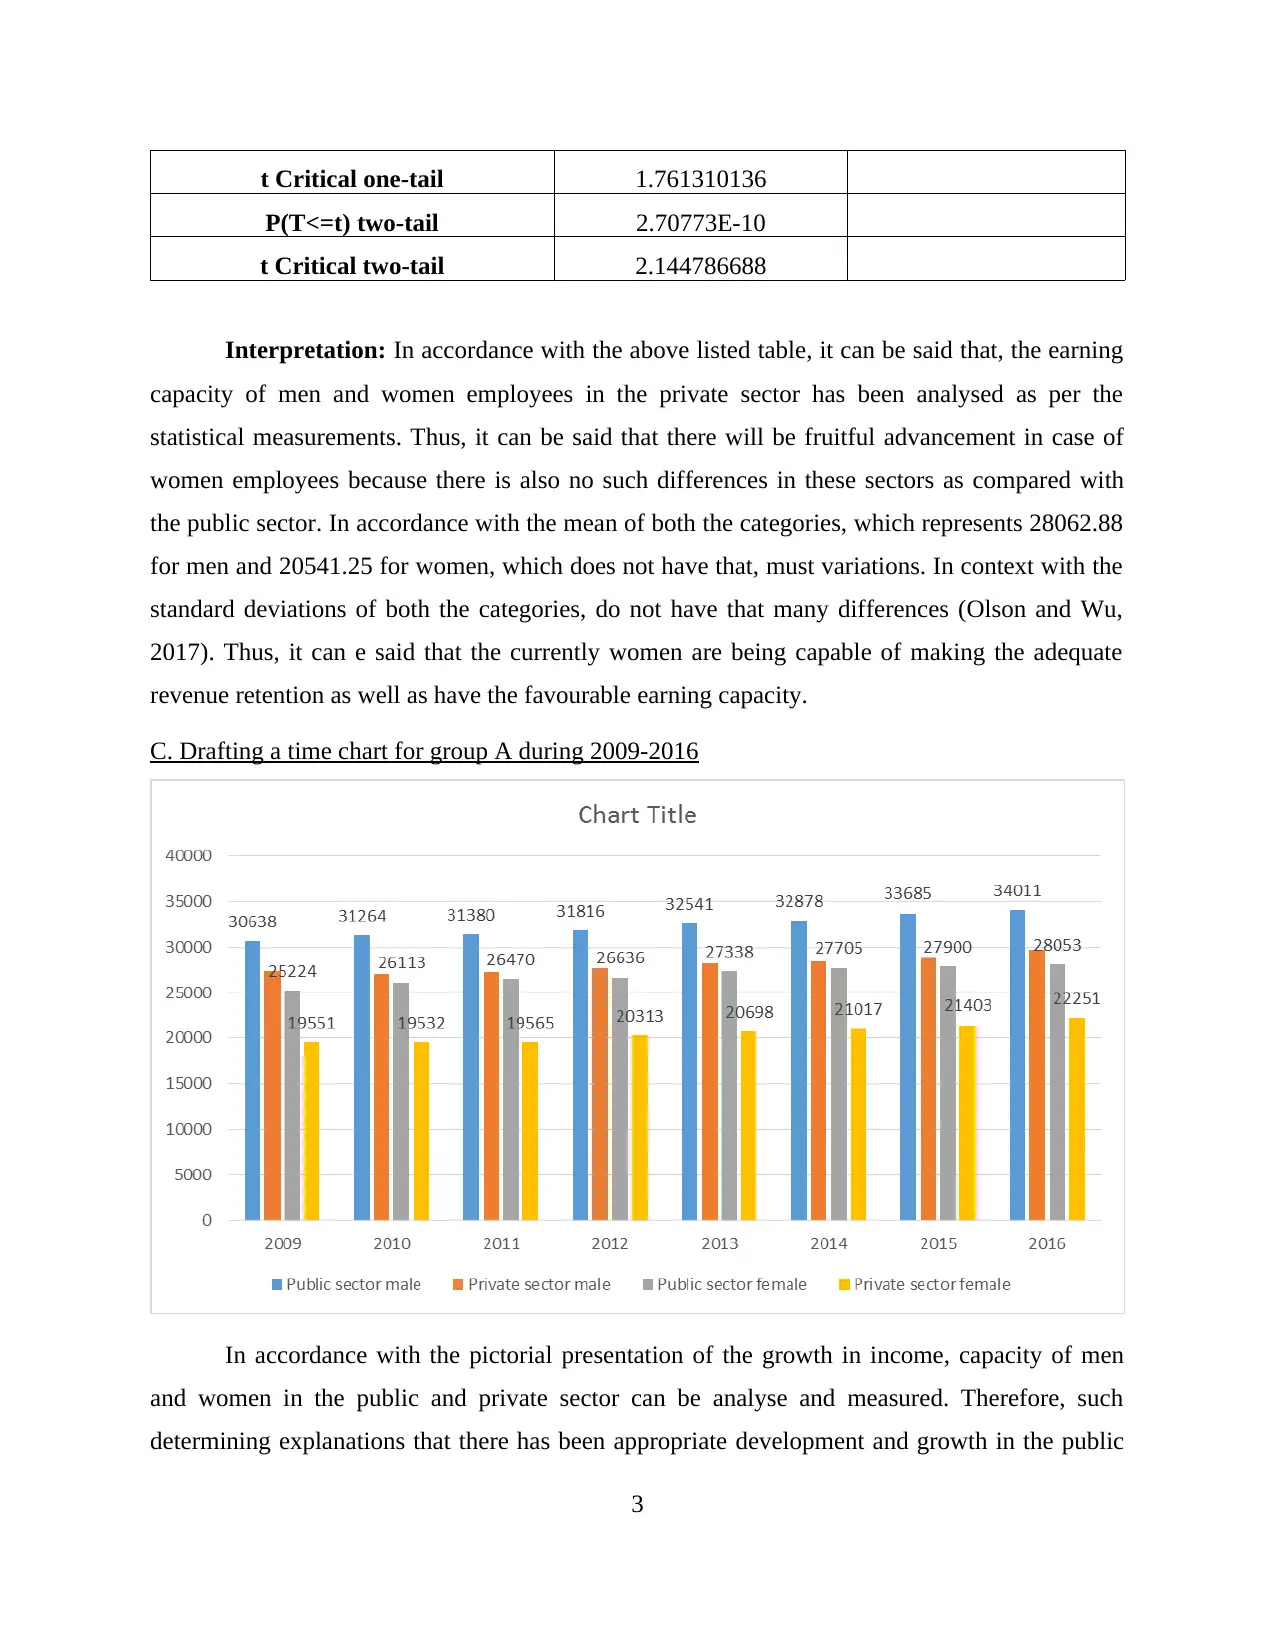
Interpretation: In accordance with the above listed table, it can be said that, the earning
capacity of men and women employees in the private sector has been analysed as per the
statistical measurements. Thus, it can be said that there will be fruitful advancement in case of
women employees because there is also no such differences in these sectors as compared with
the public sector. In accordance with the mean of both the categories, which represents 28062.88
for men and 20541.25 for women, which does not have that, must variations. In context with the
standard deviations of both the categories, do not have that many differences (Olson and Wu,
2017). Thus, it can e said that the currently women are being capable of making the adequate
revenue retention as well as have the favourable earning capacity.
C. Drafting a time chart for group A during 2009-2016
In accordance with the pictorial presentation of the growth in income, capacity of men
and women in the public and private sector can be analyse and measured. Therefore, such
determining explanations that there has been appropriate development and growth in the public
3
P(T<=t) two-tail 2.70773E-10
t Critical two-tail 2.144786688
Interpretation: In accordance with the above listed table, it can be said that, the earning
capacity of men and women employees in the private sector has been analysed as per the
statistical measurements. Thus, it can be said that there will be fruitful advancement in case of
women employees because there is also no such differences in these sectors as compared with
the public sector. In accordance with the mean of both the categories, which represents 28062.88
for men and 20541.25 for women, which does not have that, must variations. In context with the
standard deviations of both the categories, do not have that many differences (Olson and Wu,
2017). Thus, it can e said that the currently women are being capable of making the adequate
revenue retention as well as have the favourable earning capacity.
C. Drafting a time chart for group A during 2009-2016
In accordance with the pictorial presentation of the growth in income, capacity of men
and women in the public and private sector can be analyse and measured. Therefore, such
determining explanations that there has been appropriate development and growth in the public
3
and private sectors as per the increment in the level of earning form women employees (Shah
and Tarfaoui, 2017). However, in accordance with the public sector income of men employees
has risen as 30638 in 2009 to 34001 in 2016 while in the respect to the same the women workers
as 25224 in 2009 while in 2016 it reaches to 28053. In terms with the private sector, earning
capacity of men worker it was 27632 in 2009 while in 2016 it reaches to 29679 while the rise in
the income retention of women employees has growth such as 19551 in 2009, which increases to
22251 in 2016.
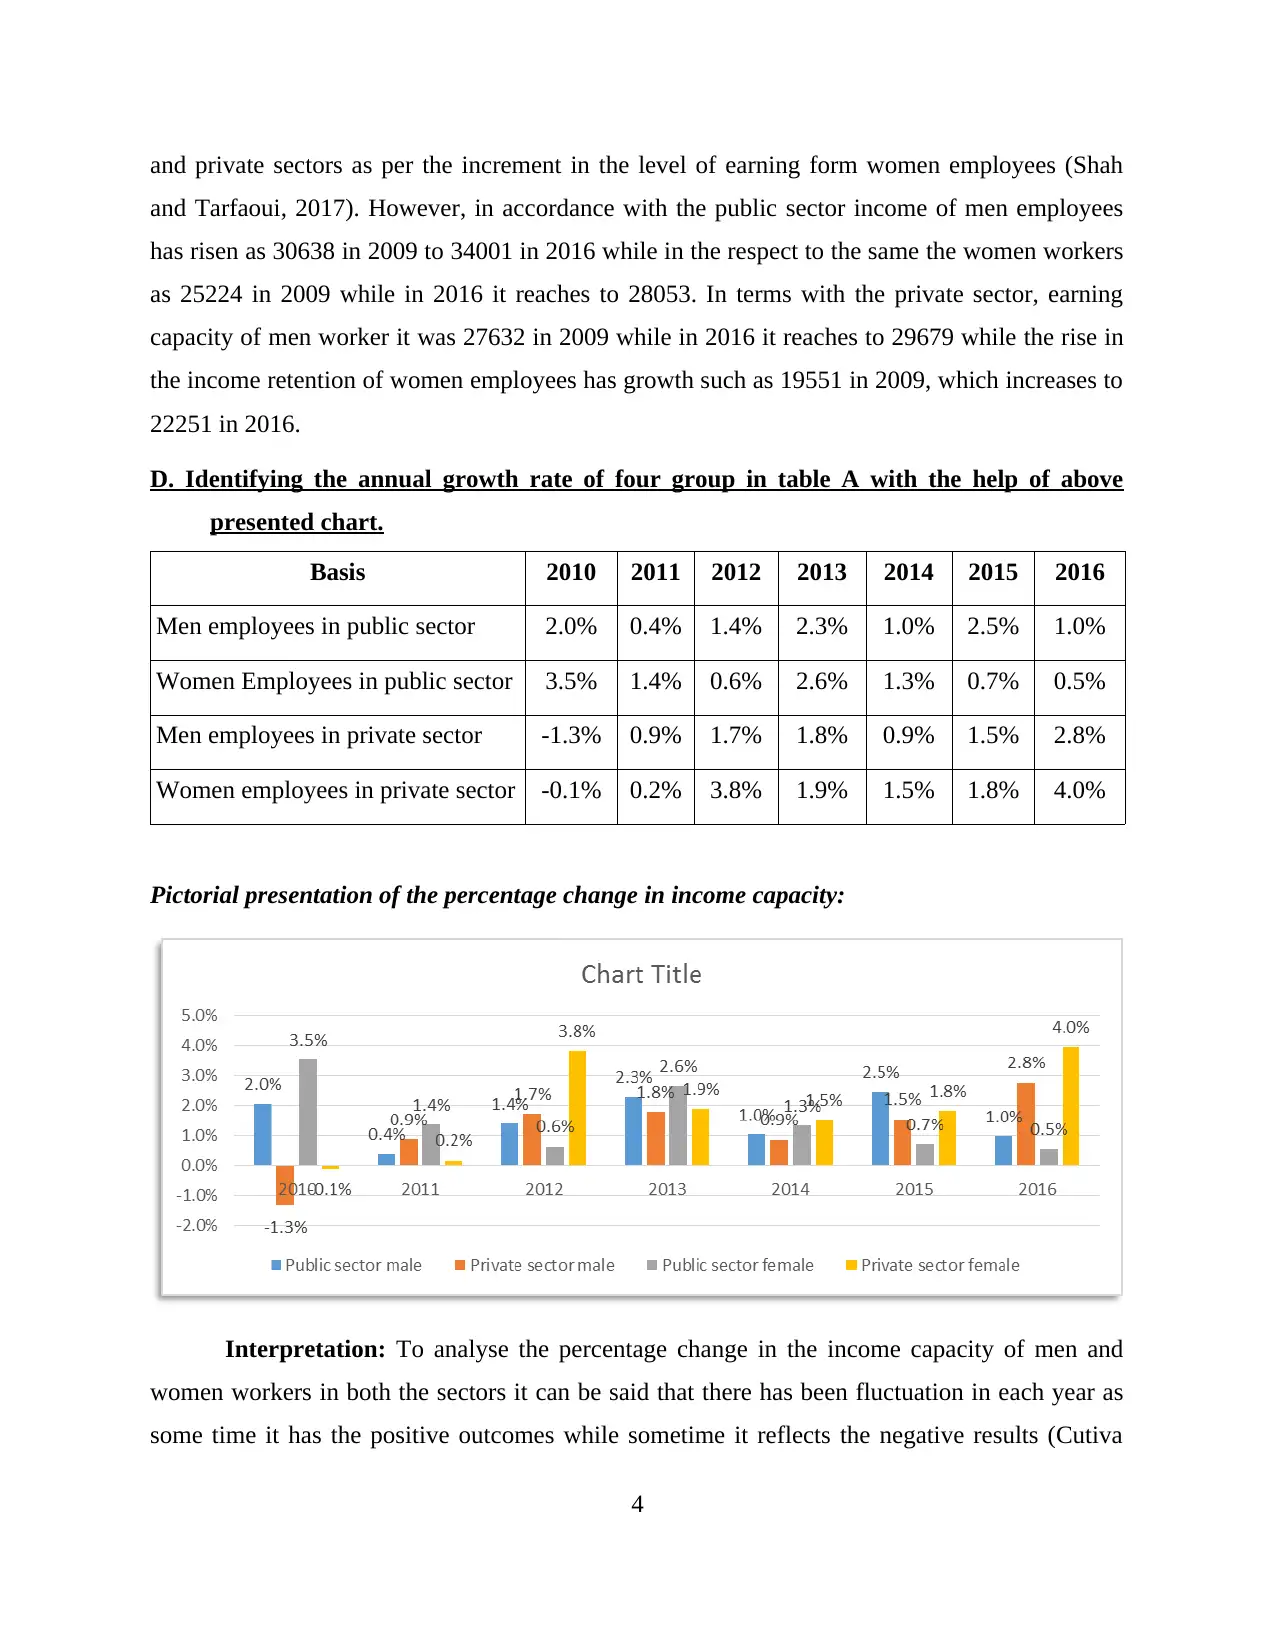
D. Identifying the annual growth rate of four group in table A with the help of above
presented chart.
Basis 2010 2011 2012 2013 2014 2015 2016
Men employees in public sector 2.0% 0.4% 1.4% 2.3% 1.0% 2.5% 1.0%
Women Employees in public sector 3.5% 1.4% 0.6% 2.6% 1.3% 0.7% 0.5%
Men employees in private sector -1.3% 0.9% 1.7% 1.8% 0.9% 1.5% 2.8%
Women employees in private sector -0.1% 0.2% 3.8% 1.9% 1.5% 1.8% 4.0%
Pictorial presentation of the percentage change in income capacity:
Interpretation: To analyse the percentage change in the income capacity of men and
women workers in both the sectors it can be said that there has been fluctuation in each year as
some time it has the positive outcomes while sometime it reflects the negative results (Cutiva
4
and Tarfaoui, 2017). However, in accordance with the public sector income of men employees
has risen as 30638 in 2009 to 34001 in 2016 while in the respect to the same the women workers
as 25224 in 2009 while in 2016 it reaches to 28053. In terms with the private sector, earning
capacity of men worker it was 27632 in 2009 while in 2016 it reaches to 29679 while the rise in
the income retention of women employees has growth such as 19551 in 2009, which increases to
22251 in 2016.
D. Identifying the annual growth rate of four group in table A with the help of above
presented chart.
Basis 2010 2011 2012 2013 2014 2015 2016
Men employees in public sector 2.0% 0.4% 1.4% 2.3% 1.0% 2.5% 1.0%
Women Employees in public sector 3.5% 1.4% 0.6% 2.6% 1.3% 0.7% 0.5%
Men employees in private sector -1.3% 0.9% 1.7% 1.8% 0.9% 1.5% 2.8%
Women employees in private sector -0.1% 0.2% 3.8% 1.9% 1.5% 1.8% 4.0%
Pictorial presentation of the percentage change in income capacity:
Interpretation: To analyse the percentage change in the income capacity of men and
women workers in both the sectors it can be said that there has been fluctuation in each year as
some time it has the positive outcomes while sometime it reflects the negative results (Cutiva
4
⊘ This is a preview!⊘
Do you want full access?
Subscribe today to unlock all pages.
Trusted by 1+ million students worldwide
and et.al., 2017). In accordance with the changes in the percentage of men employees in public
sectors, it has changes of 2.0% to 1.0% until 2016. In accordance with the women employees in
public sector, that has been changes as 3.5% to 0.5% until 2016. On the other side the percentage
variation in private sector men employees as -1.3% to 2.8% while in context with women
employees it has -0.1% to 4%. Thus, as per such analysis this can be said that, there is
appropriate development of employments and income capacity of both the categories of
employees. In comparison, with the public sector the private sector has rapid growth in the
revenue retention from women employees (Grohmann, 2017).
TASK 2
Section A
2.1 Presenting the data in the form of Diagram
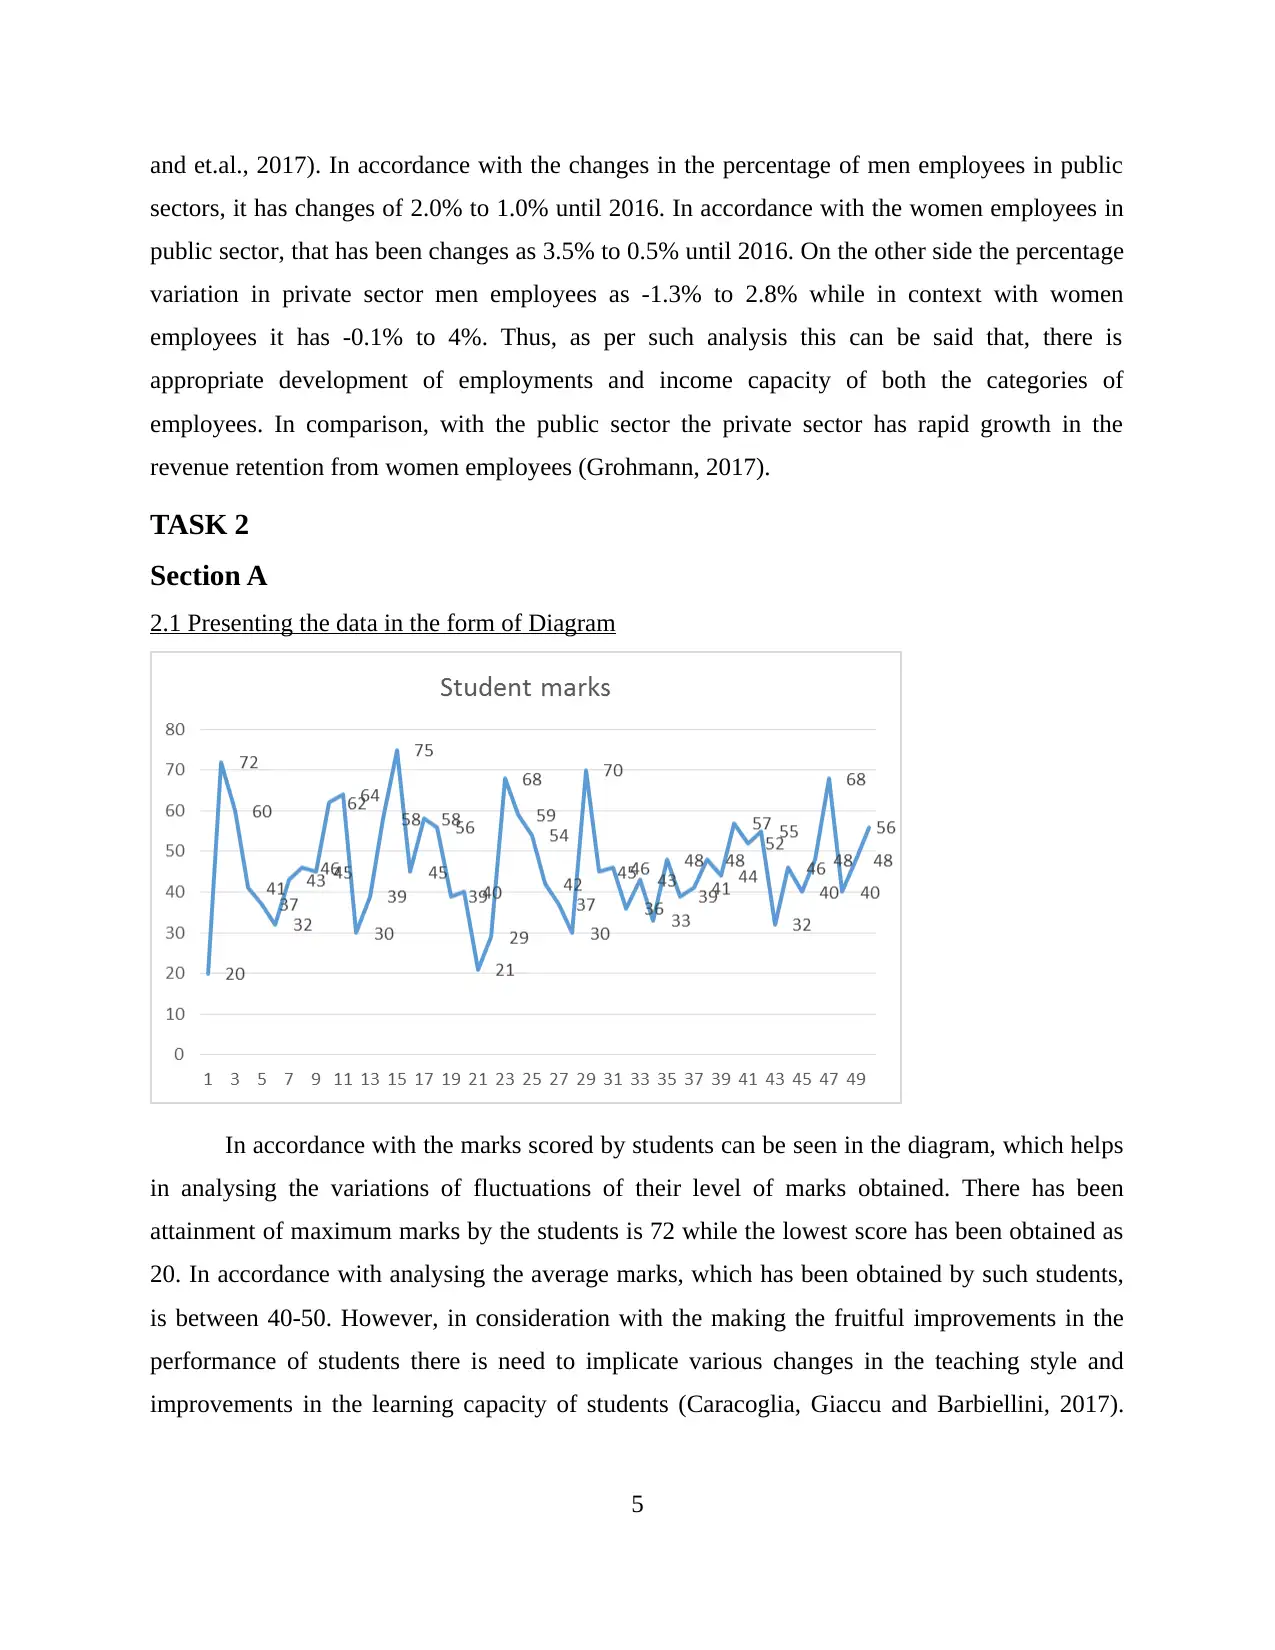
In accordance with the marks scored by students can be seen in the diagram, which helps
in analysing the variations of fluctuations of their level of marks obtained. There has been
attainment of maximum marks by the students is 72 while the lowest score has been obtained as
20. In accordance with analysing the average marks, which has been obtained by such students,
is between 40-50. However, in consideration with the making the fruitful improvements in the
performance of students there is need to implicate various changes in the teaching style and
improvements in the learning capacity of students (Caracoglia, Giaccu and Barbiellini, 2017).
5
sectors, it has changes of 2.0% to 1.0% until 2016. In accordance with the women employees in
public sector, that has been changes as 3.5% to 0.5% until 2016. On the other side the percentage
variation in private sector men employees as -1.3% to 2.8% while in context with women
employees it has -0.1% to 4%. Thus, as per such analysis this can be said that, there is
appropriate development of employments and income capacity of both the categories of
employees. In comparison, with the public sector the private sector has rapid growth in the
revenue retention from women employees (Grohmann, 2017).
TASK 2
Section A
2.1 Presenting the data in the form of Diagram
In accordance with the marks scored by students can be seen in the diagram, which helps
in analysing the variations of fluctuations of their level of marks obtained. There has been
attainment of maximum marks by the students is 72 while the lowest score has been obtained as
20. In accordance with analysing the average marks, which has been obtained by such students,
is between 40-50. However, in consideration with the making the fruitful improvements in the
performance of students there is need to implicate various changes in the teaching style and
improvements in the learning capacity of students (Caracoglia, Giaccu and Barbiellini, 2017).
5
Paraphrase This Document
Need a fresh take? Get an instant paraphrase of this document with our AI Paraphraser
The efforts must be made by school in terms of improving such results at least at 60% level of
marks must be obtained by students.
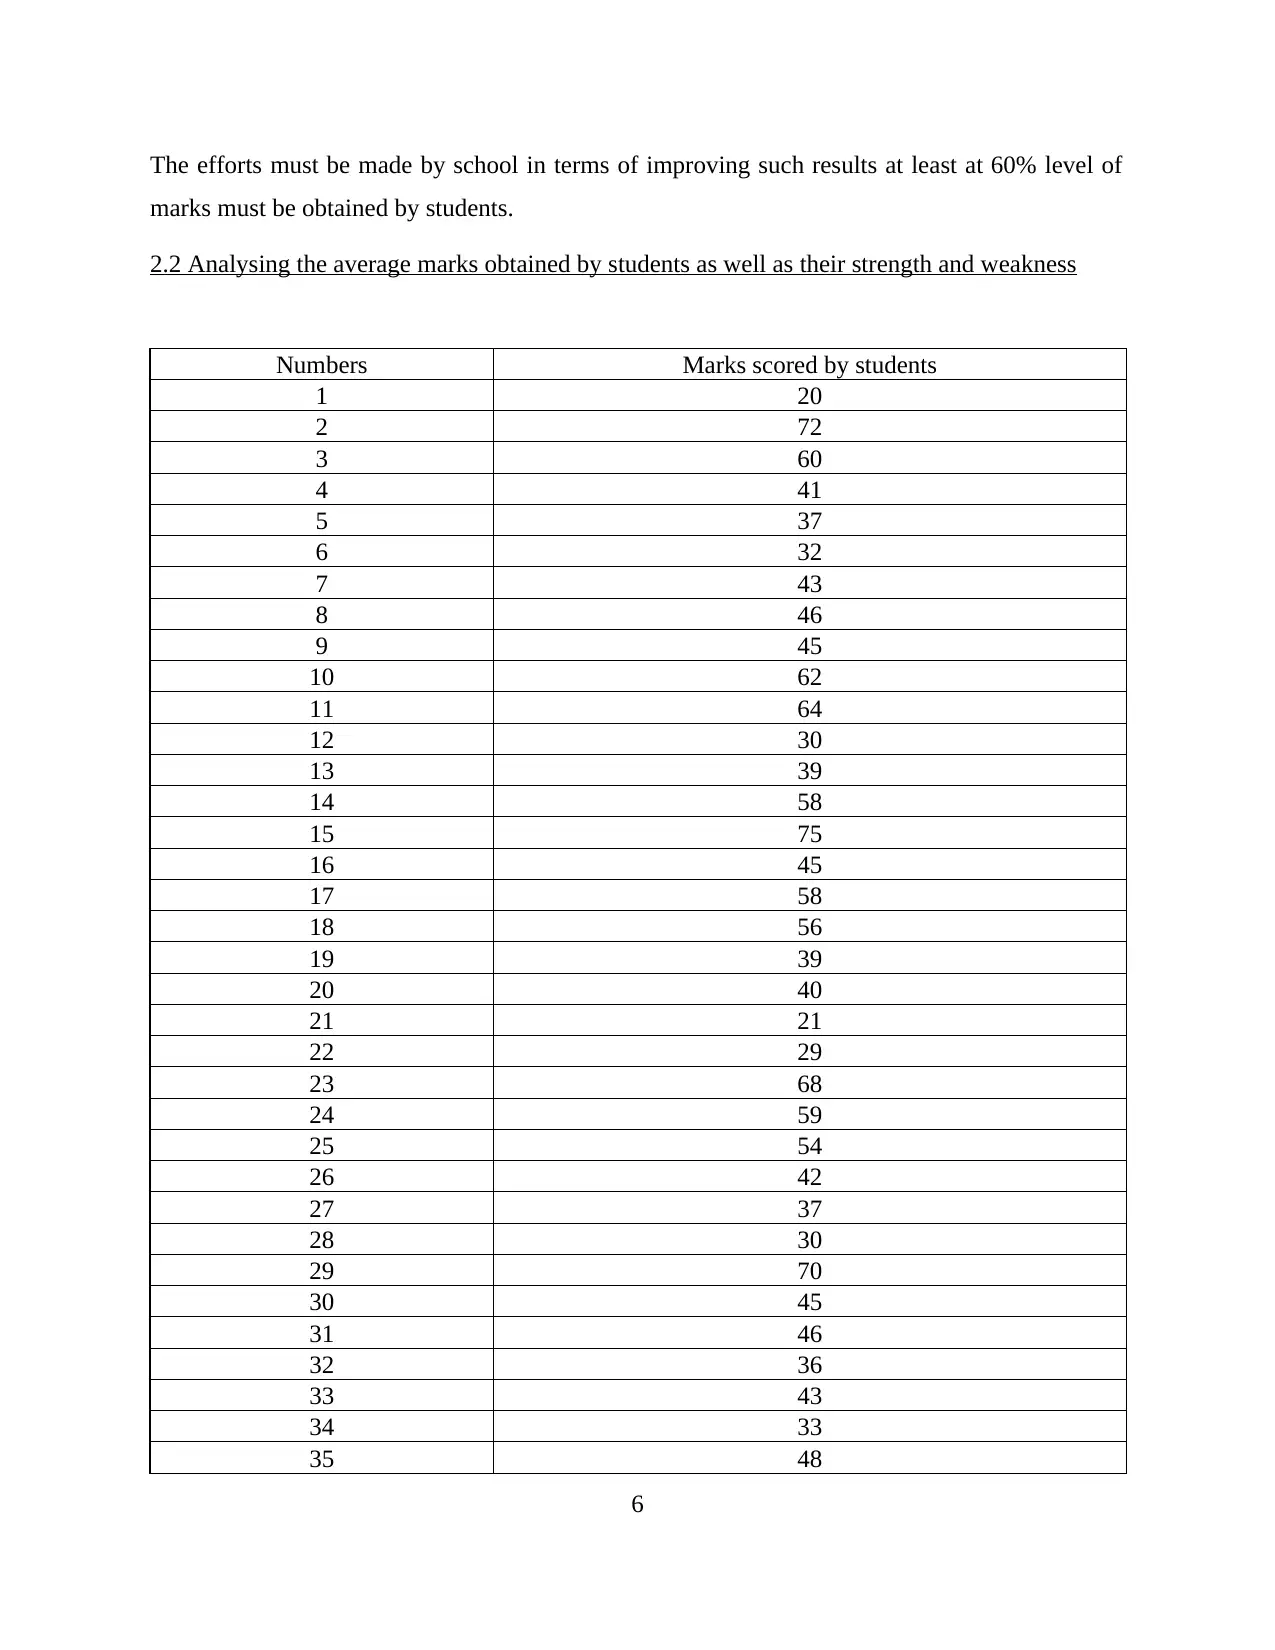
2.2 Analysing the average marks obtained by students as well as their strength and weakness
Numbers Marks scored by students
1 20
2 72
3 60
4 41
5 37
6 32
7 43
8 46
9 45
10 62
11 64
12 30
13 39
14 58
15 75
16 45
17 58
18 56
19 39
20 40
21 21
22 29
23 68
24 59
25 54
26 42
27 37
28 30
29 70
30 45
31 46
32 36
33 43
34 33
35 48
6
marks must be obtained by students.
2.2 Analysing the average marks obtained by students as well as their strength and weakness
Numbers Marks scored by students
1 20
2 72
3 60
4 41
5 37
6 32
7 43
8 46
9 45
10 62
11 64
12 30
13 39
14 58
15 75
16 45
17 58
18 56
19 39
20 40
21 21
22 29
23 68
24 59
25 54
26 42
27 37
28 30
29 70
30 45
31 46
32 36
33 43
34 33
35 48
6
36 39
37 41
38 48
39 44
40 57
41 52
42 55
43 32
44 46
45 40
46 48
47 68
48 40
49 48
50 56
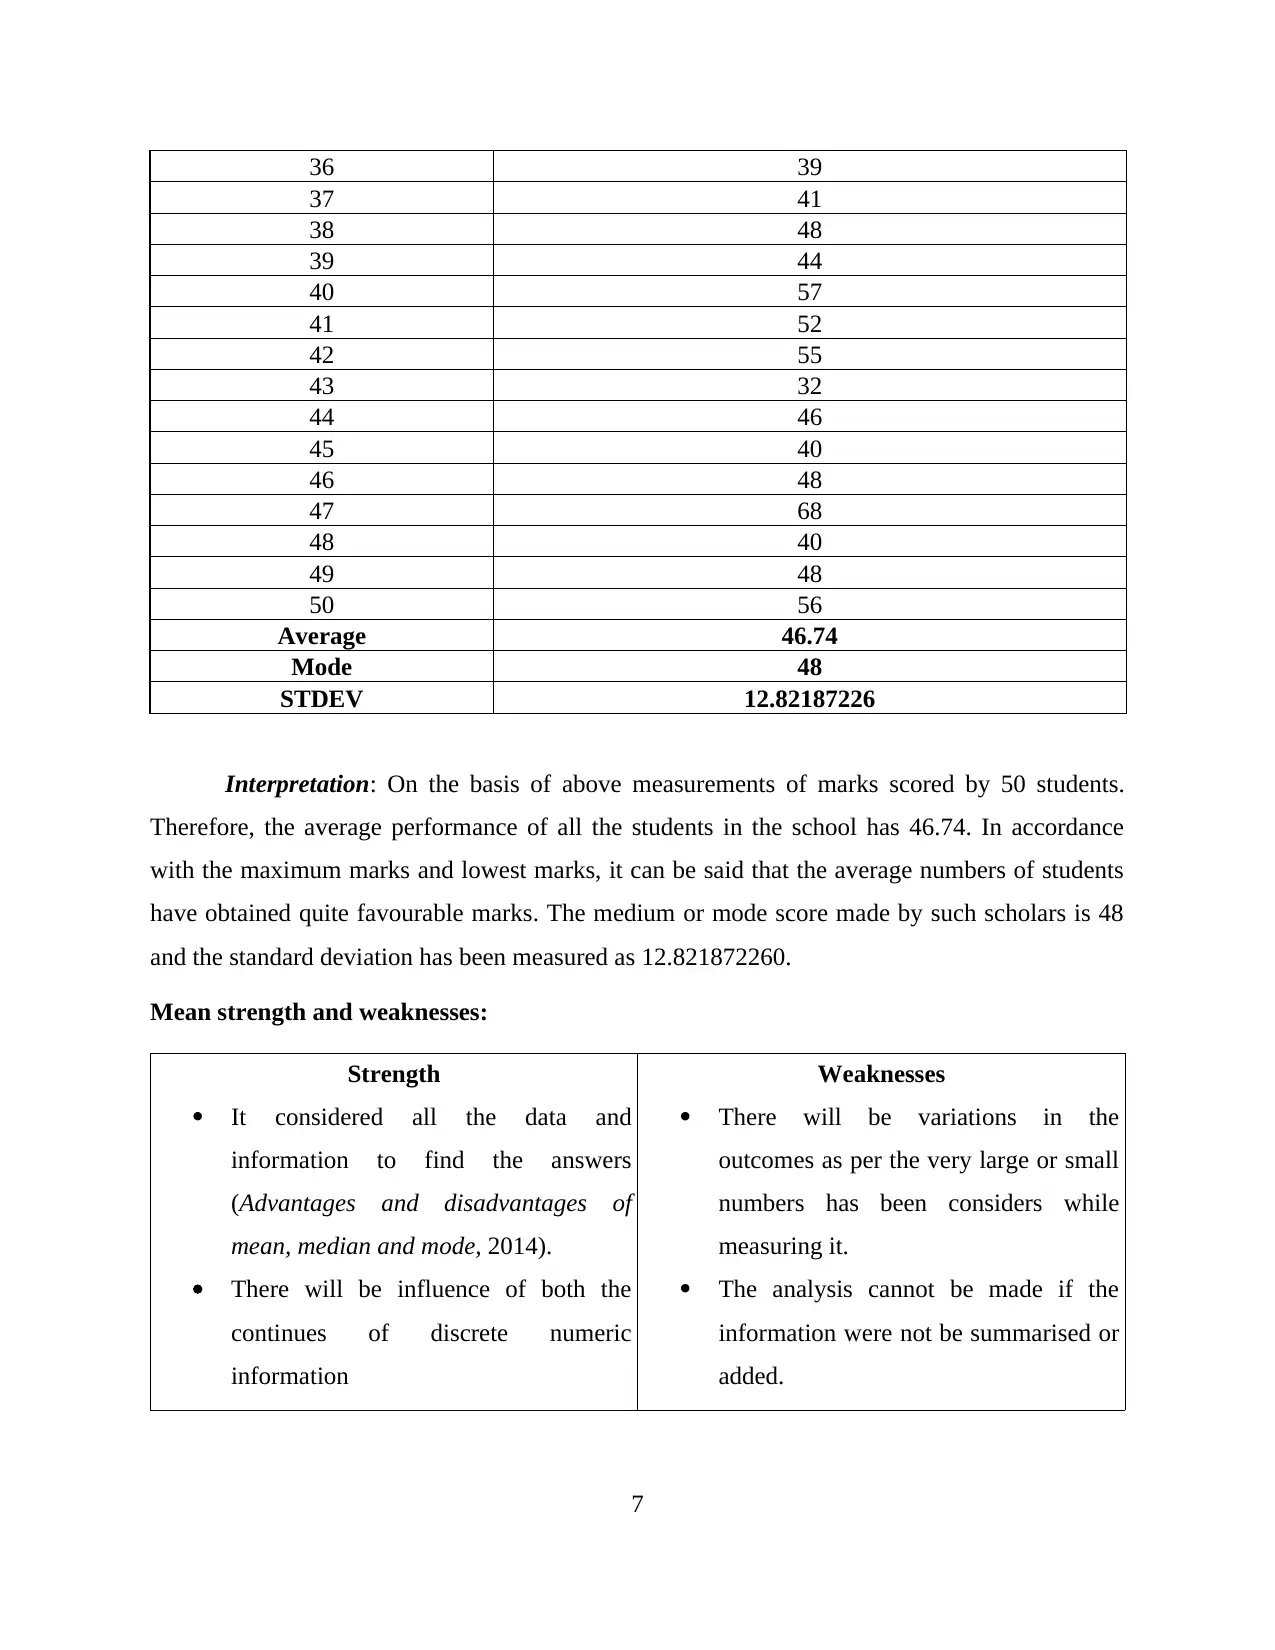
Average 46.74
Mode 48
STDEV 12.82187226
Interpretation: On the basis of above measurements of marks scored by 50 students.
Therefore, the average performance of all the students in the school has 46.74. In accordance
with the maximum marks and lowest marks, it can be said that the average numbers of students
have obtained quite favourable marks. The medium or mode score made by such scholars is 48
and the standard deviation has been measured as 12.821872260.
Mean strength and weaknesses:
Strength
It considered all the data and
information to find the answers
(Advantages and disadvantages of
mean, median and mode, 2014).
There will be influence of both the
continues of discrete numeric
information
Weaknesses
There will be variations in the
outcomes as per the very large or small
numbers has been considers while
measuring it.
The analysis cannot be made if the
information were not be summarised or
added.
7
37 41
38 48
39 44
40 57
41 52
42 55
43 32
44 46
45 40
46 48
47 68
48 40
49 48
50 56
Average 46.74
Mode 48
STDEV 12.82187226
Interpretation: On the basis of above measurements of marks scored by 50 students.
Therefore, the average performance of all the students in the school has 46.74. In accordance
with the maximum marks and lowest marks, it can be said that the average numbers of students
have obtained quite favourable marks. The medium or mode score made by such scholars is 48
and the standard deviation has been measured as 12.821872260.
Mean strength and weaknesses:
Strength
It considered all the data and
information to find the answers
(Advantages and disadvantages of
mean, median and mode, 2014).
There will be influence of both the
continues of discrete numeric
information
Weaknesses
There will be variations in the
outcomes as per the very large or small
numbers has been considers while
measuring it.
The analysis cannot be made if the
information were not be summarised or
added.
7
⊘ This is a preview!⊘
Do you want full access?
Subscribe today to unlock all pages.
Trusted by 1+ million students worldwide
Mode strength and weaknesses:
Strength
If the data is not facilitated in the data
set then the average will be considered
as the mode.
It can be analysed based on numerical
and categorical data apart from median
and mode.
Weaknesses
The analyses can representatives’ more
than one outcome.
If there is no same data or equal rang
series than mismeasurement will not
took place (Statistical Language -
Measures of Central Tendency, 2013).
There will be less accuracy in terms of
outcomes.
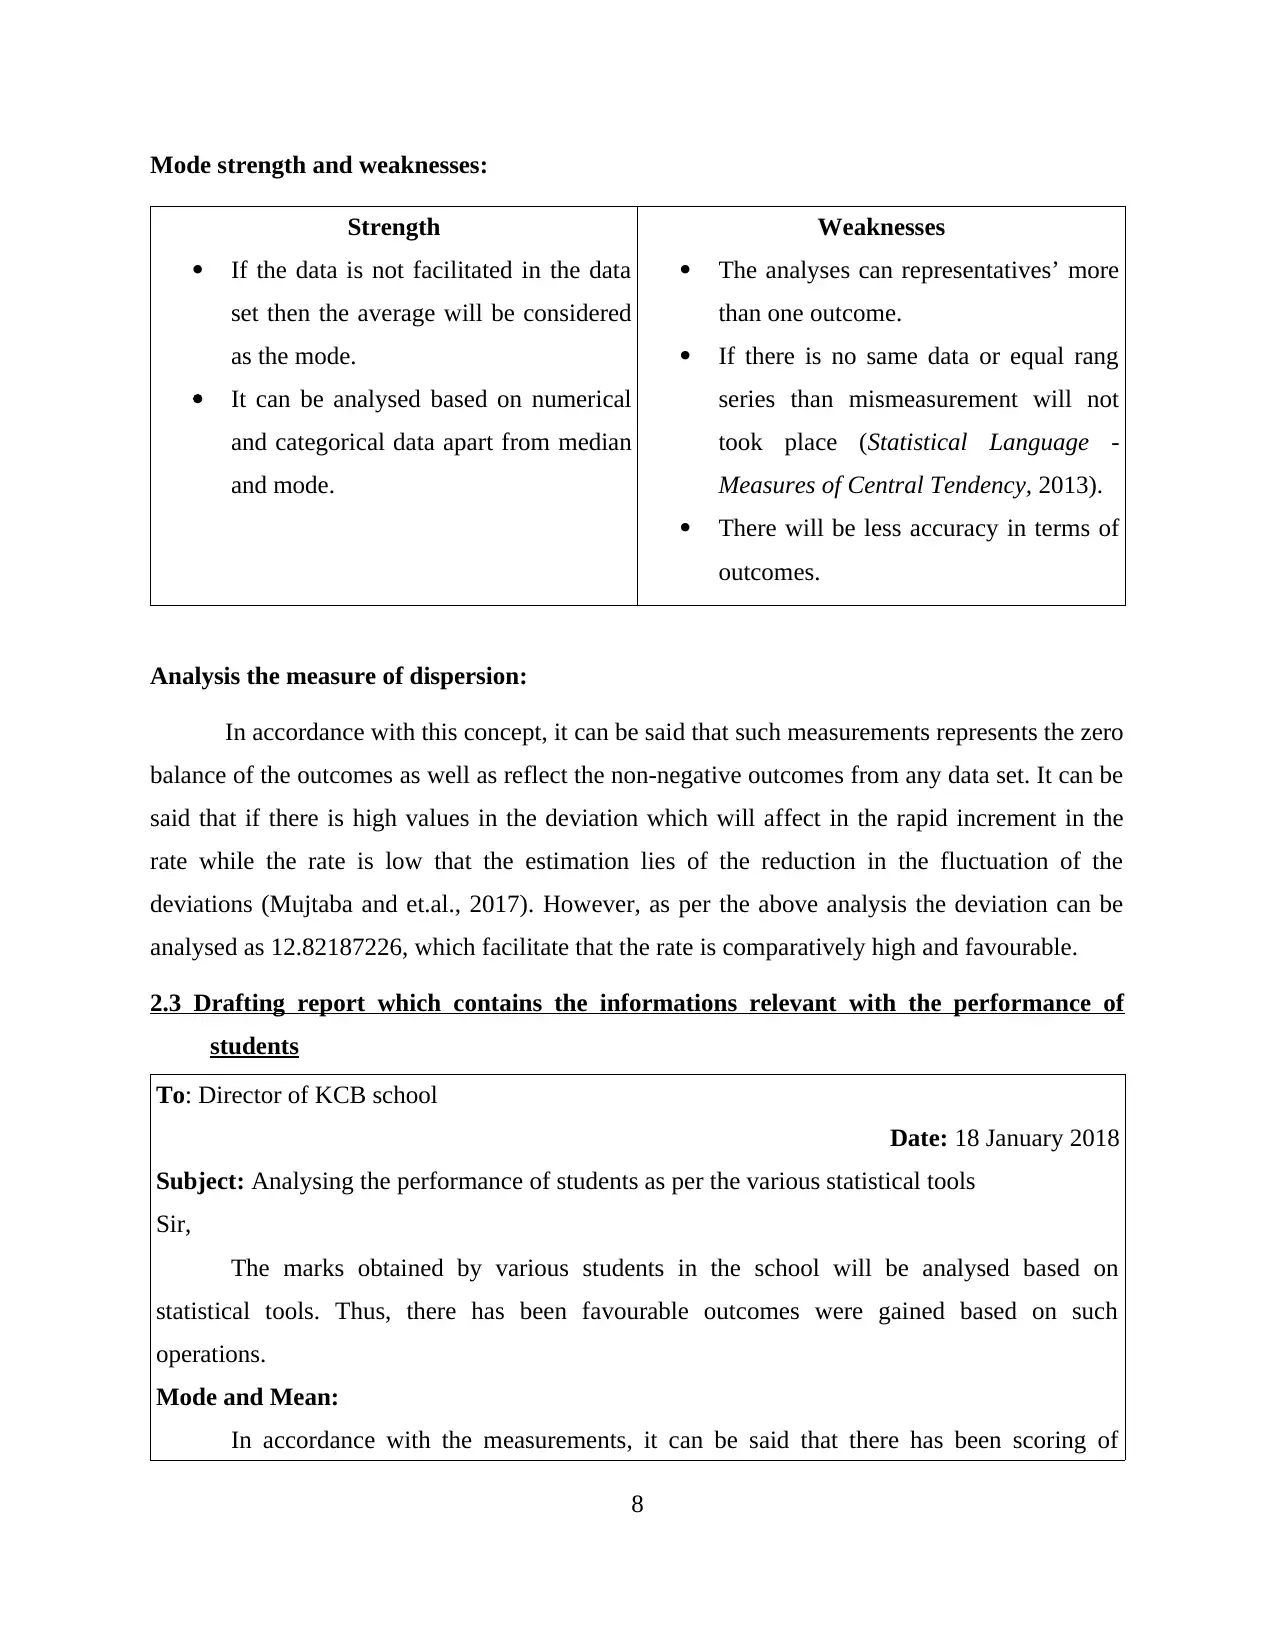
Analysis the measure of dispersion:
In accordance with this concept, it can be said that such measurements represents the zero
balance of the outcomes as well as reflect the non-negative outcomes from any data set. It can be
said that if there is high values in the deviation which will affect in the rapid increment in the
rate while the rate is low that the estimation lies of the reduction in the fluctuation of the
deviations (Mujtaba and et.al., 2017). However, as per the above analysis the deviation can be
analysed as 12.82187226, which facilitate that the rate is comparatively high and favourable.
2.3 Drafting report which contains the informations relevant with the performance of
students
To: Director of KCB school
Date: 18 January 2018
Subject: Analysing the performance of students as per the various statistical tools
Sir,
The marks obtained by various students in the school will be analysed based on
statistical tools. Thus, there has been favourable outcomes were gained based on such
operations.
Mode and Mean:
In accordance with the measurements, it can be said that there has been scoring of
8
Strength
If the data is not facilitated in the data
set then the average will be considered
as the mode.
It can be analysed based on numerical
and categorical data apart from median
and mode.
Weaknesses
The analyses can representatives’ more
than one outcome.
If there is no same data or equal rang
series than mismeasurement will not
took place (Statistical Language -
Measures of Central Tendency, 2013).
There will be less accuracy in terms of
outcomes.
Analysis the measure of dispersion:
In accordance with this concept, it can be said that such measurements represents the zero
balance of the outcomes as well as reflect the non-negative outcomes from any data set. It can be
said that if there is high values in the deviation which will affect in the rapid increment in the
rate while the rate is low that the estimation lies of the reduction in the fluctuation of the
deviations (Mujtaba and et.al., 2017). However, as per the above analysis the deviation can be
analysed as 12.82187226, which facilitate that the rate is comparatively high and favourable.
2.3 Drafting report which contains the informations relevant with the performance of
students
To: Director of KCB school
Date: 18 January 2018
Subject: Analysing the performance of students as per the various statistical tools
Sir,
The marks obtained by various students in the school will be analysed based on
statistical tools. Thus, there has been favourable outcomes were gained based on such
operations.
Mode and Mean:
In accordance with the measurements, it can be said that there has been scoring of
8
Paraphrase This Document
Need a fresh take? Get an instant paraphrase of this document with our AI Paraphraser
market with the average of 46.74 while the mode of such data set is 48. There is no such
variation in both of the results. Therefore, in comparison with the maximum marks obtained and
the lowest score which are 20 and 72. Thus, the mean and mode is having the favourable
outcomes.
Standard deviation:
In accordance with the standard deviation the outcomes are being obtained by such
operations is as 12.82187226, which indicate the high rate. Thus, the high rate means high
profitability and the favourable performance of the students. However, in these regards it will
be suggested that there is need to pay attention over rising the performance of students. It can be
done through appointing the skilled and qualified teachers to teach them (Du and et.al., 2017).
Section B
2.4 Determining the average weights of children with the help of line of best fit
9
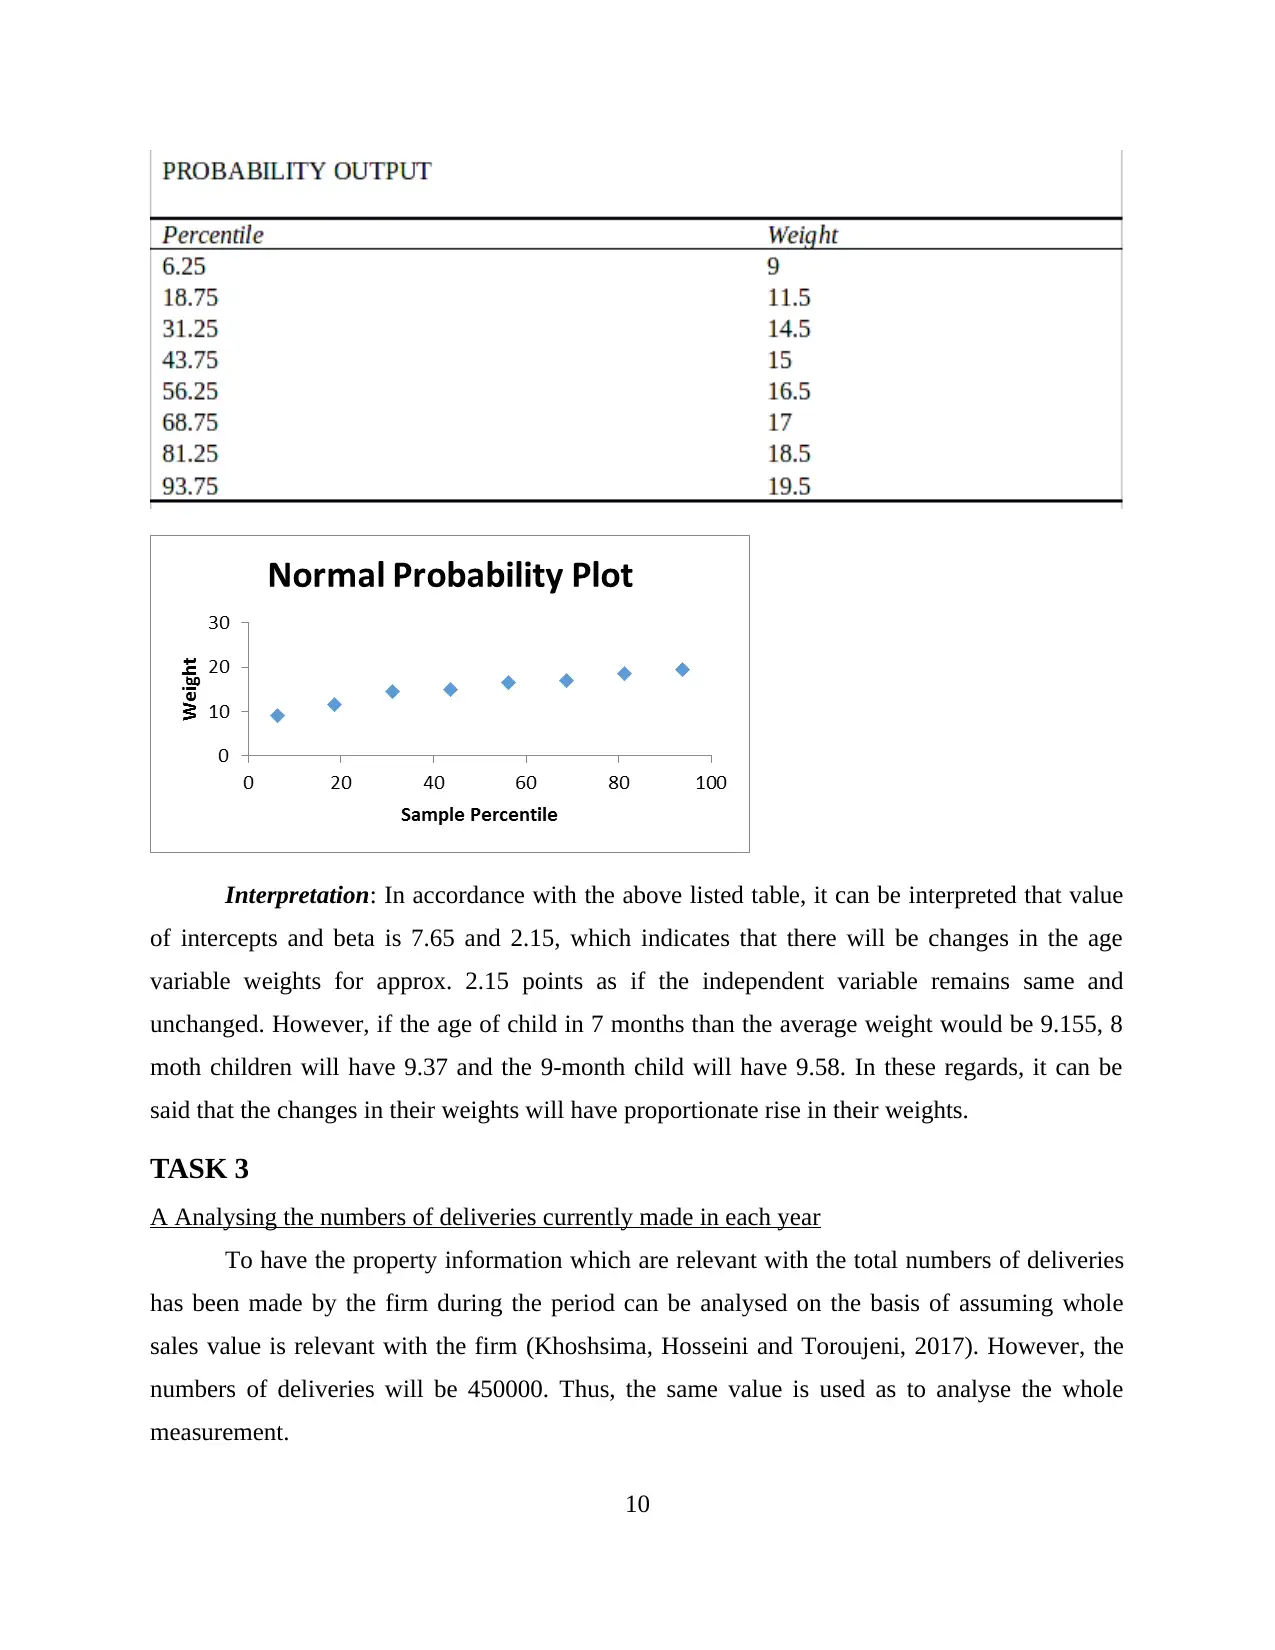
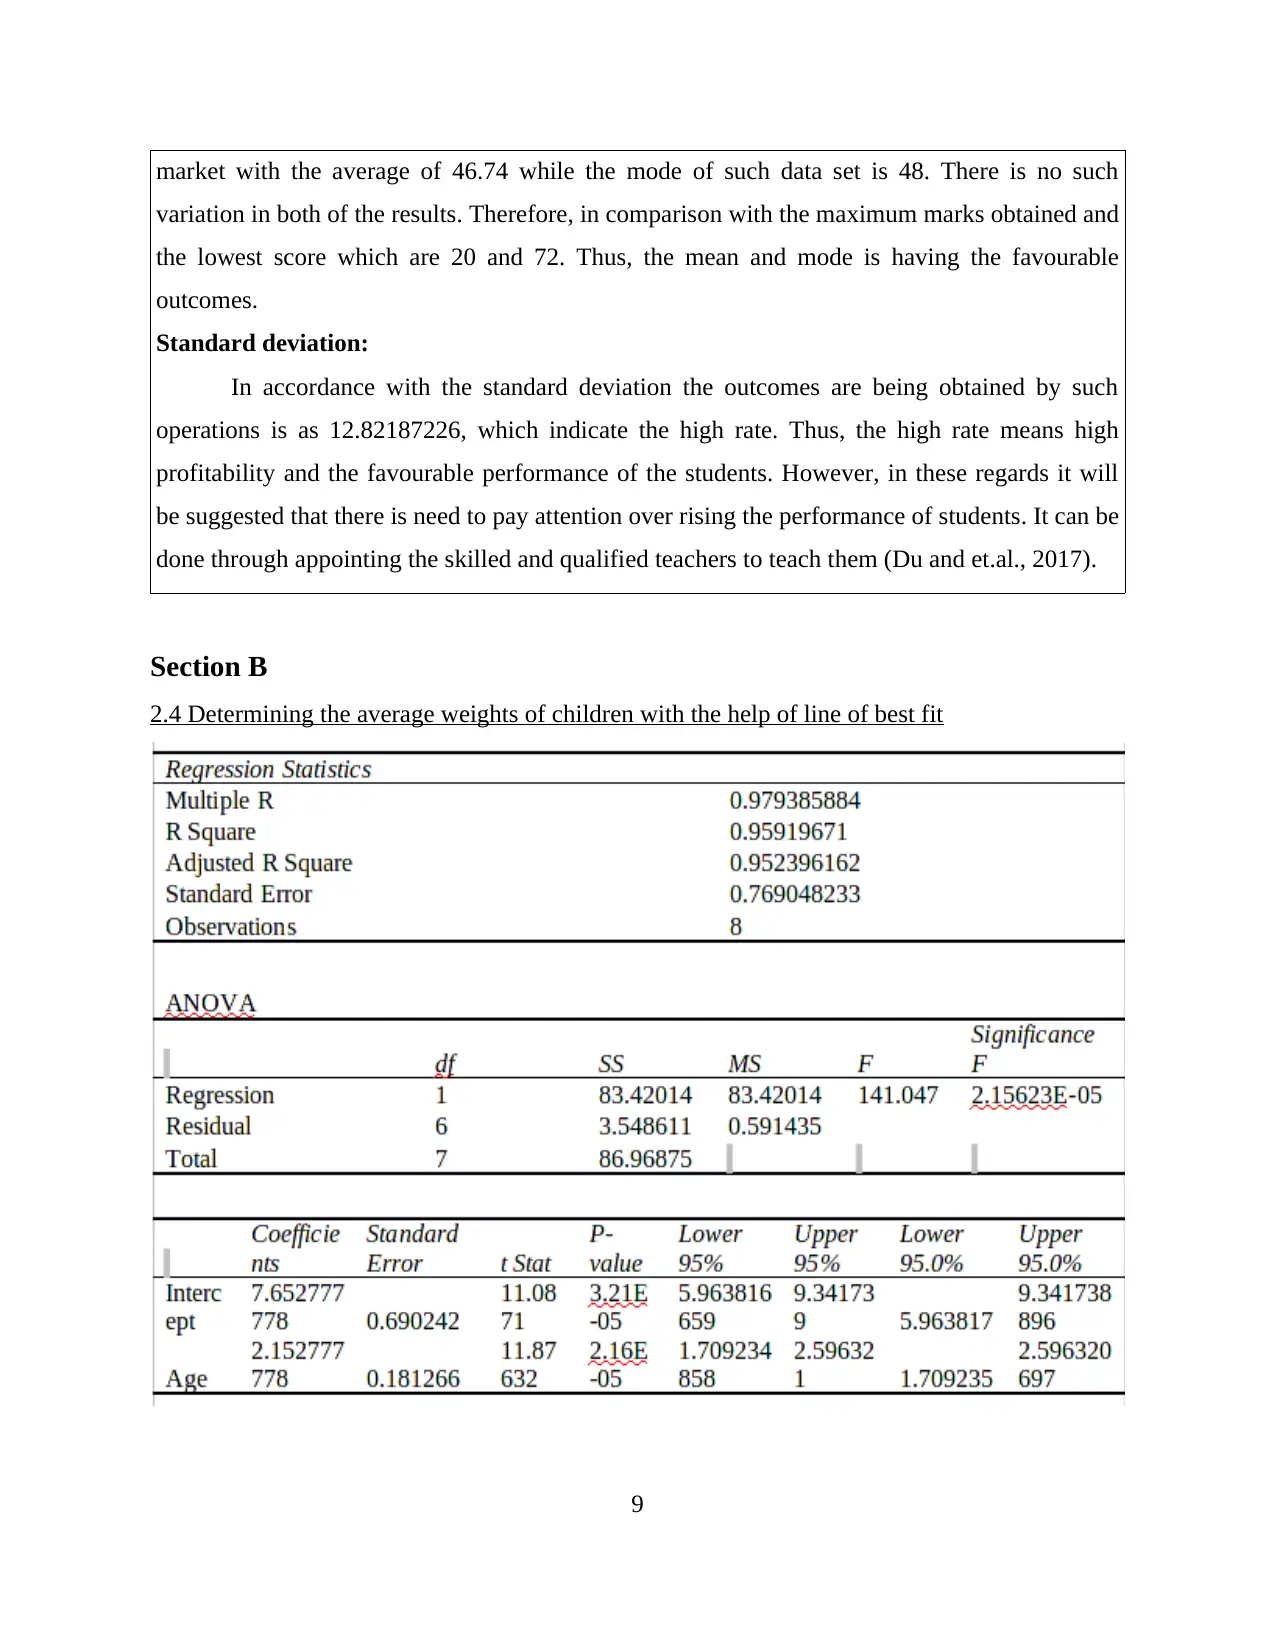
Interpretation: In accordance with the above listed table, it can be interpreted that value
of intercepts and beta is 7.65 and 2.15, which indicates that there will be changes in the age
variable weights for approx. 2.15 points as if the independent variable remains same and
unchanged. However, if the age of child in 7 months than the average weight would be 9.155, 8
moth children will have 9.37 and the 9-month child will have 9.58. In these regards, it can be
said that the changes in their weights will have proportionate rise in their weights.
TASK 3
A Analysing the numbers of deliveries currently made in each year
To have the property information which are relevant with the total numbers of deliveries
has been made by the firm during the period can be analysed on the basis of assuming whole
sales value is relevant with the firm (Khoshsima, Hosseini and Toroujeni, 2017). However, the
numbers of deliveries will be 450000. Thus, the same value is used as to analyse the whole
measurement.
10
⊘ This is a preview!⊘
Do you want full access?
Subscribe today to unlock all pages.
Trusted by 1+ million students worldwide
1 out of 19
Related Documents


Your All-in-One AI-Powered Toolkit for Academic Success.
+13062052269
info@desklib.com
Available 24*7 on WhatsApp / Email
![[object Object]](/_next/static/media/star-bottom.7253800d.svg)
Unlock your academic potential
Copyright © 2020–2026 A2Z Services. All Rights Reserved. Developed and managed by ZUCOL.