Statistics for Management: Evaluating Data and Statistical Methods
VerifiedAdded on 2021/01/02
|22
|4657
|92
Report
AI Summary
This report on statistics for management delves into the analysis of business and economic data, utilizing various statistical methods. It begins with an introduction to business statistics and then proceeds to analyze Consumer Price Indices (CPI) and Retail Price Indices (RPI), including the statistical data from 2007 to 2017. The report also compares CPI, CPIH, and RPI, discussing their differences and applications. It further evaluates qualitative and quantitative data, using examples like O-give curves to determine medians, and calculates interquartile ranges, means, and standard deviations. The report also examines the gender pay gap using national statistics data. It concludes with a discussion of statistical methods in business planning, inventory management, and capacity management, along with graphical and tabular representations of findings.

STATISTICS FOR
MANAGEMENT
MANAGEMENT
Paraphrase This Document
Need a fresh take? Get an instant paraphrase of this document with our AI Paraphraser
Table of Contents
INTRODUCTION...........................................................................................................................3
ACTIVITY 1....................................................................................................................................3
P1Process and nature of business and economic data with different published sources........3
P2 Data form variety of sources using various methods of analysis......................................6
M1 Evaluation of sources other than the NSO with regard to the gender pay gap................9
Activity 2.........................................................................................................................................9
P3 Evaluation of qualitative and quantitative data from a range of examples and appropriate
statistical methods..................................................................................................................9
M2 Differences in statistical application in activity 2..........................................................13
D1 Difference between descriptive, exploratory and confirmatory analysis with examples 13
ACTIVITY 3..................................................................................................................................15
P4 Statistical methods used in business planning, inventory management and capacity
management..........................................................................................................................15
M3 the use of the statistical methods used in activity 3.......................................................16
D2 Recommendation and judgements made in activity 3....................................................16
ACTIVITY 4..................................................................................................................................17
P5 Use of adequate charts and tables to execute the findings for a various variables.........17
M4 Justification regarding graphical representations used in activity 1 and 2....................20
D3 Use of graphical and tabular representations used in 1 and 2 activities.........................20
CONCLUSION..............................................................................................................................20
REFRENCES ................................................................................................................................22
INTRODUCTION
Business statistics can be defined as science of good decisions which make under case of
uncertainty such as financial analysis, auditing operations and production etc. It generally covers
statistical study and descriptive stats for collecting, analysing and interpreting the data. Statistical
analysis helps an organization or individual in representing the data and information in graphical
manner (McPherson and Pincus, 2017). Present report is going to evaluate business and
economic data which is obtained from published sources. For this purpose, various types of
statistical methods are used such as quartiles, correlation coefficient, central tendencies etc.
These methods are also applied in further business planning.
ACTIVITY 1
P1Process and nature of business and economic data with different published sources
Consumer Price Indices: CPI can defined as a comprehensive measure which is used
for estimating price changes in goods and services as per consumption expenditures. In other
words it helps in examining the weighted average of prices of consumer goods like
transportation, medical care and food products (Lu and et. al., 2013). It is calculated by
measuring changing price of each item against consumption then further averaging them.
Inflation period of economy is usually measured by using this concept which calculate rate at
which price of items or services purchased by households either rise or fall. Therefore, it is
widely used as economical indicator through which effectiveness of economical policy of
government can be determined. CPI provided detail information to regulatory bodies,
organisations as well as individuals about changing price of economy. While CPIH refers to
⊘ This is a preview!⊘
Do you want full access?
Subscribe today to unlock all pages.
Trusted by 1+ million students worldwide
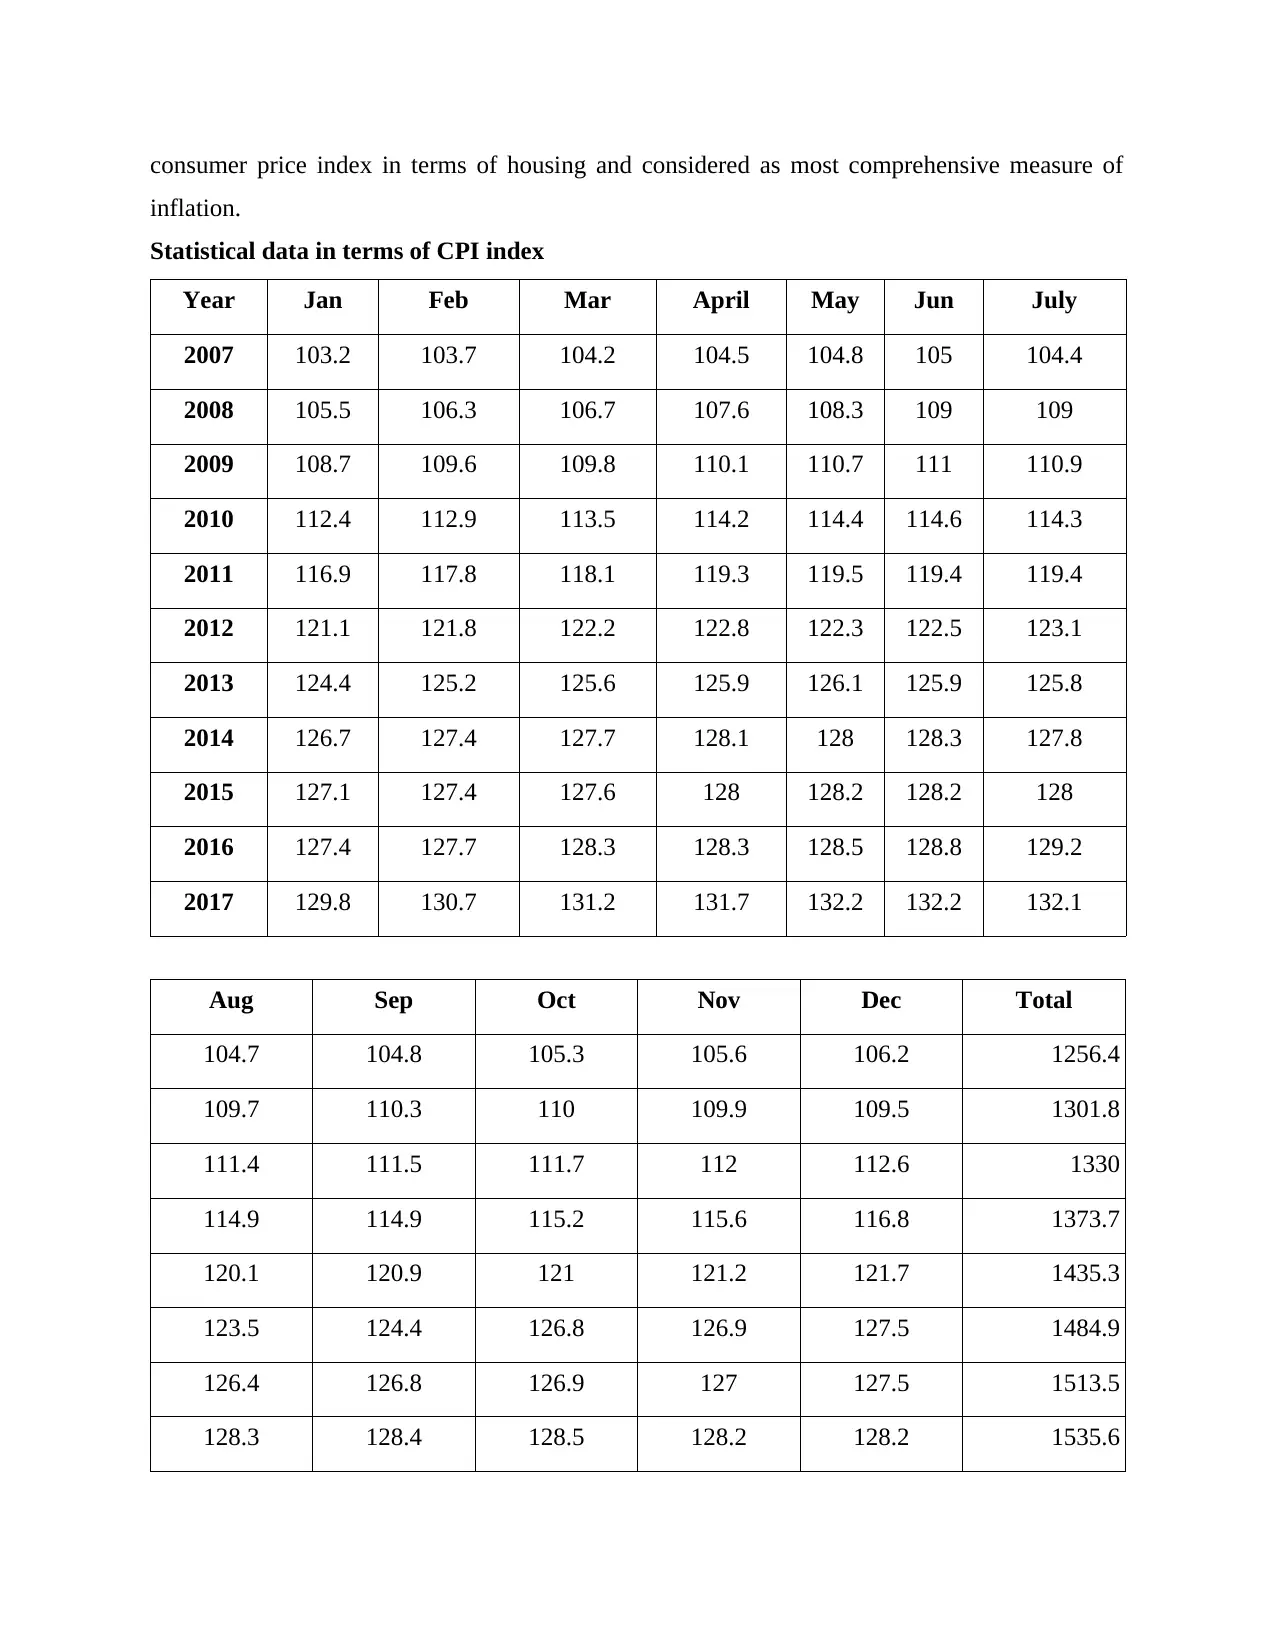
consumer price index in terms of housing and considered as most comprehensive measure of
inflation.
Statistical data in terms of CPI index
Year Jan Feb Mar April May Jun July
2007 103.2 103.7 104.2 104.5 104.8 105 104.4
2008 105.5 106.3 106.7 107.6 108.3 109 109
2009 108.7 109.6 109.8 110.1 110.7 111 110.9
2010 112.4 112.9 113.5 114.2 114.4 114.6 114.3
2011 116.9 117.8 118.1 119.3 119.5 119.4 119.4
2012 121.1 121.8 122.2 122.8 122.3 122.5 123.1
2013 124.4 125.2 125.6 125.9 126.1 125.9 125.8
2014 126.7 127.4 127.7 128.1 128 128.3 127.8
2015 127.1 127.4 127.6 128 128.2 128.2 128
2016 127.4 127.7 128.3 128.3 128.5 128.8 129.2
2017 129.8 130.7 131.2 131.7 132.2 132.2 132.1
Aug Sep Oct Nov Dec Total
104.7 104.8 105.3 105.6 106.2 1256.4
109.7 110.3 110 109.9 109.5 1301.8
111.4 111.5 111.7 112 112.6 1330
114.9 114.9 115.2 115.6 116.8 1373.7
120.1 120.9 121 121.2 121.7 1435.3
123.5 124.4 126.8 126.9 127.5 1484.9
126.4 126.8 126.9 127 127.5 1513.5
128.3 128.4 128.5 128.2 128.2 1535.6
Paraphrase This Document
Need a fresh take? Get an instant paraphrase of this document with our AI Paraphraser
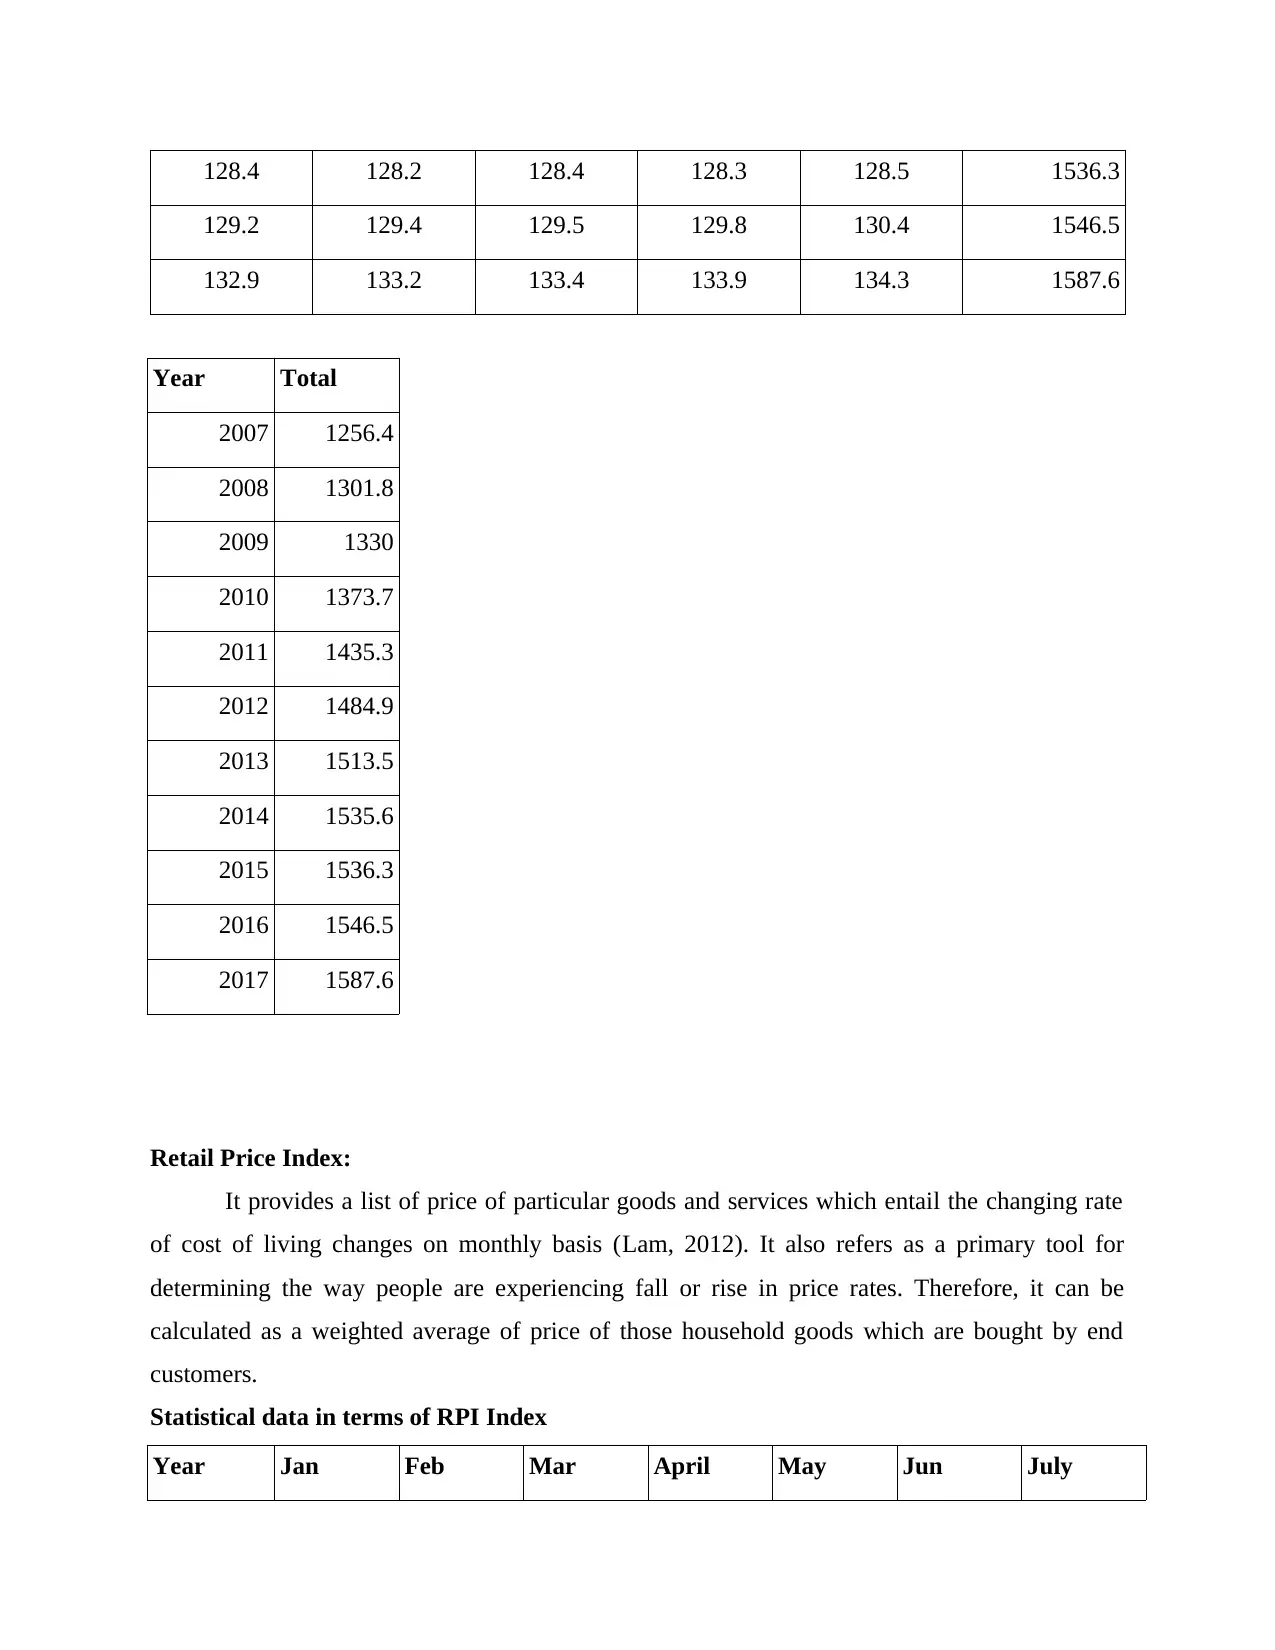
128.4 128.2 128.4 128.3 128.5 1536.3
129.2 129.4 129.5 129.8 130.4 1546.5
132.9 133.2 133.4 133.9 134.3 1587.6
Year Total
2007 1256.4
2008 1301.8
2009 1330
2010 1373.7
2011 1435.3
2012 1484.9
2013 1513.5
2014 1535.6
2015 1536.3
2016 1546.5
2017 1587.6
Retail Price Index:
It provides a list of price of particular goods and services which entail the changing rate
of cost of living changes on monthly basis (Lam, 2012). It also refers as a primary tool for
determining the way people are experiencing fall or rise in price rates. Therefore, it can be
calculated as a weighted average of price of those household goods which are bought by end
customers.
Statistical data in terms of RPI Index
Year Jan Feb Mar April May Jun July
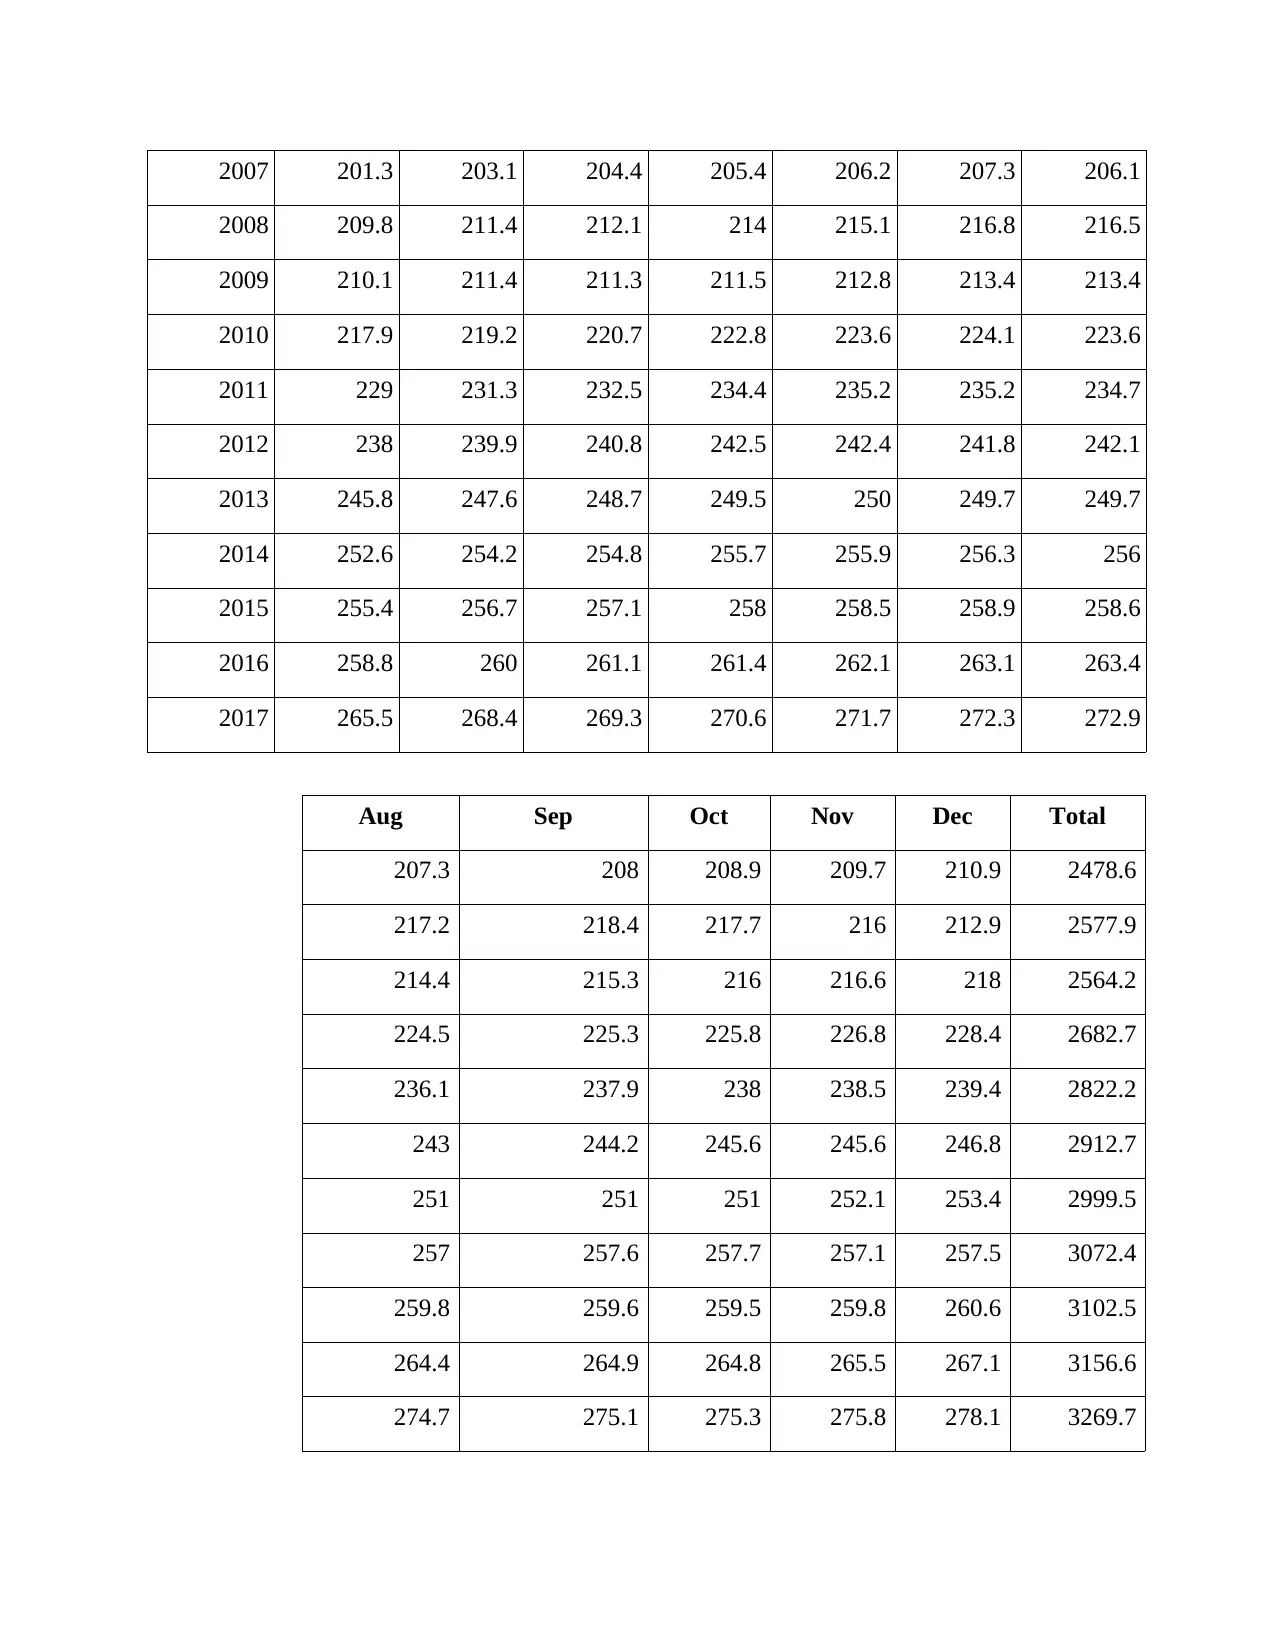
2007 201.3 203.1 204.4 205.4 206.2 207.3 206.1
2008 209.8 211.4 212.1 214 215.1 216.8 216.5
2009 210.1 211.4 211.3 211.5 212.8 213.4 213.4
2010 217.9 219.2 220.7 222.8 223.6 224.1 223.6
2011 229 231.3 232.5 234.4 235.2 235.2 234.7
2012 238 239.9 240.8 242.5 242.4 241.8 242.1
2013 245.8 247.6 248.7 249.5 250 249.7 249.7
2014 252.6 254.2 254.8 255.7 255.9 256.3 256
2015 255.4 256.7 257.1 258 258.5 258.9 258.6
2016 258.8 260 261.1 261.4 262.1 263.1 263.4
2017 265.5 268.4 269.3 270.6 271.7 272.3 272.9
Aug Sep Oct Nov Dec Total
207.3 208 208.9 209.7 210.9 2478.6
217.2 218.4 217.7 216 212.9 2577.9
214.4 215.3 216 216.6 218 2564.2
224.5 225.3 225.8 226.8 228.4 2682.7
236.1 237.9 238 238.5 239.4 2822.2
243 244.2 245.6 245.6 246.8 2912.7
251 251 251 252.1 253.4 2999.5
257 257.6 257.7 257.1 257.5 3072.4
259.8 259.6 259.5 259.8 260.6 3102.5
264.4 264.9 264.8 265.5 267.1 3156.6
274.7 275.1 275.3 275.8 278.1 3269.7
⊘ This is a preview!⊘
Do you want full access?
Subscribe today to unlock all pages.
Trusted by 1+ million students worldwide
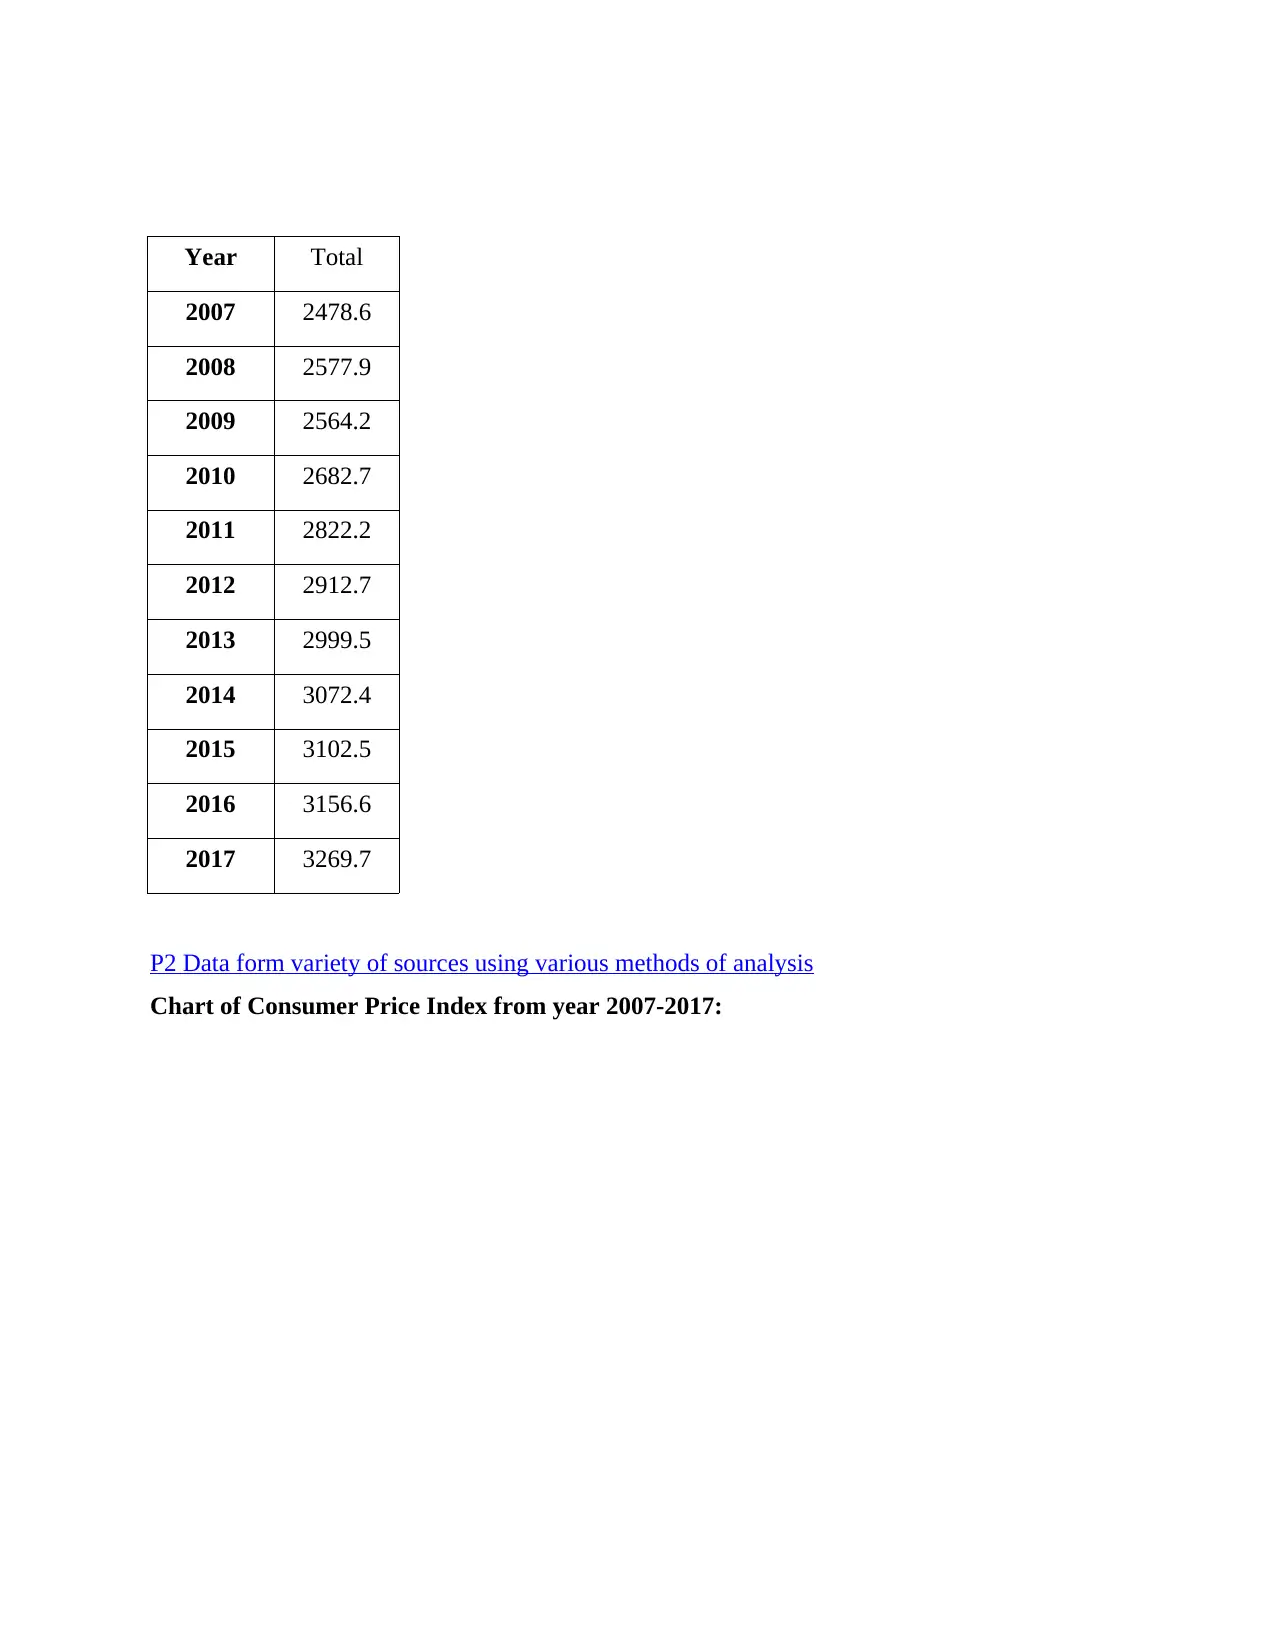
Year Total
2007 2478.6
2008 2577.9
2009 2564.2
2010 2682.7
2011 2822.2
2012 2912.7
2013 2999.5
2014 3072.4
2015 3102.5
2016 3156.6
2017 3269.7
P2 Data form variety of sources using various methods of analysis
Chart of Consumer Price Index from year 2007-2017:
2007 2478.6
2008 2577.9
2009 2564.2
2010 2682.7
2011 2822.2
2012 2912.7
2013 2999.5
2014 3072.4
2015 3102.5
2016 3156.6
2017 3269.7
P2 Data form variety of sources using various methods of analysis
Chart of Consumer Price Index from year 2007-2017:
Paraphrase This Document
Need a fresh take? Get an instant paraphrase of this document with our AI Paraphraser
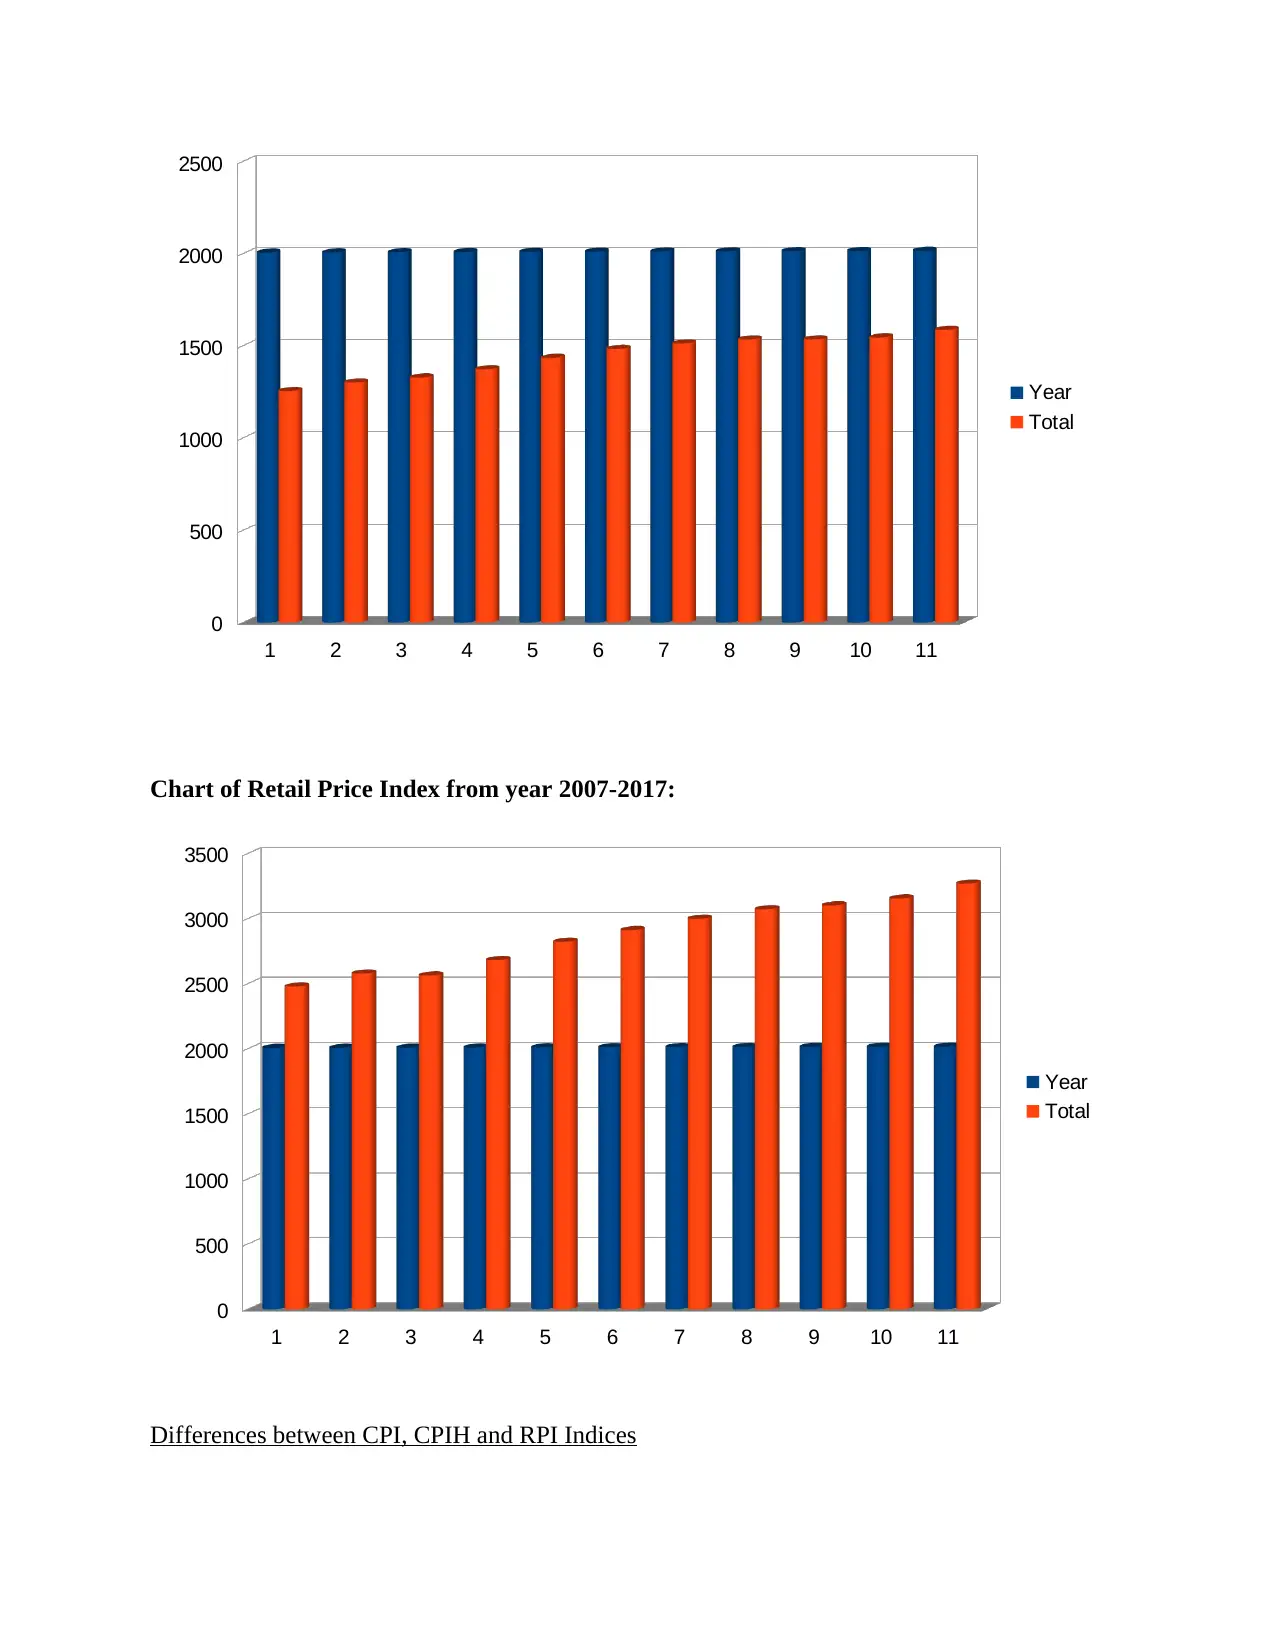
Chart of Retail Price Index from year 2007-2017:
Differences between CPI, CPIH and RPI Indices
1 2 3 4 5 6 7 8 9 10 11
0
500
1000
1500
2000
2500
3000
3500
Year
Total
1 2 3 4 5 6 7 8 9 10 11
0
500
1000
1500
2000
2500
Year
Total
Differences between CPI, CPIH and RPI Indices
1 2 3 4 5 6 7 8 9 10 11
0
500
1000
1500
2000
2500
3000
3500
Year
Total
1 2 3 4 5 6 7 8 9 10 11
0
500
1000
1500
2000
2500
Year
Total
CPI CPIH RPI
It can be defined as a weighted
average value of purchased goods
and services.
It refers to new measure of
price inflation from ONS
(Keller, 2015).
It is used for revalorisation
of taxation or excise duty
and uprating the index-
linked gilts as well.
It measures the consumer price
inflation which is produced to
international standards.
It is based on CPI which
measures housing costs of
goods and services
purchased by final
consumers.
It shows changes in cost of
living.
This method is mostly used by
regulatory bodies to determine
changes in price of particular
products (Melnykov, 2013).
This type of technique is
used ONS (Office for
National Statistics) for
publishing a high range of
indices which is also called
the consumer price index
including housing costs.
It is generally used by
business, government and
economists for measuring
the inflation rate.
Usage of Consumer price Index data for calculating annual inflation
Annual inflation rate can be defined as changes in price of particular products where
regulatory bodies use consumer price index method to calculate the same. This would help
organisations to decide expansion (Jessop, 2016). As per above national statistical data,
consumer value list in the year 2017 has been measured as 1587.6 which is much increased as
per previous year 2016 which is approximate 2% as ascended rate of expansion.
Importance of determining rate of inflation
Inflation can be defined as increase in price level of certain goods and services over a
particular period of time in economy. Whenever price of products are hiked then it directly
impacts on purchasing power of people. This would also impact on demand of items also
therefore, it affects economical condition of country both in negative and positive manner ( Paté‐
⊘ This is a preview!⊘
Do you want full access?
Subscribe today to unlock all pages.
Trusted by 1+ million students worldwide
Cornell, 2012). Government and public organisations measure inflation rate in order to determine
expansion rate of economy with cost of living index.
M1 Evaluation of sources other than the NSO with regard to the gender pay gap
It has analysed from National Statistics data that organisations of UK provide
employment to male candidates mostly as compared to female. It leads to causes high gender gap
as subjected to Consumer Index Price in this nation. For example- As per survey, it has evaluated
that under textiles group, the gender pay gap is recorded as 88% that shows it pay less
consideration to female working staff then males (Gender pay gap in UK, 2018).
Activity 2
P3 Evaluation of qualitative and quantitative data from a range of examples and appropriate
statistical methods
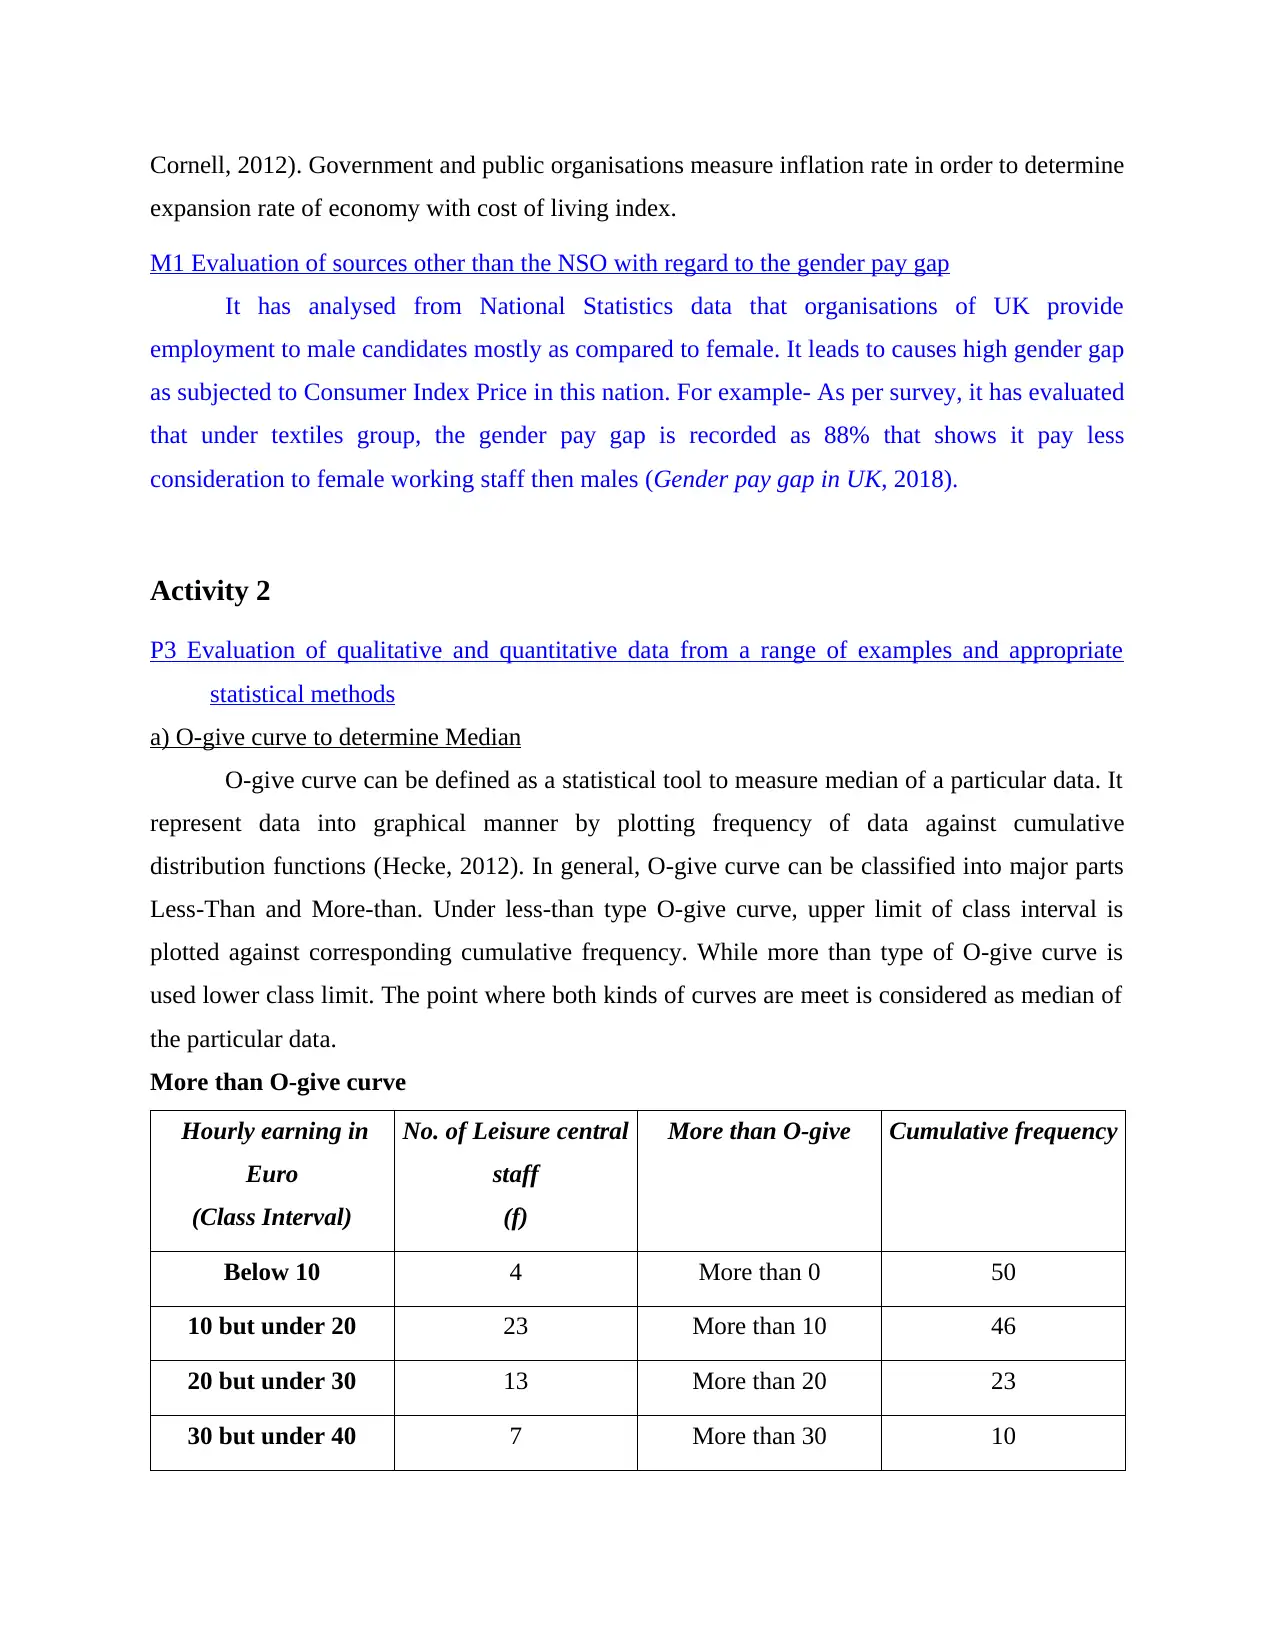
a) O-give curve to determine Median
O-give curve can be defined as a statistical tool to measure median of a particular data. It
represent data into graphical manner by plotting frequency of data against cumulative
distribution functions (Hecke, 2012). In general, O-give curve can be classified into major parts
Less-Than and More-than. Under less-than type O-give curve, upper limit of class interval is
plotted against corresponding cumulative frequency. While more than type of O-give curve is
used lower class limit. The point where both kinds of curves are meet is considered as median of
the particular data.
More than O-give curve
Hourly earning in
Euro
(Class Interval)
No. of Leisure central
staff
(f)
More than O-give Cumulative frequency
Below 10 4 More than 0 50
10 but under 20 23 More than 10 46
20 but under 30 13 More than 20 23
30 but under 40 7 More than 30 10
expansion rate of economy with cost of living index.
M1 Evaluation of sources other than the NSO with regard to the gender pay gap
It has analysed from National Statistics data that organisations of UK provide
employment to male candidates mostly as compared to female. It leads to causes high gender gap
as subjected to Consumer Index Price in this nation. For example- As per survey, it has evaluated
that under textiles group, the gender pay gap is recorded as 88% that shows it pay less
consideration to female working staff then males (Gender pay gap in UK, 2018).
Activity 2
P3 Evaluation of qualitative and quantitative data from a range of examples and appropriate
statistical methods
a) O-give curve to determine Median
O-give curve can be defined as a statistical tool to measure median of a particular data. It
represent data into graphical manner by plotting frequency of data against cumulative
distribution functions (Hecke, 2012). In general, O-give curve can be classified into major parts
Less-Than and More-than. Under less-than type O-give curve, upper limit of class interval is
plotted against corresponding cumulative frequency. While more than type of O-give curve is
used lower class limit. The point where both kinds of curves are meet is considered as median of
the particular data.
More than O-give curve
Hourly earning in
Euro
(Class Interval)
No. of Leisure central
staff
(f)
More than O-give Cumulative frequency
Below 10 4 More than 0 50
10 but under 20 23 More than 10 46
20 but under 30 13 More than 20 23
30 but under 40 7 More than 30 10
Paraphrase This Document
Need a fresh take? Get an instant paraphrase of this document with our AI Paraphraser
40 but under 50 3 More than 40 3
Total 50
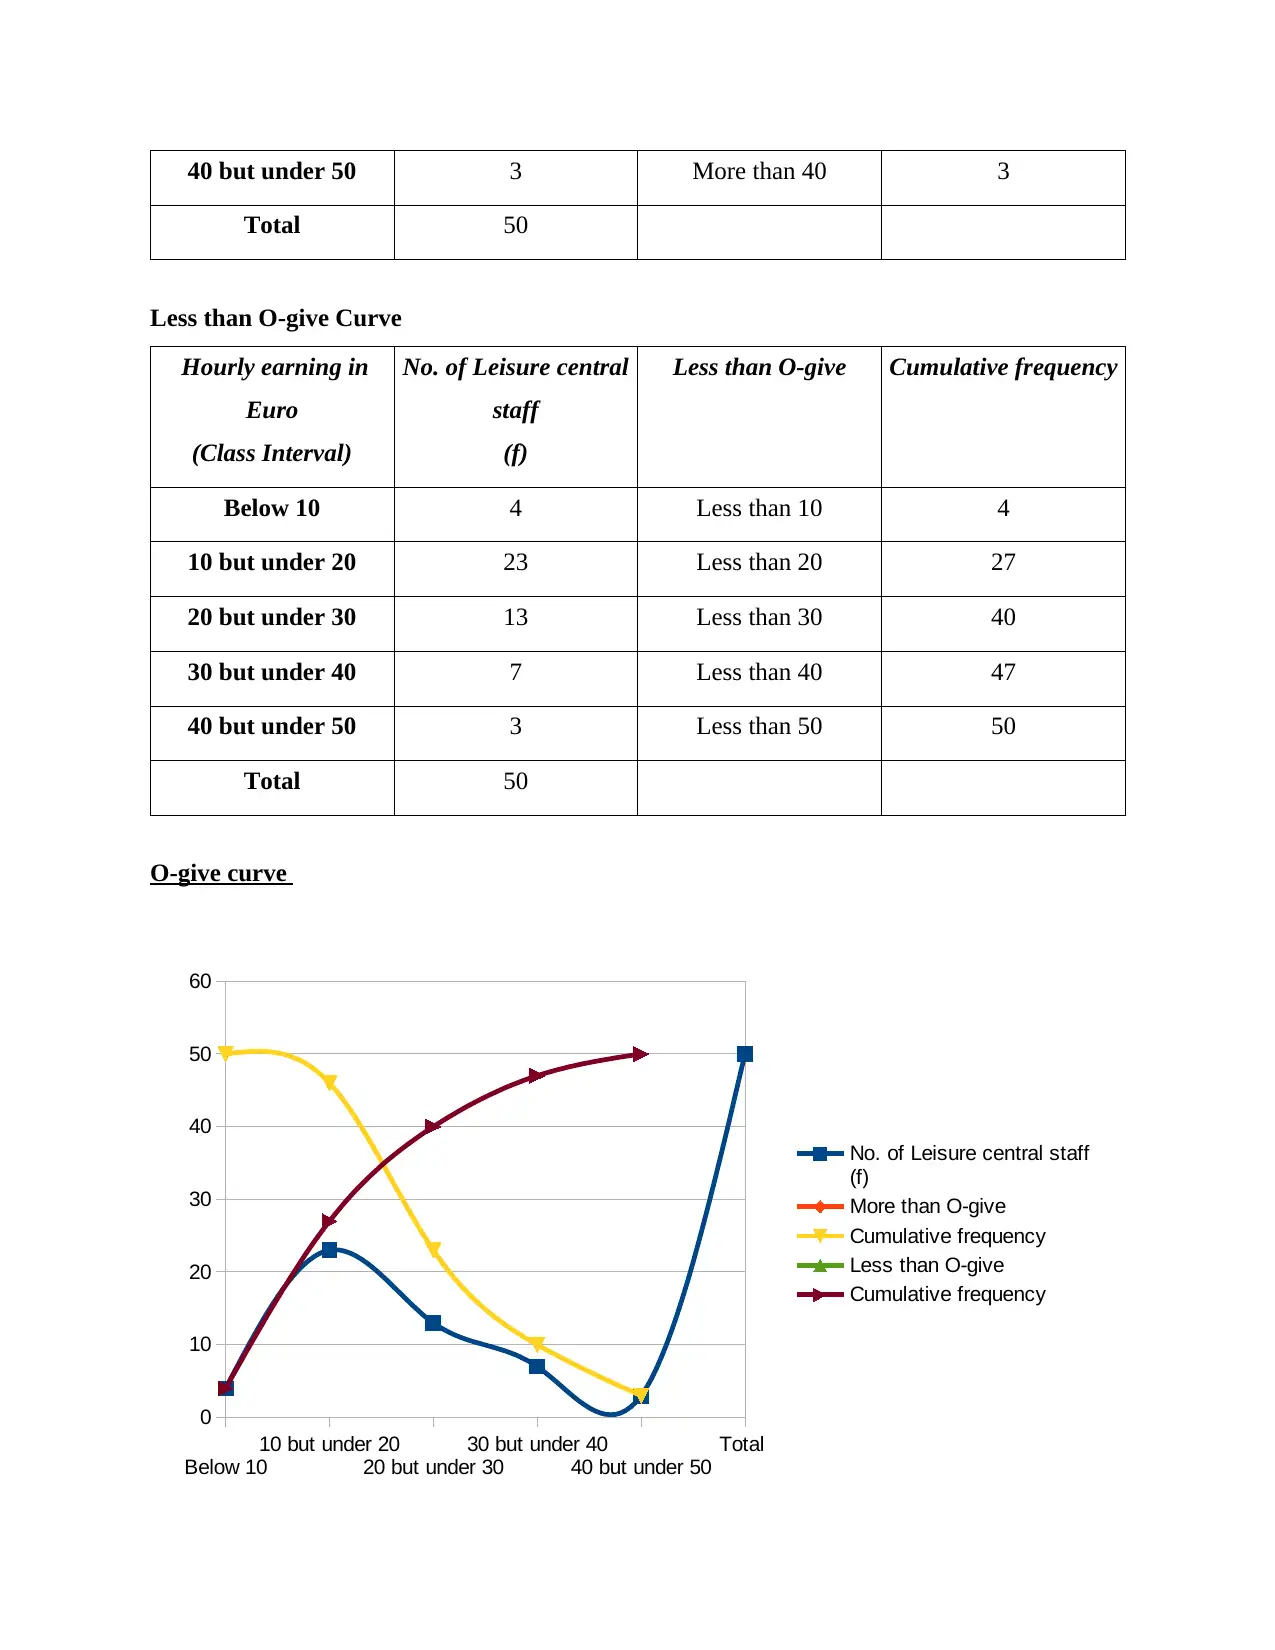
Less than O-give Curve
Hourly earning in
Euro
(Class Interval)
No. of Leisure central
staff
(f)
Less than O-give Cumulative frequency
Below 10 4 Less than 10 4
10 but under 20 23 Less than 20 27
20 but under 30 13 Less than 30 40
30 but under 40 7 Less than 40 47
40 but under 50 3 Less than 50 50
Total 50
O-give curve
Below 10
10 but under 20
20 but under 30
30 but under 40
40 but under 50
Total
0
10
20
30
40
50
60
No. of Leisure central staff
(f)
More than O-give
Cumulative frequency
Less than O-give
Cumulative frequency
Total 50
Less than O-give Curve
Hourly earning in
Euro
(Class Interval)
No. of Leisure central
staff
(f)
Less than O-give Cumulative frequency
Below 10 4 Less than 10 4
10 but under 20 23 Less than 20 27
20 but under 30 13 Less than 30 40
30 but under 40 7 Less than 40 47
40 but under 50 3 Less than 50 50
Total 50
O-give curve
Below 10
10 but under 20
20 but under 30
30 but under 40
40 but under 50
Total
0
10
20
30
40
50
60
No. of Leisure central staff
(f)
More than O-give
Cumulative frequency
Less than O-give
Cumulative frequency
From the above graphical representation, Median obtained is approximate £19.0 for
hourly earning for leisure centre staff of London area (Zhou and Luo, 2015). While interquartile
range can be obtained as :
Q1 can be defined as first quartile range which is calculated by taking 25% of data. While Q3 is
sated as third quartile range that used 75% of total population. Along with this, Inter-quartile
range can be defined as a quantum of statistical dispersion it is also known as mid spread and
middle 50%. It is first quartile which is subtracted from third quartile. It is mainly a quota of
variability which is based on dividing of a data set into quartiles. Inter-Quartile is basically a
measure where extended values lies.
Q1 = L + (N/4 – cf)/ f X h Here l = 10, f = 23, h = 10 and N/4 = ∑F/4 = 12.5, cf = 4
= 10 + (12.5 – 4)/ 23 x 10
= 10 + 85/ 23
= 13.7
Q3 = L + (3N/4 – cf)/ f X h Here l = 20, f = 13, h = 10 and 3N/4 = ¾ of ∑F = 37.5, cf =27
= 20 + (37.5 – 27) / 13 x 10
= 20 + 105/13
= 28.07
So, Inter-quartile range can be obtained as = Q3 – Q1
= (28.07-13.7)
= 14.0 (approx)
b) Mean and standard deviation for hourly earnings of London area
Mean: It is average of range of quantities or values calculated by adding all data and
after then divide it by total of all numbers. End result is mean or average which is also called
arithmetic mean as well. This is most common measure of mid-point in a set of values . It is use
to derive central tendency of data in a question (Zyphur and Oswald, 2013). This type of
statistical calculation erase accidental errors. This will help to acquire more accurate conclusion.
Mean also helps in interpretation of statistical data.
Median: It is a value that separates higher half from lower half in a given data sample. It
is commonly use to measure properties of set of a data. It is very easy to understand and simple
⊘ This is a preview!⊘
Do you want full access?
Subscribe today to unlock all pages.
Trusted by 1+ million students worldwide
1 out of 22
Related Documents


Your All-in-One AI-Powered Toolkit for Academic Success.
+13062052269
info@desklib.com
Available 24*7 on WhatsApp / Email
![[object Object]](/_next/static/media/star-bottom.7253800d.svg)
Unlock your academic potential
Copyright © 2020–2026 A2Z Services. All Rights Reserved. Developed and managed by ZUCOL.