Statistical Practice Project 1: Data Analysis and Findings
VerifiedAdded on 2022/12/15
|17
|1618
|326
Homework Assignment
AI Summary
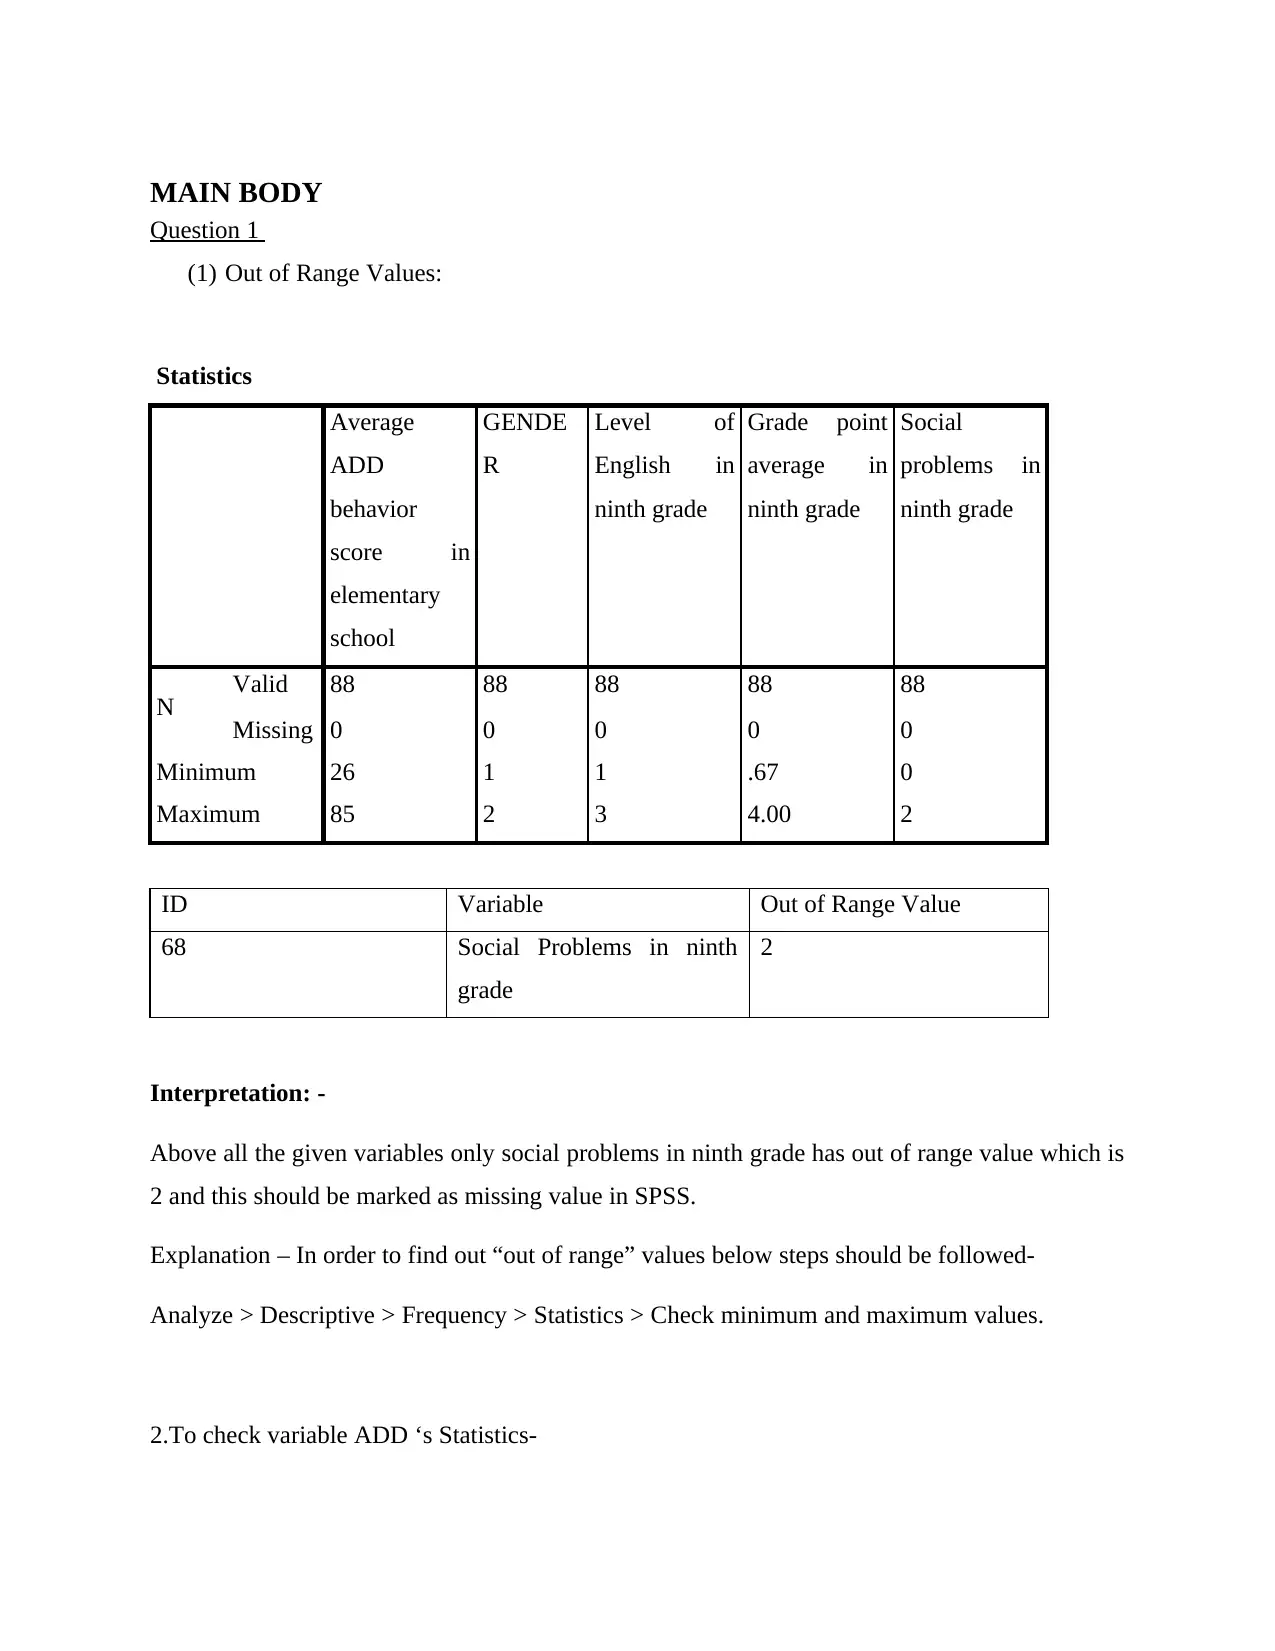
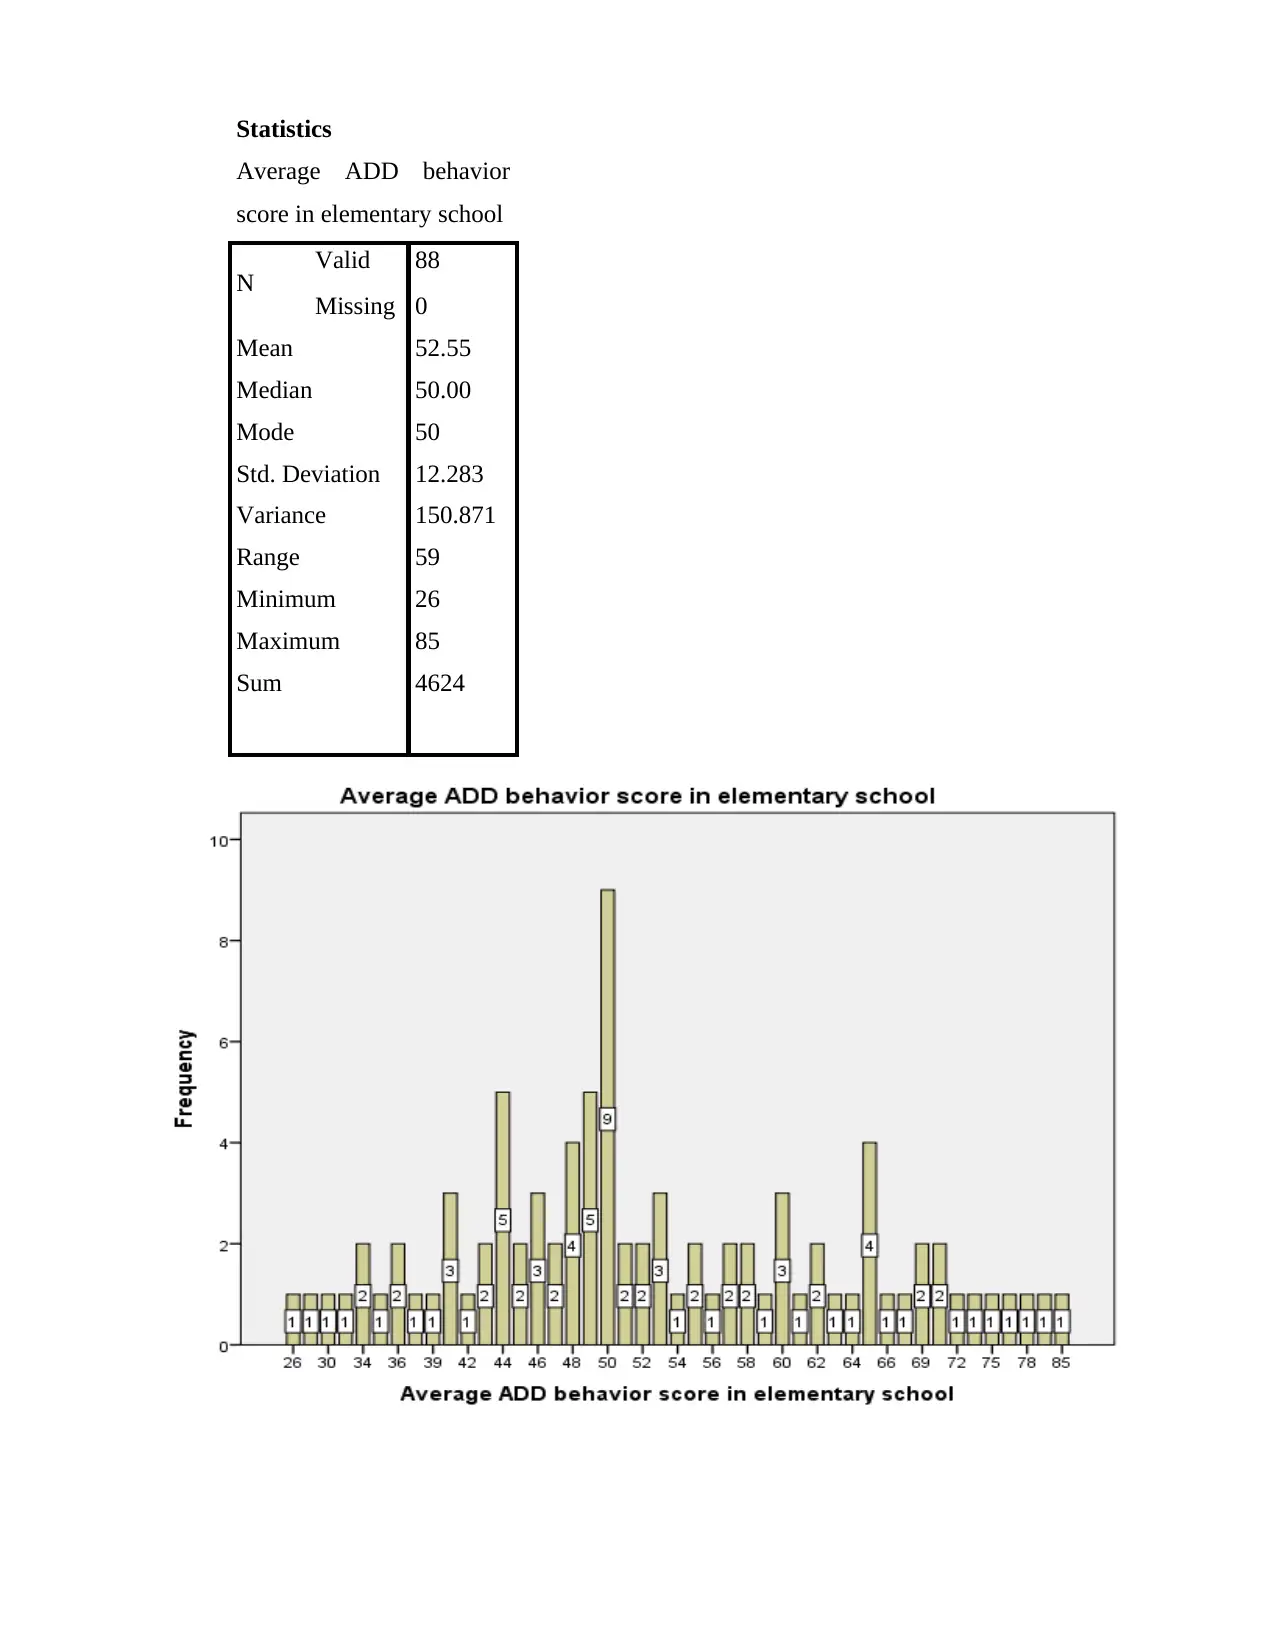
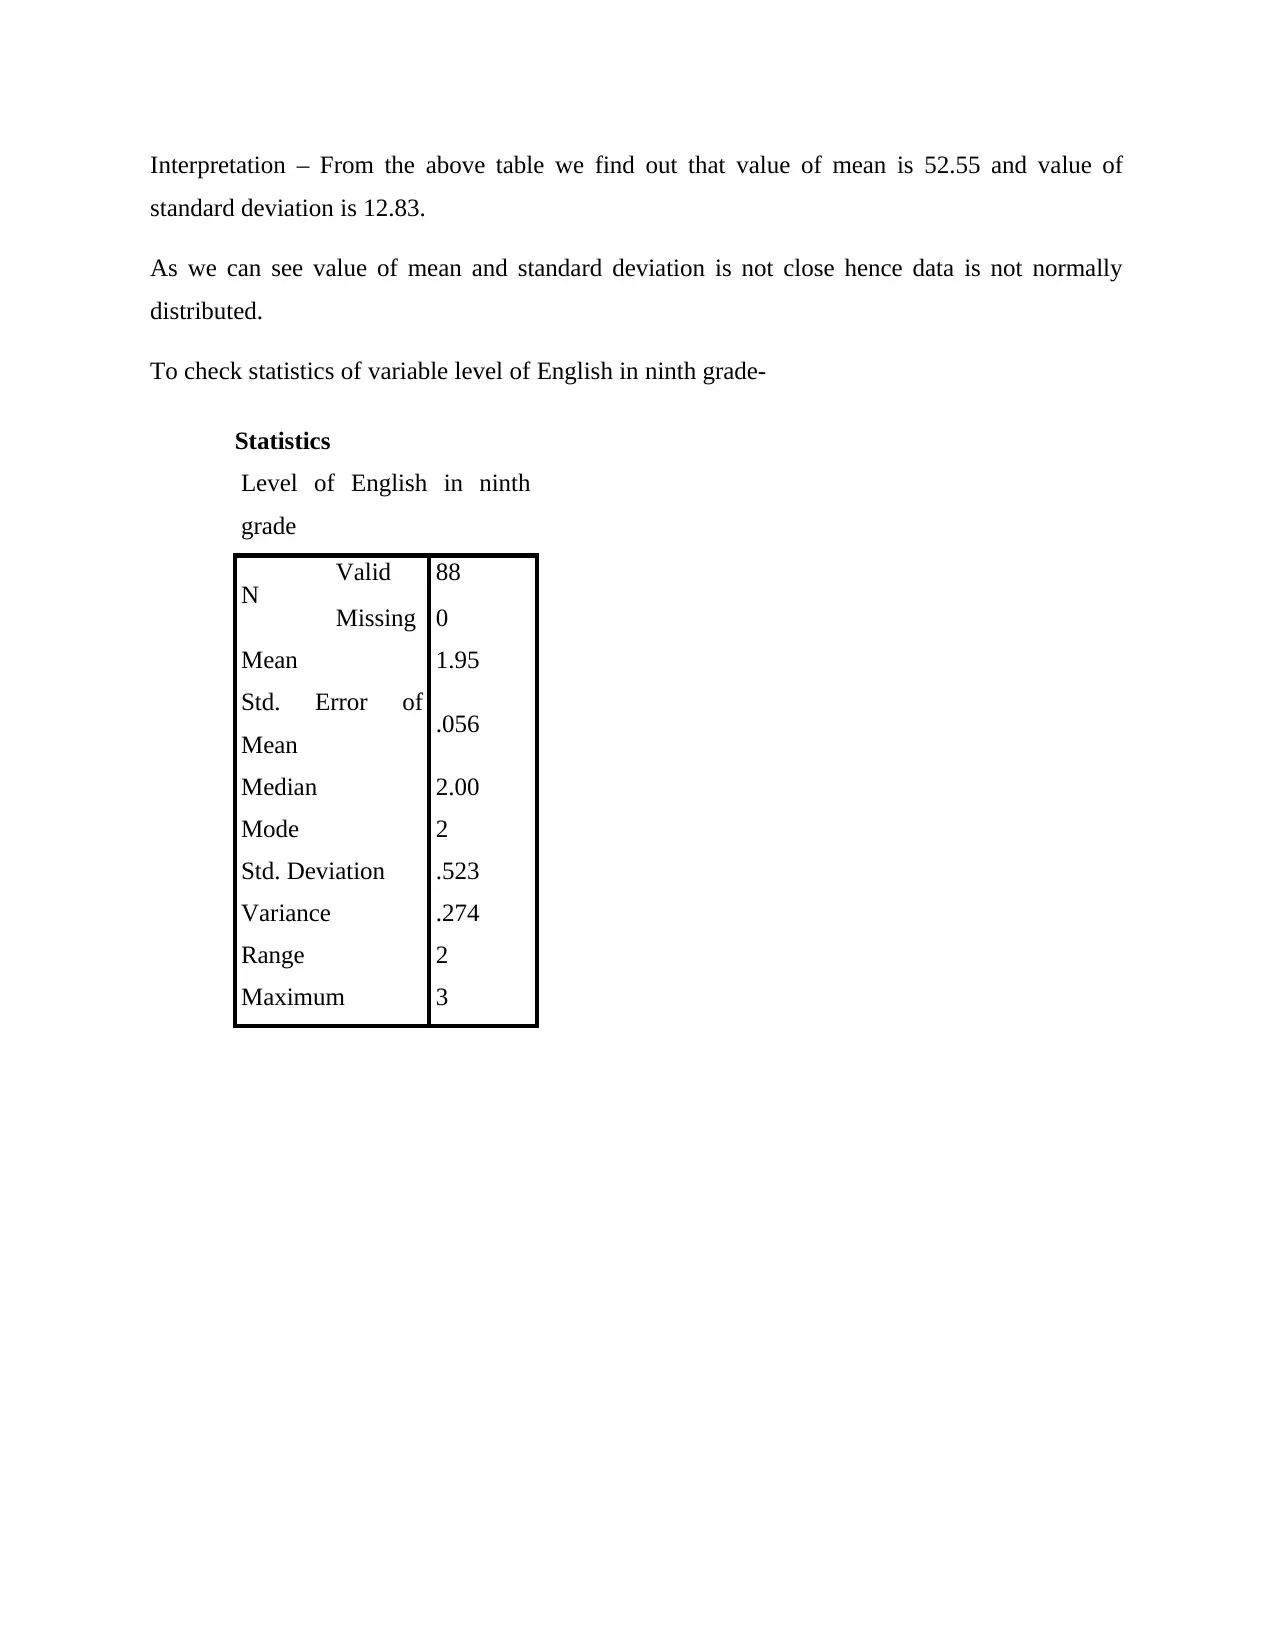
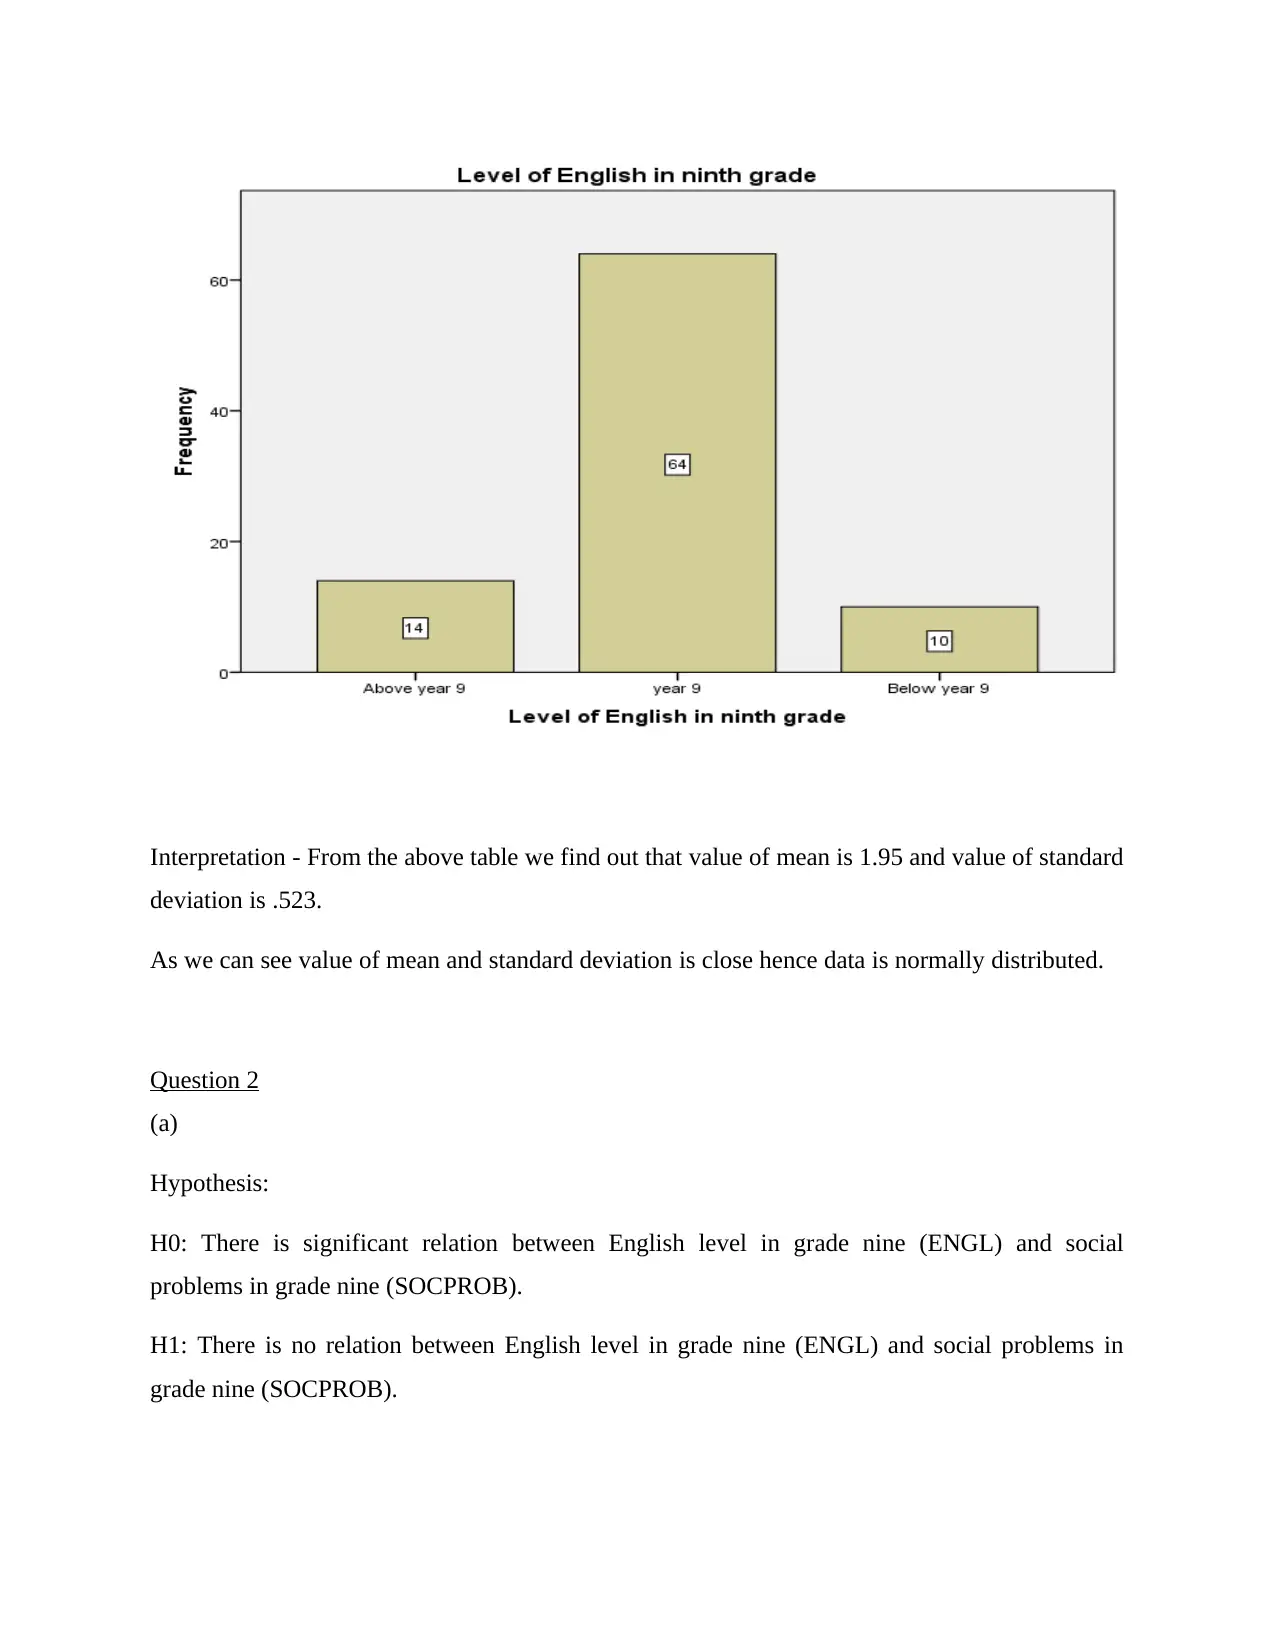
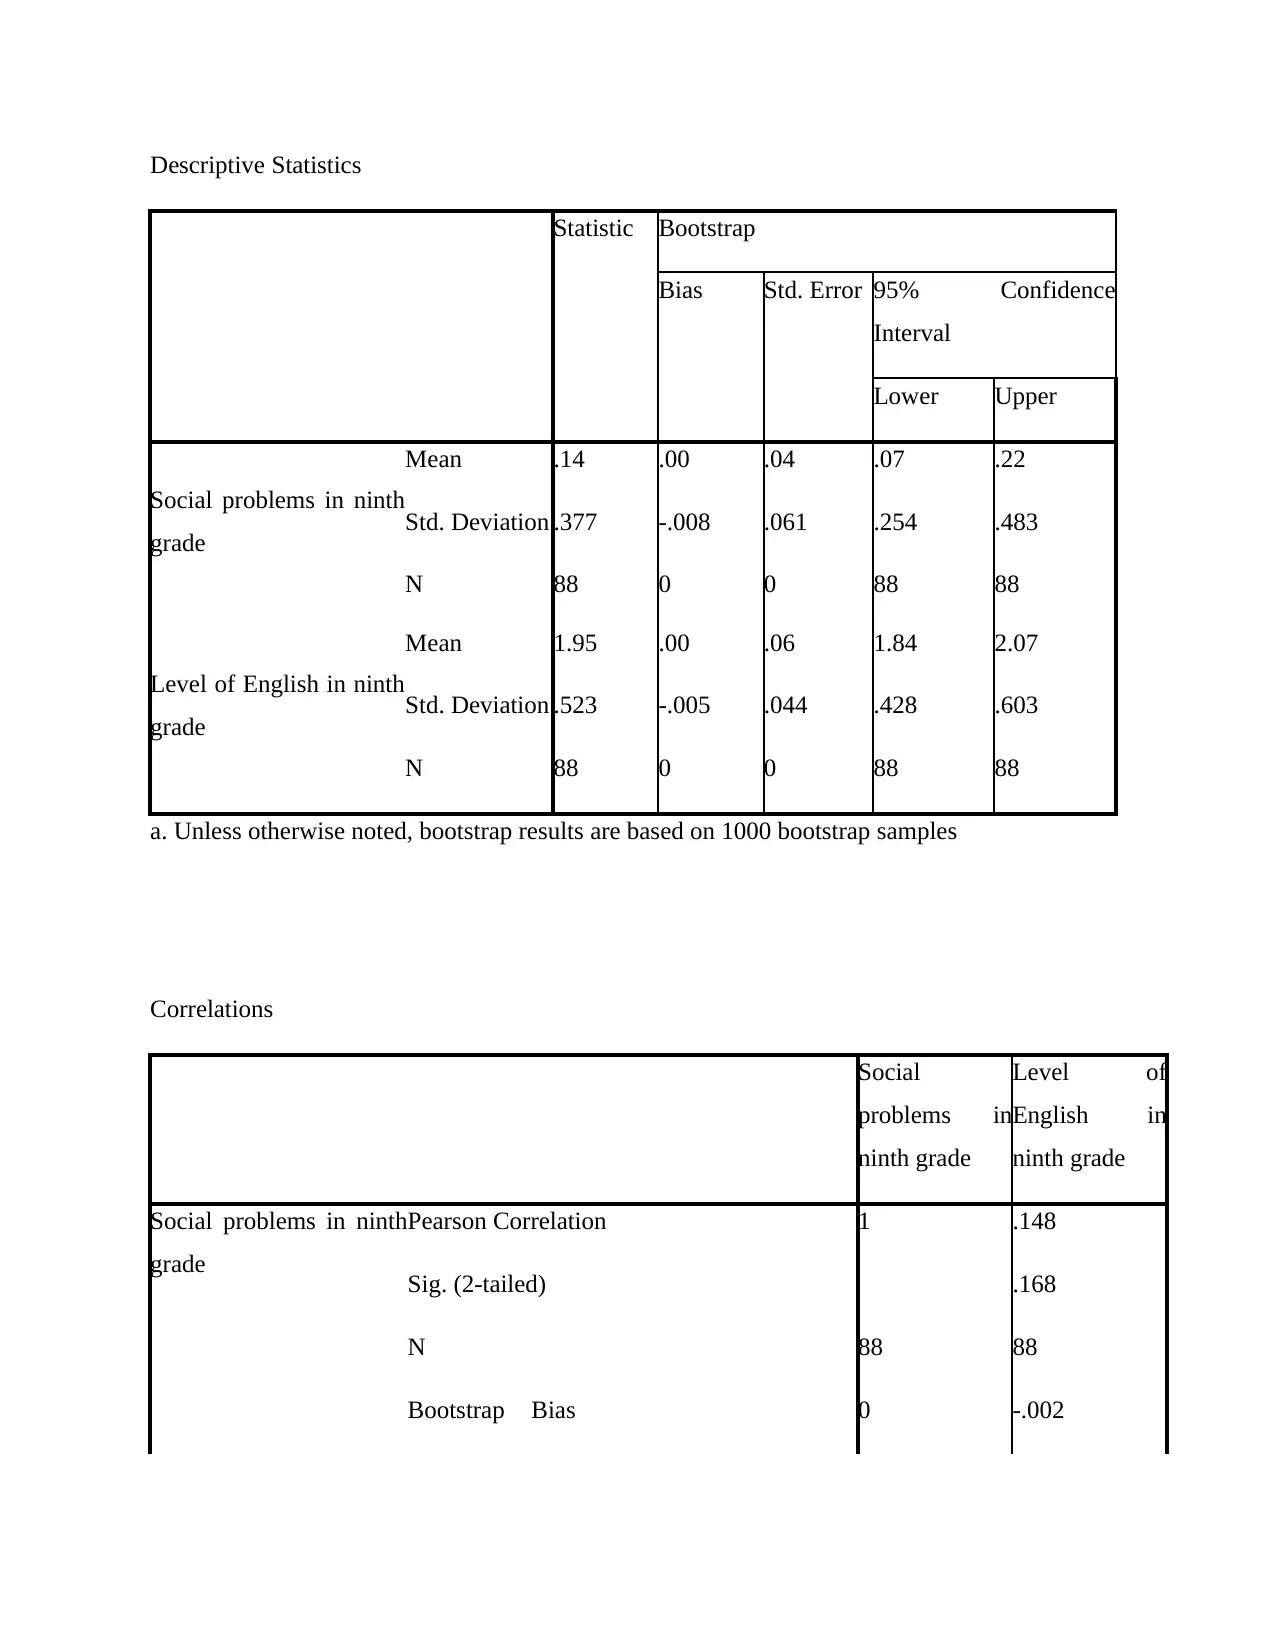
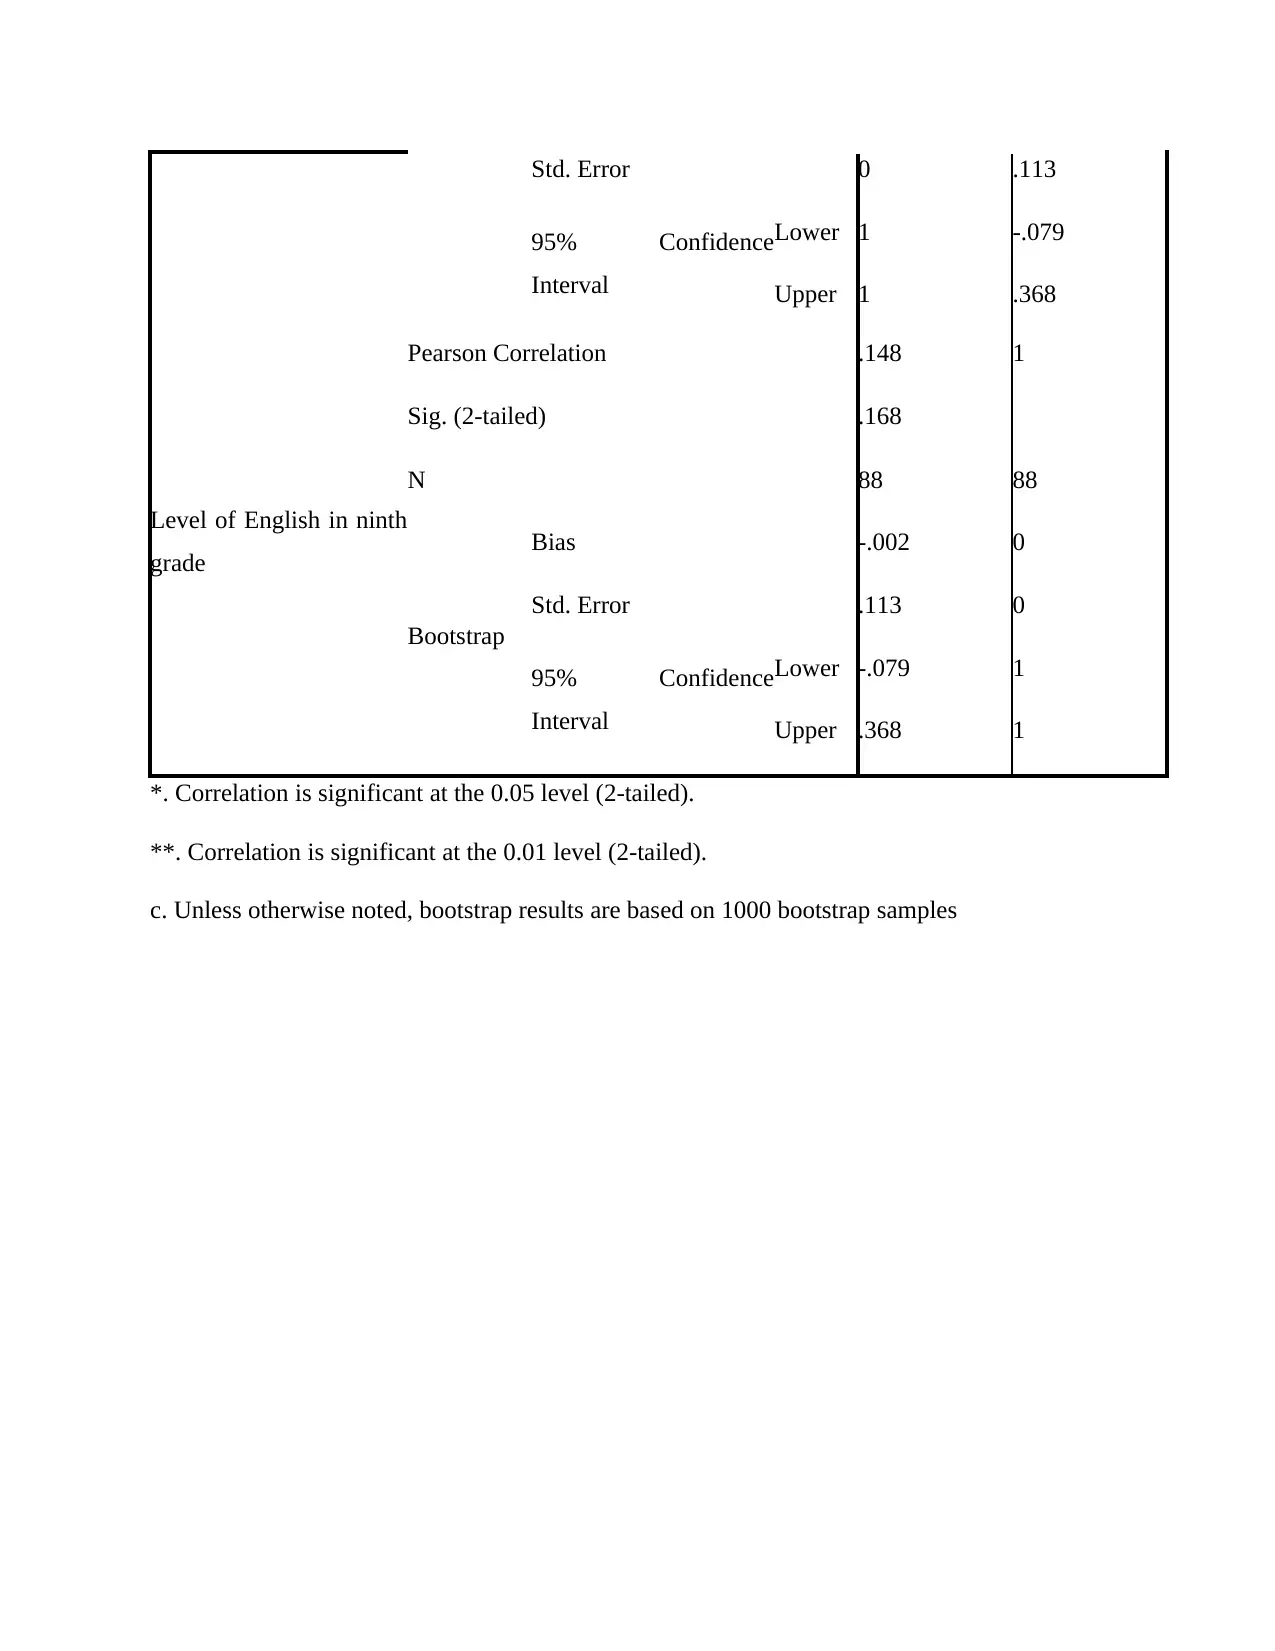
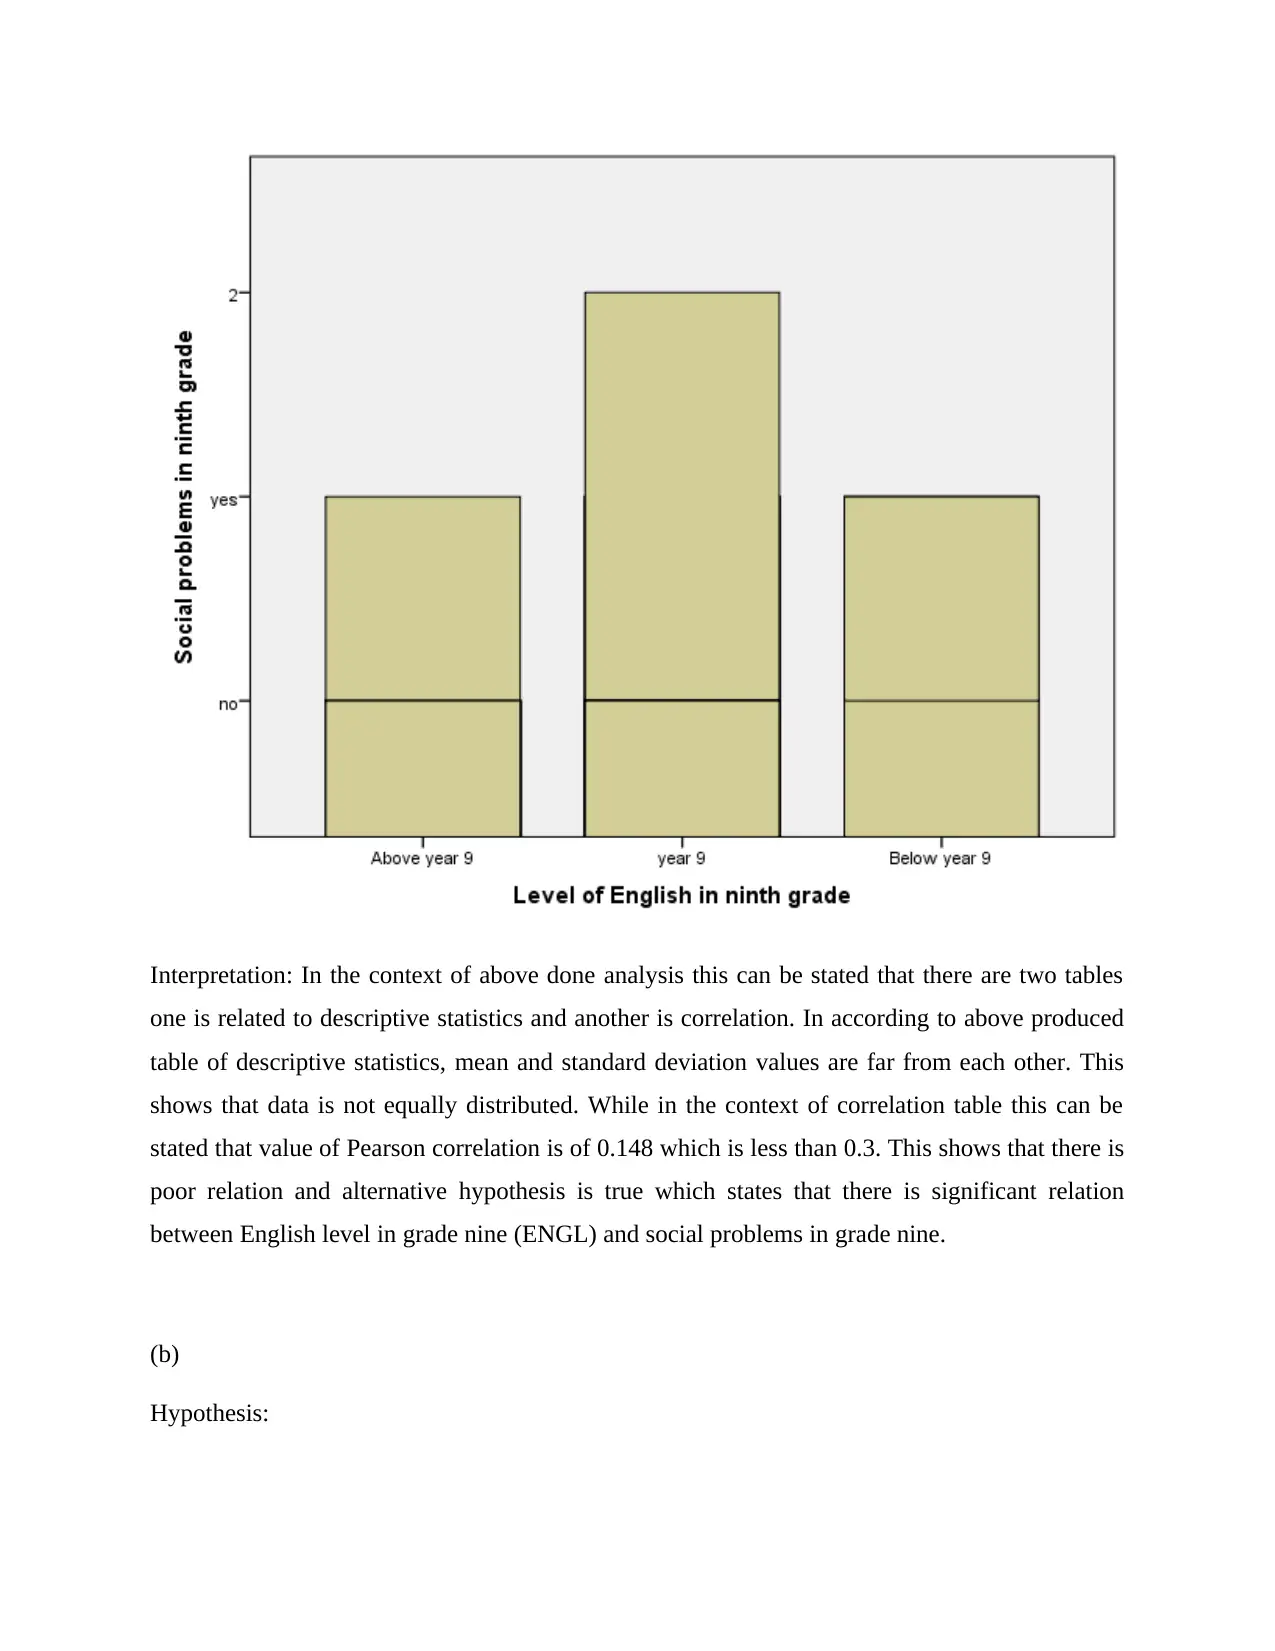
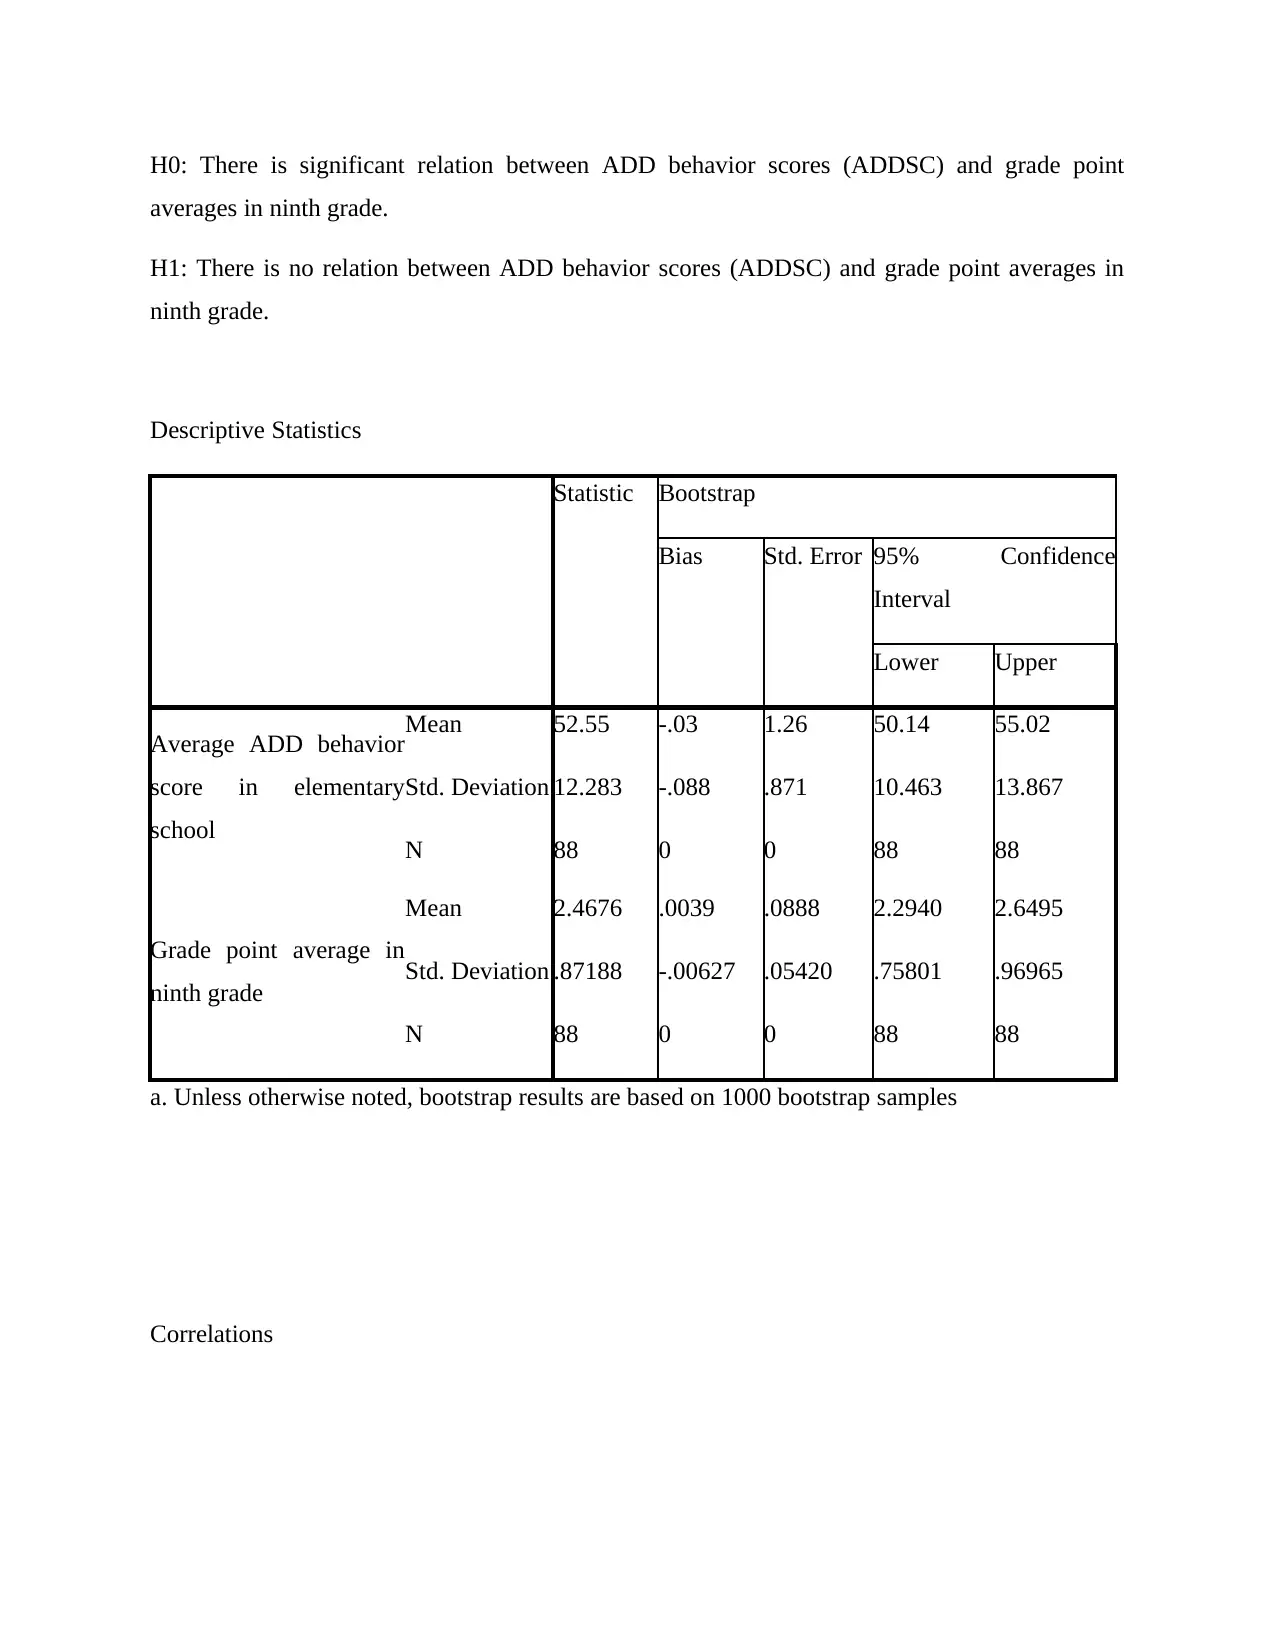
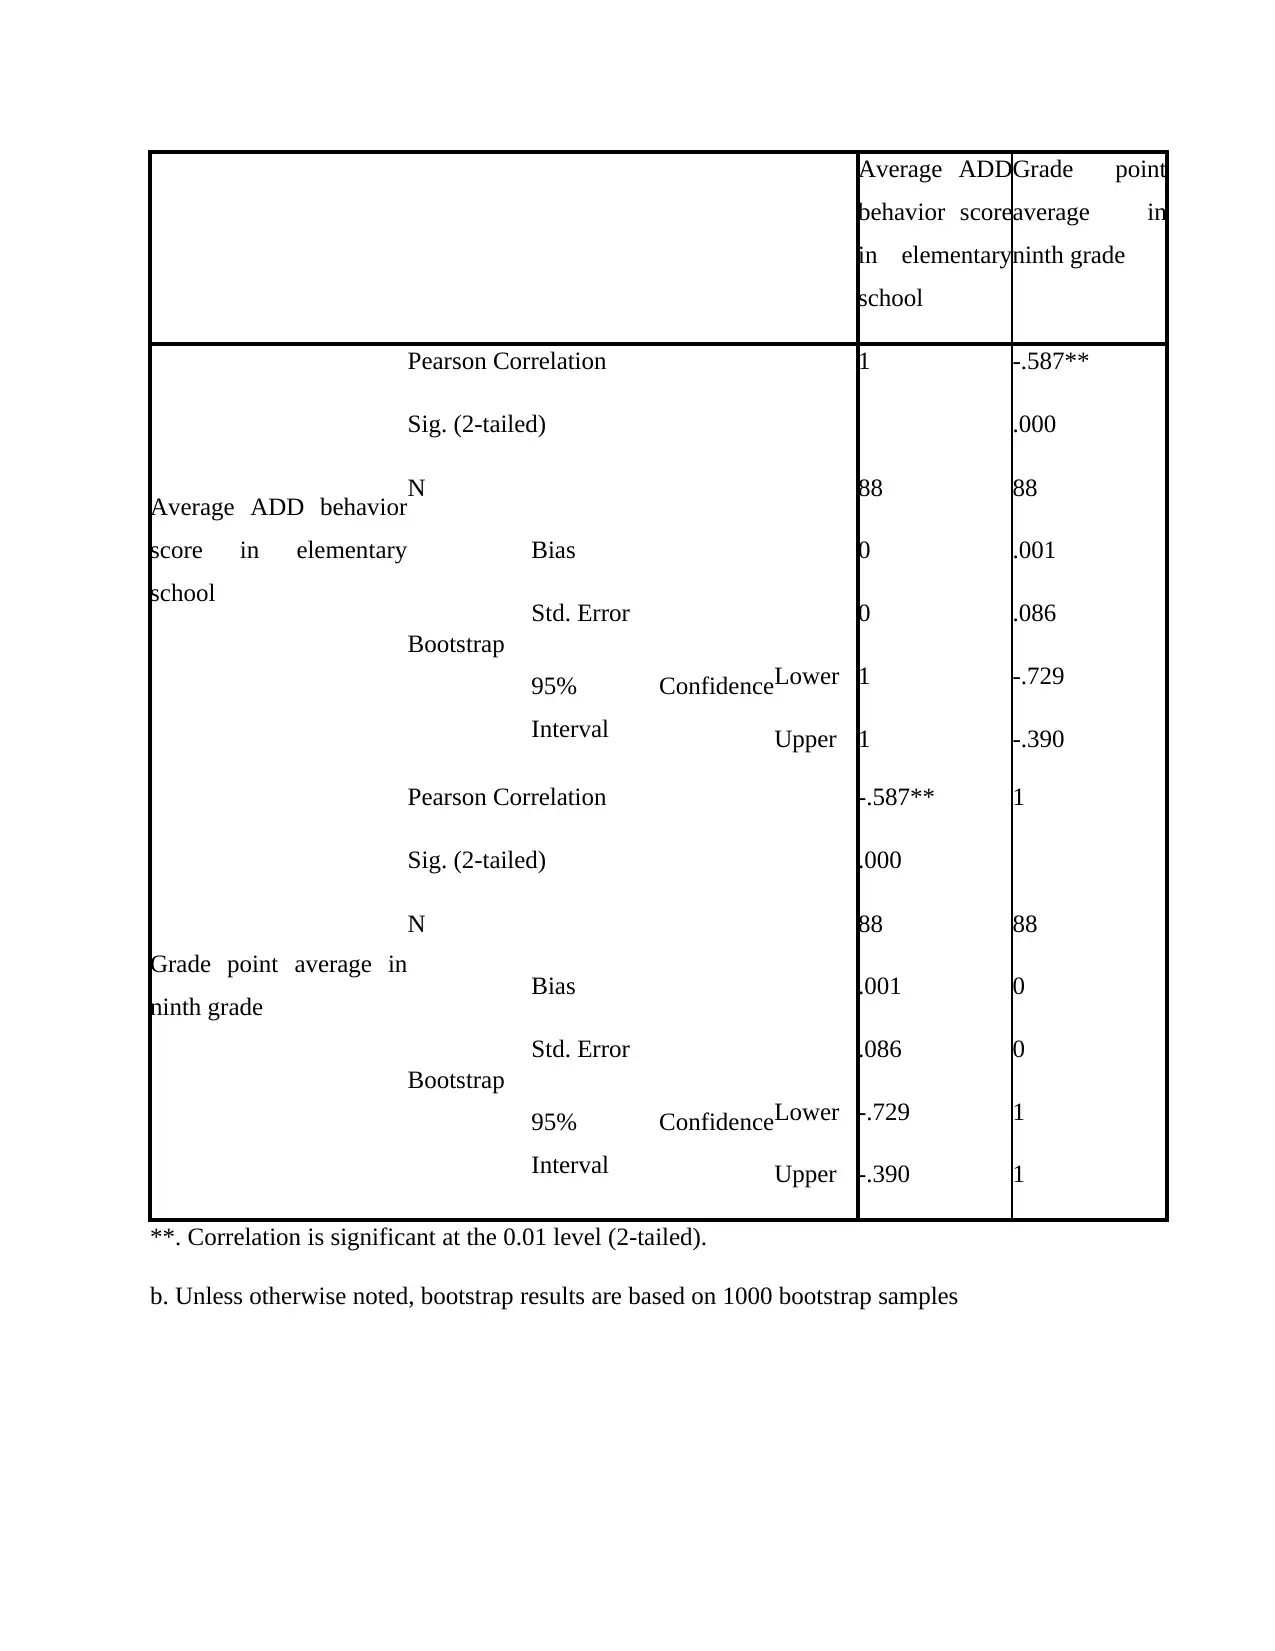
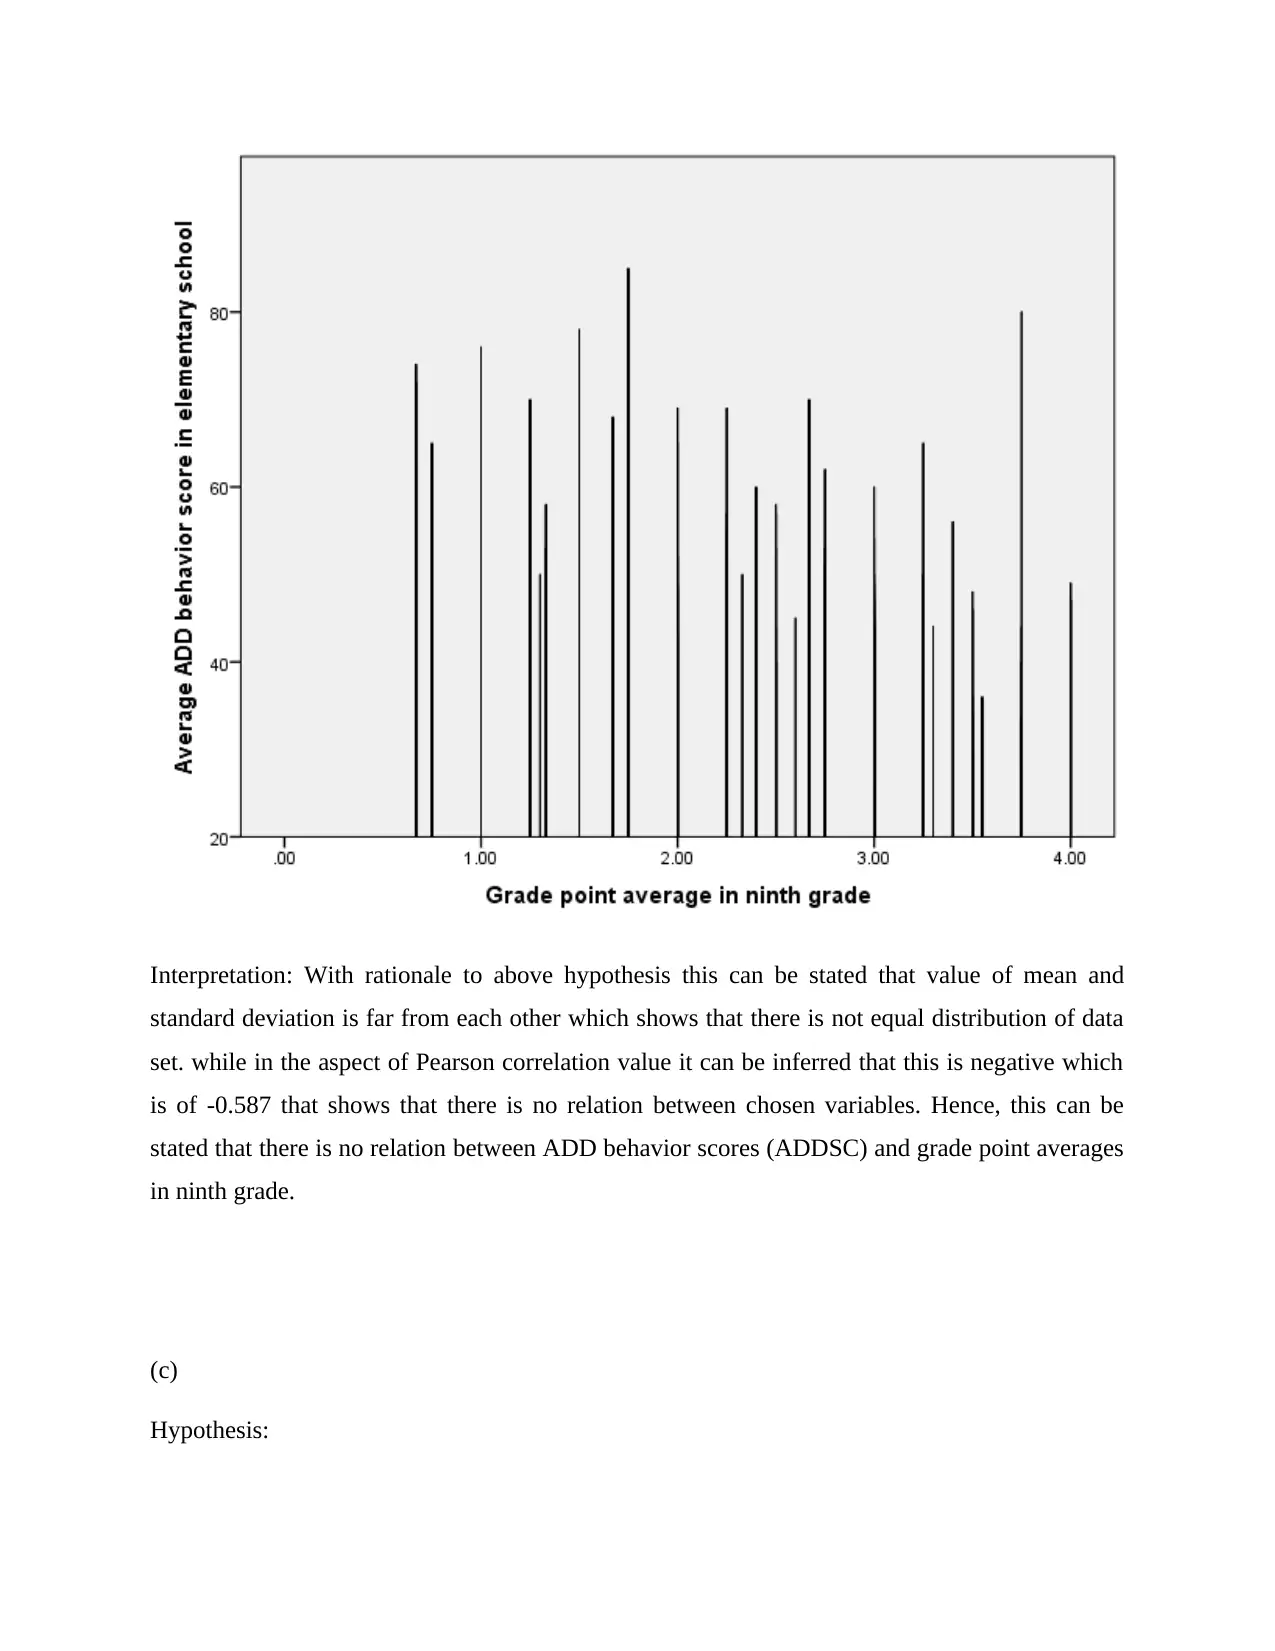
This statistical practice project involves analyzing a dataset using SPSS, addressing questions on out-of-range values, correlation, and hypothesis testing. The assignment begins by identifying and correcting out-of-range values in the provided data. It then explores the relationship between variables such as English level and social problems, as well as ADD behavior scores and grade point averages, using descriptive statistics and correlation analysis. Hypothesis testing is performed to determine the significance of these relationships, including an examination of whether the relationships differ between males and females. Finally, the project includes the analysis of QRS time data, comparing groups with and without IVT using descriptive statistics, graphical representations, and ANOVA to assess the significance of any observed differences. The analysis provides insights into the distribution of data, correlation strengths, and the outcomes of the hypothesis tests.

Statistical practice project 1
Paraphrase This Document
Need a fresh take? Get an instant paraphrase of this document with our AI Paraphraser

Contents
MAIN BODY.............................................................................................................................................3
Question 1...............................................................................................................................................3
Question 2...............................................................................................................................................6
Question 3.............................................................................................................................................15

MAIN BODY
Question 1
(1) Out of Range Values:
Statistics
Average
ADD
behavior
score in
elementary
school
GENDE
R
Level of
English in
ninth grade
Grade point
average in
ninth grade
Social
problems in
ninth grade
N Valid 88 88 88 88 88
Missing 0 0 0 0 0
Minimum 26 1 1 .67 0
Maximum 85 2 3 4.00 2
ID Variable Out of Range Value
68 Social Problems in ninth
grade
2
Interpretation: -
Above all the given variables only social problems in ninth grade has out of range value which is
2 and this should be marked as missing value in SPSS.
Explanation – In order to find out “out of range” values below steps should be followed-
Analyze > Descriptive > Frequency > Statistics > Check minimum and maximum values.
2.To check variable ADD ‘s Statistics-
⊘ This is a preview!⊘
Do you want full access?
Subscribe today to unlock all pages.

Trusted by 1+ million students worldwide

Statistics
Average ADD behavior
score in elementary school
N Valid 88
Missing 0
Mean 52.55
Median 50.00
Mode 50
Std. Deviation 12.283
Variance 150.871
Range 59
Minimum 26
Maximum 85
Sum 4624
Average ADD behavior
score in elementary school
N Valid 88
Missing 0
Mean 52.55
Median 50.00
Mode 50
Std. Deviation 12.283
Variance 150.871
Range 59
Minimum 26
Maximum 85
Sum 4624
Paraphrase This Document
Need a fresh take? Get an instant paraphrase of this document with our AI Paraphraser

Interpretation – From the above table we find out that value of mean is 52.55 and value of
standard deviation is 12.83.
As we can see value of mean and standard deviation is not close hence data is not normally
distributed.
To check statistics of variable level of English in ninth grade-
Statistics
Level of English in ninth
grade
N Valid 88
Missing 0
Mean 1.95
Std. Error of
Mean .056
Median 2.00
Mode 2
Std. Deviation .523
Variance .274
Range 2
Maximum 3

Interpretation - From the above table we find out that value of mean is 1.95 and value of standard
deviation is .523.
As we can see value of mean and standard deviation is close hence data is normally distributed.
Question 2
(a)
Hypothesis:
H0: There is significant relation between English level in grade nine (ENGL) and social
problems in grade nine (SOCPROB).
H1: There is no relation between English level in grade nine (ENGL) and social problems in
grade nine (SOCPROB).
⊘ This is a preview!⊘
Do you want full access?
Subscribe today to unlock all pages.

Trusted by 1+ million students worldwide

Descriptive Statistics
Statistic Bootstrap
Bias Std. Error 95% Confidence
Interval
Lower Upper
Social problems in ninth
grade
Mean .14 .00 .04 .07 .22
Std. Deviation .377 -.008 .061 .254 .483
N 88 0 0 88 88
Level of English in ninth
grade
Mean 1.95 .00 .06 1.84 2.07
Std. Deviation .523 -.005 .044 .428 .603
N 88 0 0 88 88
a. Unless otherwise noted, bootstrap results are based on 1000 bootstrap samples
Correlations
Social
problems in
ninth grade
Level of
English in
ninth grade
Social problems in ninth
grade
Pearson Correlation 1 .148
Sig. (2-tailed) .168
N 88 88
Bootstrap Bias 0 -.002
Paraphrase This Document
Need a fresh take? Get an instant paraphrase of this document with our AI Paraphraser

Std. Error 0 .113
95% Confidence
Interval
Lower 1 -.079
Upper 1 .368
Level of English in ninth
grade
Pearson Correlation .148 1
Sig. (2-tailed) .168
N 88 88
Bootstrap
Bias -.002 0
Std. Error .113 0
95% Confidence
Interval
Lower -.079 1
Upper .368 1
*. Correlation is significant at the 0.05 level (2-tailed).
**. Correlation is significant at the 0.01 level (2-tailed).
c. Unless otherwise noted, bootstrap results are based on 1000 bootstrap samples
95% Confidence
Interval
Lower 1 -.079
Upper 1 .368
Level of English in ninth
grade
Pearson Correlation .148 1
Sig. (2-tailed) .168
N 88 88
Bootstrap
Bias -.002 0
Std. Error .113 0
95% Confidence
Interval
Lower -.079 1
Upper .368 1
*. Correlation is significant at the 0.05 level (2-tailed).
**. Correlation is significant at the 0.01 level (2-tailed).
c. Unless otherwise noted, bootstrap results are based on 1000 bootstrap samples

Interpretation: In the context of above done analysis this can be stated that there are two tables
one is related to descriptive statistics and another is correlation. In according to above produced
table of descriptive statistics, mean and standard deviation values are far from each other. This
shows that data is not equally distributed. While in the context of correlation table this can be
stated that value of Pearson correlation is of 0.148 which is less than 0.3. This shows that there is
poor relation and alternative hypothesis is true which states that there is significant relation
between English level in grade nine (ENGL) and social problems in grade nine.
(b)
Hypothesis:
⊘ This is a preview!⊘
Do you want full access?
Subscribe today to unlock all pages.

Trusted by 1+ million students worldwide

H0: There is significant relation between ADD behavior scores (ADDSC) and grade point
averages in ninth grade.
H1: There is no relation between ADD behavior scores (ADDSC) and grade point averages in
ninth grade.
Descriptive Statistics
Statistic Bootstrap
Bias Std. Error 95% Confidence
Interval
Lower Upper
Average ADD behavior
score in elementary
school
Mean 52.55 -.03 1.26 50.14 55.02
Std. Deviation 12.283 -.088 .871 10.463 13.867
N 88 0 0 88 88
Grade point average in
ninth grade
Mean 2.4676 .0039 .0888 2.2940 2.6495
Std. Deviation .87188 -.00627 .05420 .75801 .96965
N 88 0 0 88 88
a. Unless otherwise noted, bootstrap results are based on 1000 bootstrap samples
Correlations
Paraphrase This Document
Need a fresh take? Get an instant paraphrase of this document with our AI Paraphraser

Average ADD
behavior score
in elementary
school
Grade point
average in
ninth grade
Average ADD behavior
score in elementary
school
Pearson Correlation 1 -.587**
Sig. (2-tailed) .000
N 88 88
Bootstrap
Bias 0 .001
Std. Error 0 .086
95% Confidence
Interval
Lower 1 -.729
Upper 1 -.390
Grade point average in
ninth grade
Pearson Correlation -.587** 1
Sig. (2-tailed) .000
N 88 88
Bootstrap
Bias .001 0
Std. Error .086 0
95% Confidence
Interval
Lower -.729 1
Upper -.390 1
**. Correlation is significant at the 0.01 level (2-tailed).
b. Unless otherwise noted, bootstrap results are based on 1000 bootstrap samples

Interpretation: With rationale to above hypothesis this can be stated that value of mean and
standard deviation is far from each other which shows that there is not equal distribution of data
set. while in the aspect of Pearson correlation value it can be inferred that this is negative which
is of -0.587 that shows that there is no relation between chosen variables. Hence, this can be
stated that there is no relation between ADD behavior scores (ADDSC) and grade point averages
in ninth grade.
(c)
Hypothesis:
⊘ This is a preview!⊘
Do you want full access?
Subscribe today to unlock all pages.

Trusted by 1+ million students worldwide
1 out of 17

Your All-in-One AI-Powered Toolkit for Academic Success.
+13062052269
info@desklib.com
Available 24*7 on WhatsApp / Email
Unlock your academic potential
Copyright © 2020–2025 A2Z Services. All Rights Reserved. Developed and managed by ZUCOL.