Business Statistics Assignment: Data Analysis, Charts, and Statistics

Verified

Added on  2020/05/28

|23
|3433
|387
Homework Assignment
AI Summary
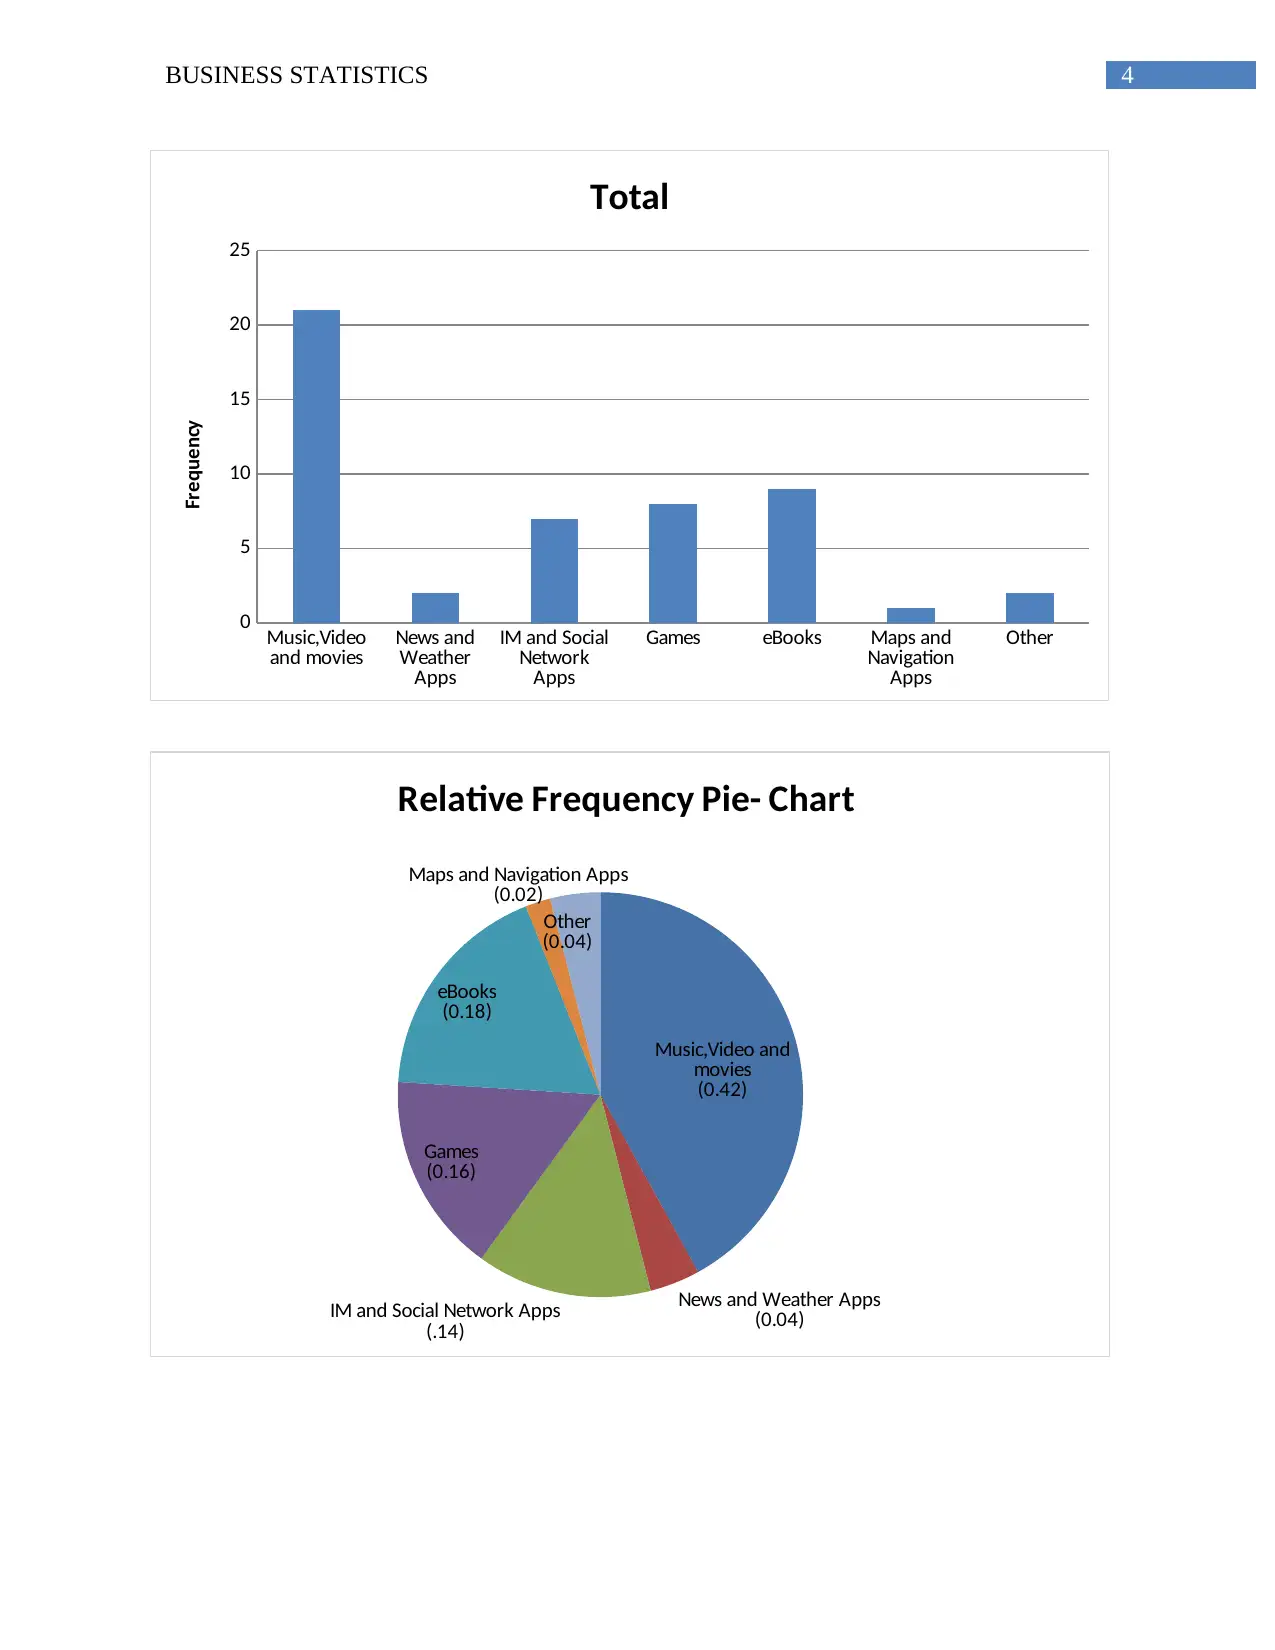
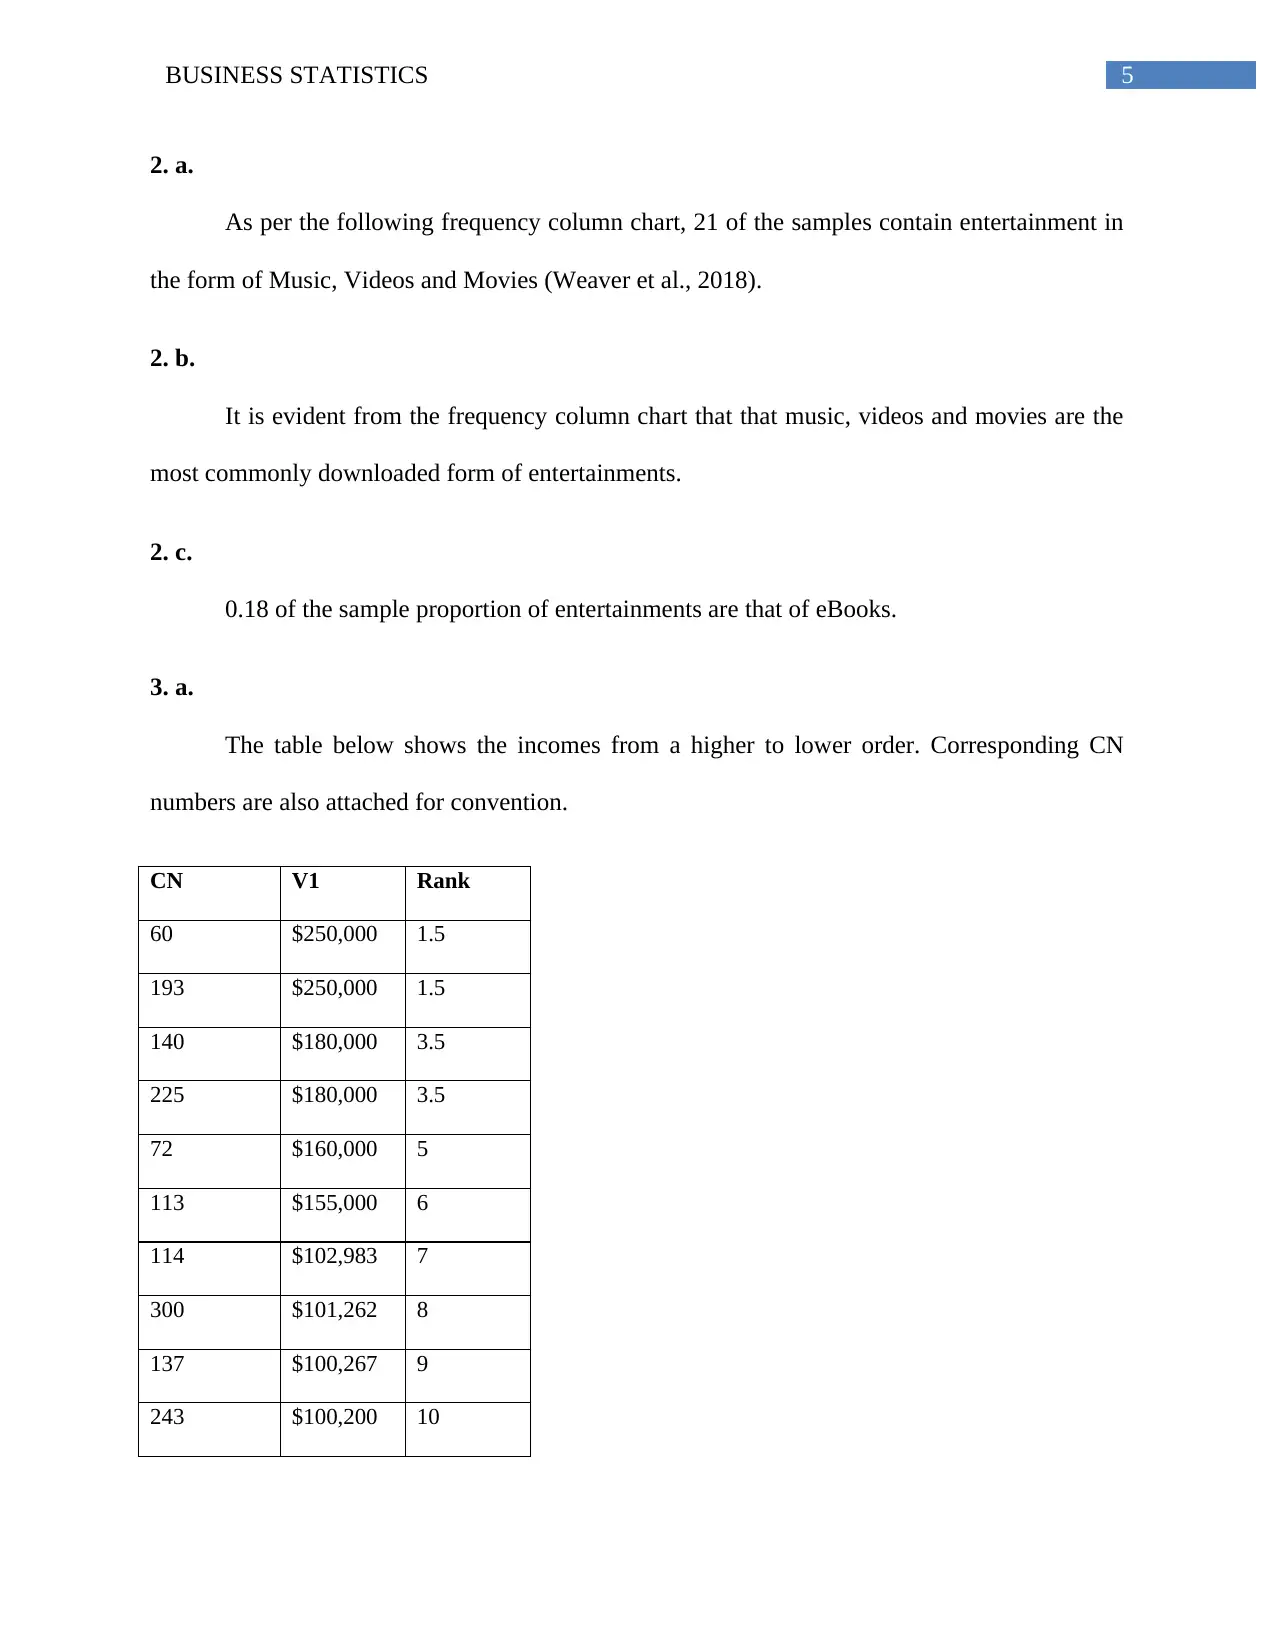
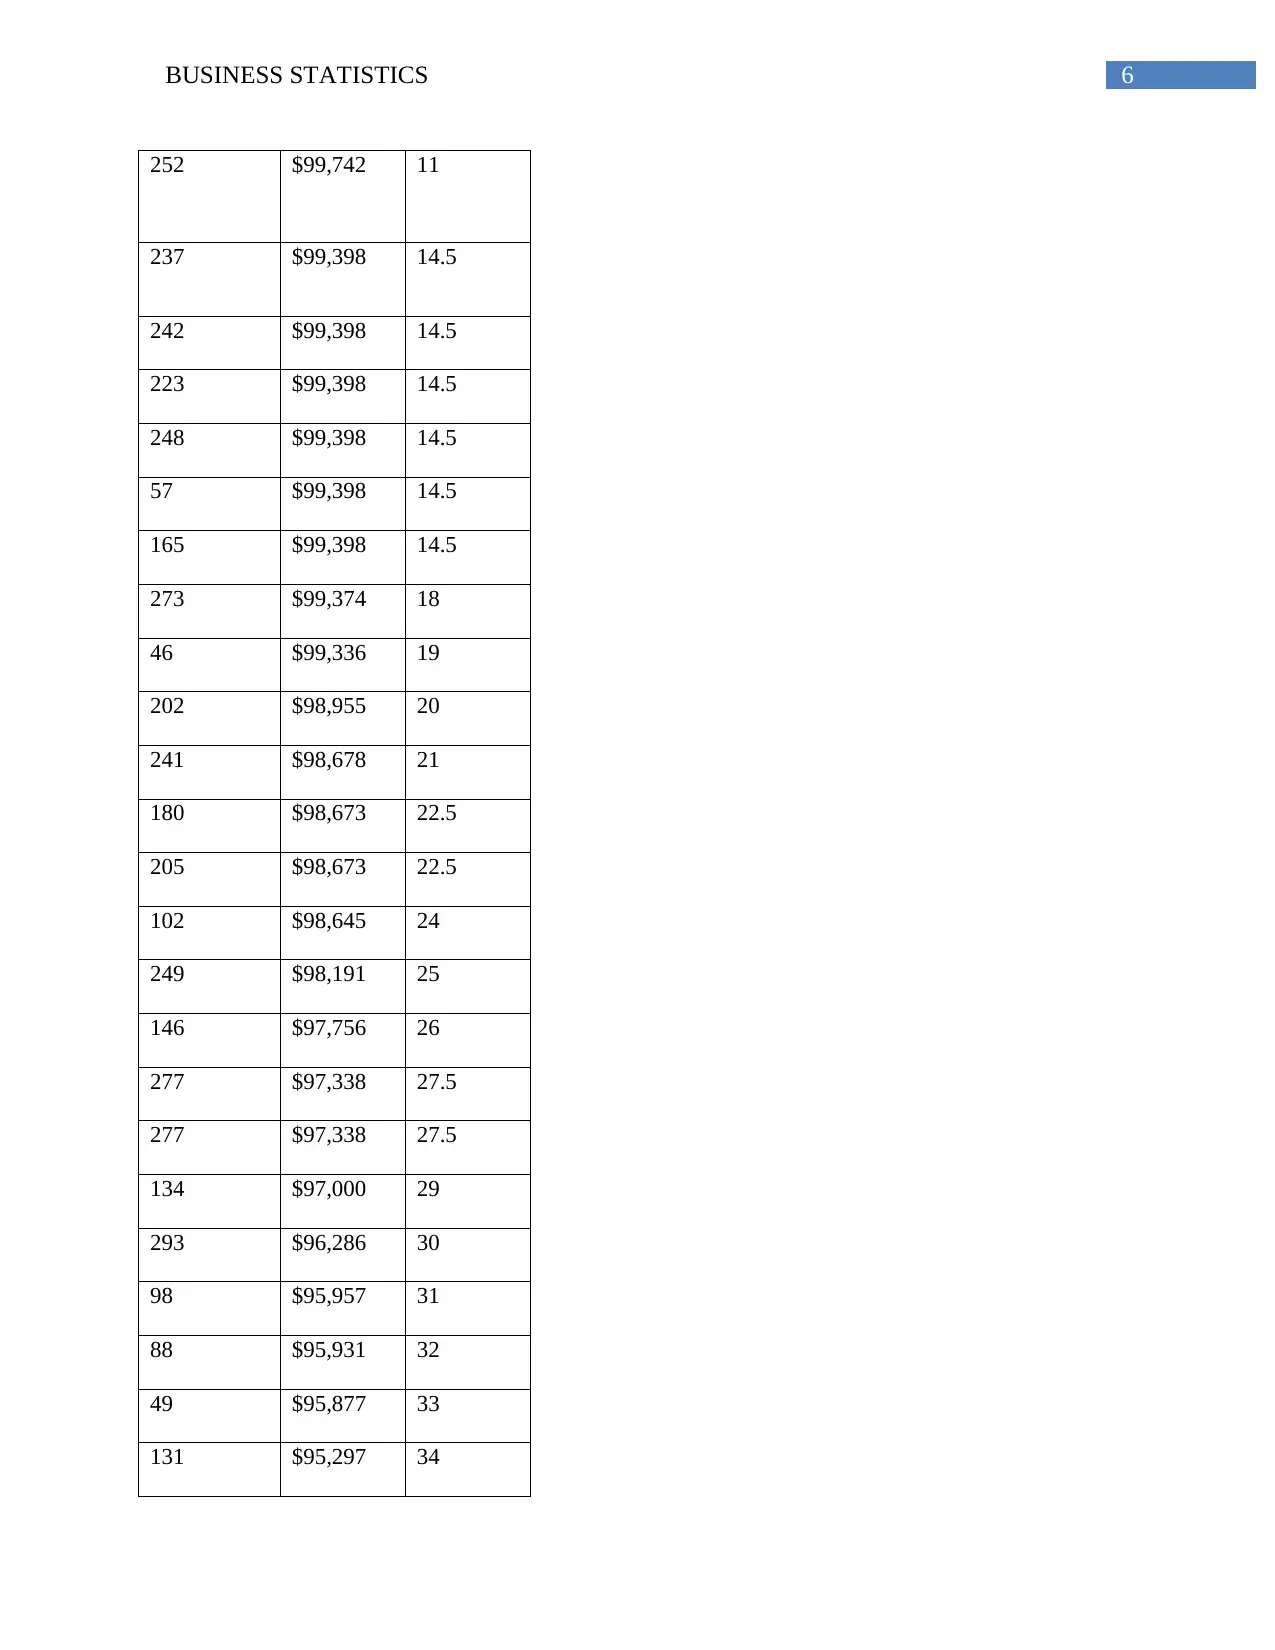
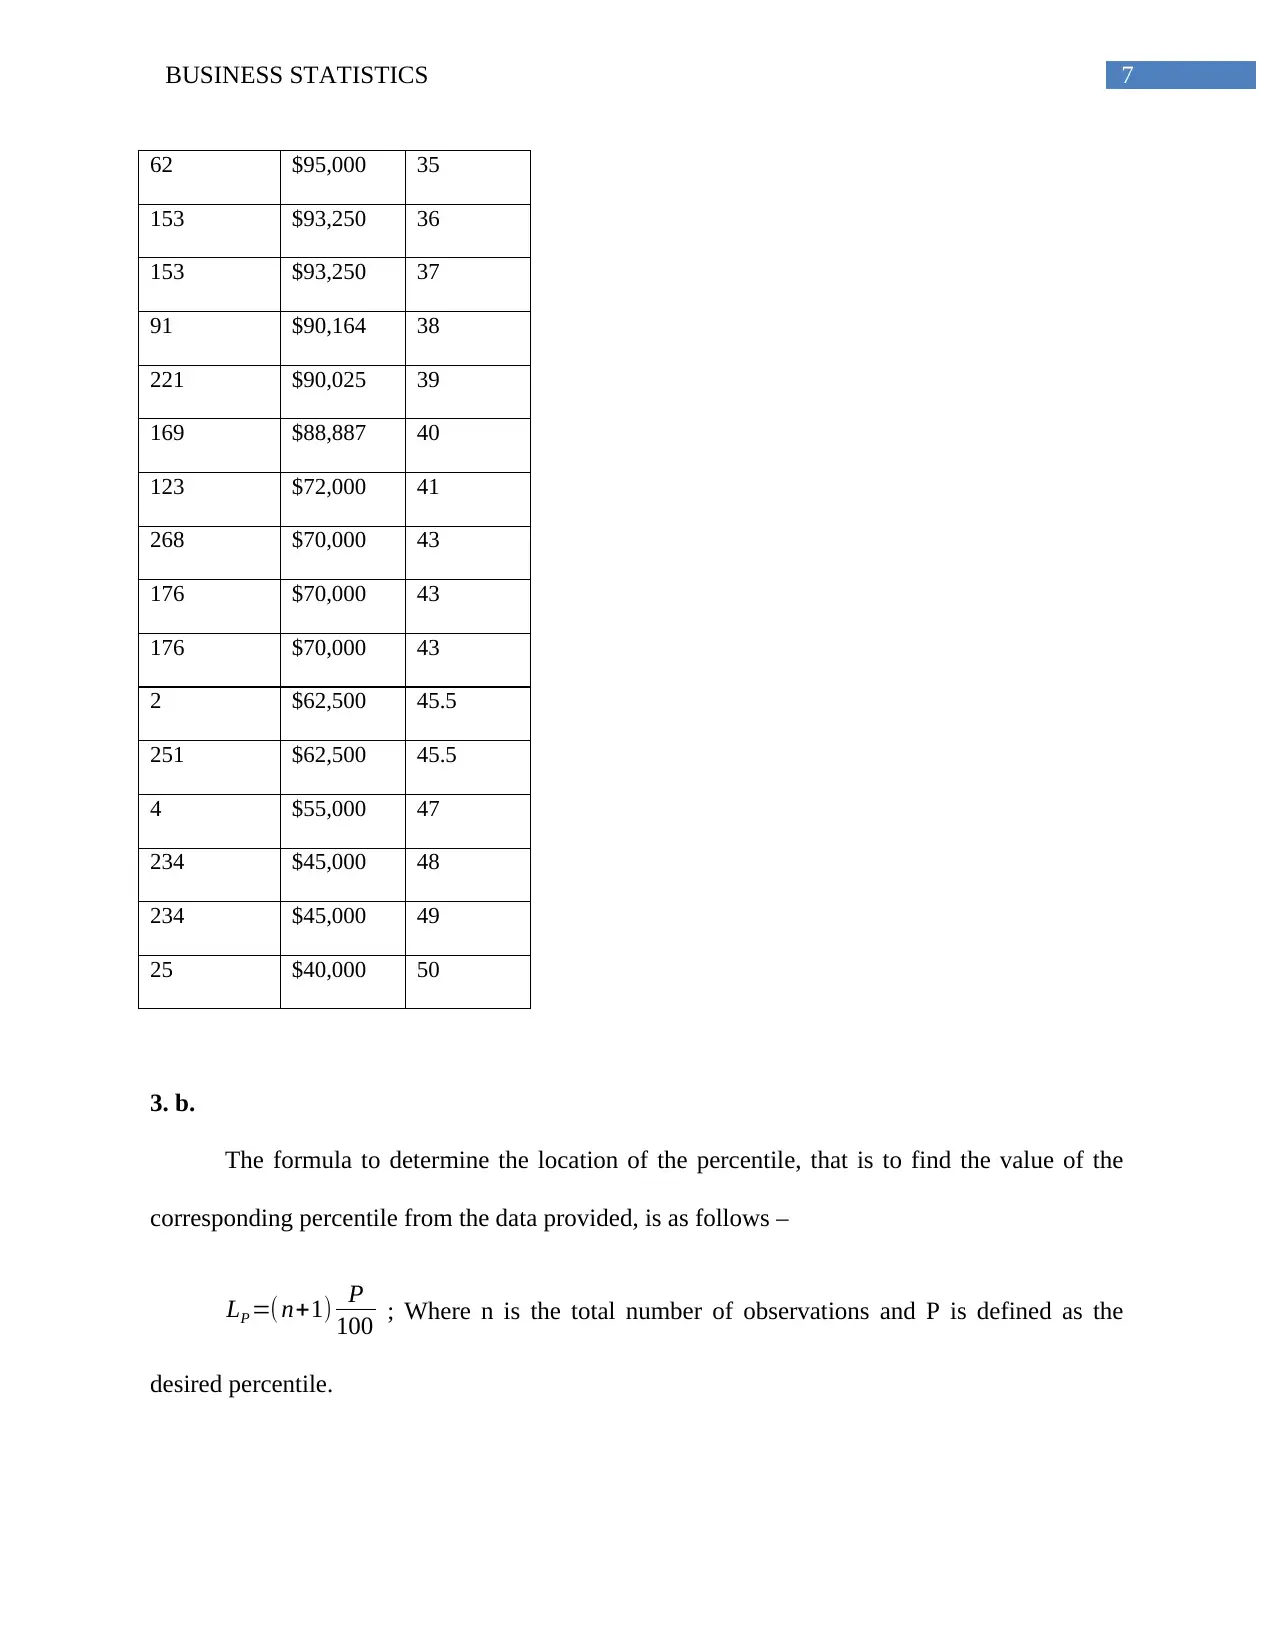
This assignment solution addresses a business statistics problem, beginning with random number selection based on a student ID to choose data samples. It then constructs frequency column charts and relative frequency pie charts to represent the distribution of entertainment types. Part of the assignment involves calculating income percentiles, including the 70th percentile and the interquartile range, using provided income data. Descriptive statistics such as mean, median, mode, standard deviation, and variance are calculated and analyzed to understand the dataset's central tendency and dispersion. The solution also explores whether the data follows a normal distribution, assessing skewness and identifying the number of observations within a specified range using Z-scores. The assignment provides detailed calculations and interpretations, demonstrating a comprehensive understanding of statistical concepts and their application.
Document Page
Running head: BUSINESS STATISTICS
BUSINESS STATISTICS
Name of the Student
Name of the Author
Author Note
tabler-icon-diamond-filled.svg

Paraphrase This Document

Need a fresh take? Get an instant paraphrase of this document with our AI Paraphraser
Document Page
1BUSINESS STATISTICS
Table of Contents
Assignment Part I............................................................................................................................3
1. b...............................................................................................................................................3
Assignment Part II...........................................................................................................................3
2. a................................................................................................................................................5
2. b...............................................................................................................................................5
2. c................................................................................................................................................5
3. a................................................................................................................................................5
3. b...............................................................................................................................................7
3. b. (i)......................................................................................................................................8
3. b. (ii)....................................................................................................................................8
3. c..............................................................................................................................................14
3. d.............................................................................................................................................14
4. a..............................................................................................................................................14
4. b.............................................................................................................................................15
4. c. (i)........................................................................................................................................15
4. c. (ii).......................................................................................................................................16
4. d.............................................................................................................................................16
5. a..............................................................................................................................................17
5. b.............................................................................................................................................18
Document Page
2BUSINESS STATISTICS
5. c..............................................................................................................................................20
7. a..............................................................................................................................................22
7. b.............................................................................................................................................23
7. c..............................................................................................................................................23
7. d.............................................................................................................................................23
7. e..............................................................................................................................................23
7. f..............................................................................................................................................23
References......................................................................................................................................24
Document Page
3BUSINESS STATISTICS
Assignment Part I
1. b.
The student ID number selected for this particular assignment is MIT17122. Thus,
according to the provided guideline of selecting the relevant random numbers, the last three
digits of the student ID are considered. Those are 122. Consequently, the random number
selection procedure has been started from row number 22 and column number 1. As the random
numbers are provided in sets of 6 digits, each set or block provides two random numbers
(Hamman et al., 2016). The first and last three digits of each block represent two distinct random
numbers of sizes three. In the corresponding excel sheet, the first column denotes the random
number selected. Second column denotes the respective values of the random numbers selected.
For instance, the first selected random number is 937 and so on (Chatterjee & Hadi, 2015). Third
column describes whether the selected random number is “Good” or “Not-Good”. Good means
the number can be selected as a sample number (Wilson, Bhatnagar & Townsend, 2017). Not
good means it has to be rejected. Random numbers from 001 to 300 are selected otherwise it is
rejected, including 000.
The selected samples are outlaid in the file named “SampleSmartPhoneData”, containing
50 samples from the provided list of 300.
Assignment Part II
As asked to provide, a Frequency Column Chart and a Relative Frequency Pie-chart has
been constructed to depict the number of and proportions of different entertainment type (Wun et
al., 2016).
tabler-icon-diamond-filled.svg

Paraphrase This Document

Need a fresh take? Get an instant paraphrase of this document with our AI Paraphraser
Document Page
4BUSINESS STATISTICS
Music,Video
and movies News and
Weather
Apps
IM and Social
Network
Apps
Games eBooks Maps and
Navigation
Apps
Other
0
5
10
15
20
25
Total
Frequency
Music,Video and
movies
(0.42)
News and Weather Apps
(0.04)IM and Social Network Apps
(.14)
Games
(0.16)
eBooks
(0.18)
Maps and Navigation Apps
(0.02)
Other
(0.04)
Relative Frequency Pie- Chart
Document Page
5BUSINESS STATISTICS
2. a.
As per the following frequency column chart, 21 of the samples contain entertainment in
the form of Music, Videos and Movies (Weaver et al., 2018).
2. b.
It is evident from the frequency column chart that that music, videos and movies are the
most commonly downloaded form of entertainments.
2. c.
0.18 of the sample proportion of entertainments are that of eBooks.
3. a.
The table below shows the incomes from a higher to lower order. Corresponding CN
numbers are also attached for convention.
CN V1 Rank
60 $250,000 1.5
193 $250,000 1.5
140 $180,000 3.5
225 $180,000 3.5
72 $160,000 5
113 $155,000 6
114 $102,983 7
300 $101,262 8
137 $100,267 9
243 $100,200 10
Document Page
6BUSINESS STATISTICS
252 $99,742 11
237 $99,398 14.5
242 $99,398 14.5
223 $99,398 14.5
248 $99,398 14.5
57 $99,398 14.5
165 $99,398 14.5
273 $99,374 18
46 $99,336 19
202 $98,955 20
241 $98,678 21
180 $98,673 22.5
205 $98,673 22.5
102 $98,645 24
249 $98,191 25
146 $97,756 26
277 $97,338 27.5
277 $97,338 27.5
134 $97,000 29
293 $96,286 30
98 $95,957 31
88 $95,931 32
49 $95,877 33
131 $95,297 34
tabler-icon-diamond-filled.svg

Paraphrase This Document

Need a fresh take? Get an instant paraphrase of this document with our AI Paraphraser
Document Page
7BUSINESS STATISTICS
62 $95,000 35
153 $93,250 36
153 $93,250 37
91 $90,164 38
221 $90,025 39
169 $88,887 40
123 $72,000 41
268 $70,000 43
176 $70,000 43
176 $70,000 43
2 $62,500 45.5
251 $62,500 45.5
4 $55,000 47
234 $45,000 48
234 $45,000 49
25 $40,000 50
3. b.
The formula to determine the location of the percentile, that is to find the value of the
corresponding percentile from the data provided, is as follows –
LP =( n+1) P
100 ; Where n is the total number of observations and P is defined as the
desired percentile.
Document Page
8BUSINESS STATISTICS
3. b. (i)
Here, the desired percentile is 70. Thus P =70. Substituting the value of P and considering
n = 50, the location of the parameter is found out to be –
LP = ( 50+1 ) 70
100 =35.7
It can be written as IR+FR=35+0.7=35.7
The value with rank 35 is $95000 and the value of 36th rank element is $93,250. Further to
determine the exact value corresponding to the 70th percentile, the formula used is –
0.7 (95000-93250) + 93250
= 0.7*1750+93250
=1125+93250
= $ 94475
3. b. (ii)
CN V1 Rank
60 $250,000 1
193 $250,000 1
140 $180,000 2
225 $180,000 2
72 $160,000 3
113 $155,000 4
Document Page
9BUSINESS STATISTICS
114 $102,983 5
300 $101,262 6
137 $100,267 7
243 $100,200 8
252 $99,742 9
237 $99,398 10
242 $99,398 10
223 $99,398 10
248 $99,398 10
57 $99,398 10
165 $99,398 10
273 $99,374 11
46 $99,336 12
202 $98,955 13
241 $98,678 14
180 $98,673 15
205 $98,673 15
102 $98,645 16
249 $98,191 17
146 $97,756 18
277 $97,338 19
277 $97,338 19
134 $97,000 20
293 $96,286 21
98 $95,957 22
tabler-icon-diamond-filled.svg

Paraphrase This Document

Need a fresh take? Get an instant paraphrase of this document with our AI Paraphraser
Document Page
10BUSINESS STATISTICS
88 $95,931 23
49 $95,877 24
131 $95,297 25
62 $95,000 26
153 $93,250 27
153 $93,250 28
91 $90,164 29
221 $90,025 30
169 $88,887 31
123 $72,000 32
268 $70,000 33
176 $70,000 33
176 $70,000 33
2 $62,500 34
251 $62,500 34
4 $55,000 35
234 $45,000 36
234 $45,000 36
25 $40,000 37
The first and third quartiles represent the 25th and 75th percentile. The calculations are
carried out in a similar fashion. To determine the 25th percentile value,
LP = ( 50+1 ) 25
100 =12.75
Document Page
11BUSINESS STATISTICS
This can be expressed as 12+ 0.75 = IR+FR =12.75
The value with rank 12 is $99,336 and the value of 13th rank element is $98,955. Further to
determine the exact value corresponding to the 25th percentile, the formula used is –
0.75* (99336-98955) + 98995
= 0.75*381+98995
=285.75+93250
= $ 99280.75
CN V1 Rank
60 $250,000 1.5
193 $250,000 1.5
140 $180,000 3.5
225 $180,000 3.5
72 $160,000 5
113 $155,000 6
114 $102,983 7
300 $101,262 8
137 $100,267 9
243 $100,200 10
252 $99,742 11
237 $99,398 14.5
242 $99,398 14.5
chevron_up_icon
1 out of 23
circle_padding
hide_on_mobile
zoom_out_icon
[object Object]