Statistics Assignment: Analysis of Australian Export and Expenditure
VerifiedAdded on 2019/09/27
|11
|1113
|353
Homework Assignment
AI Summary
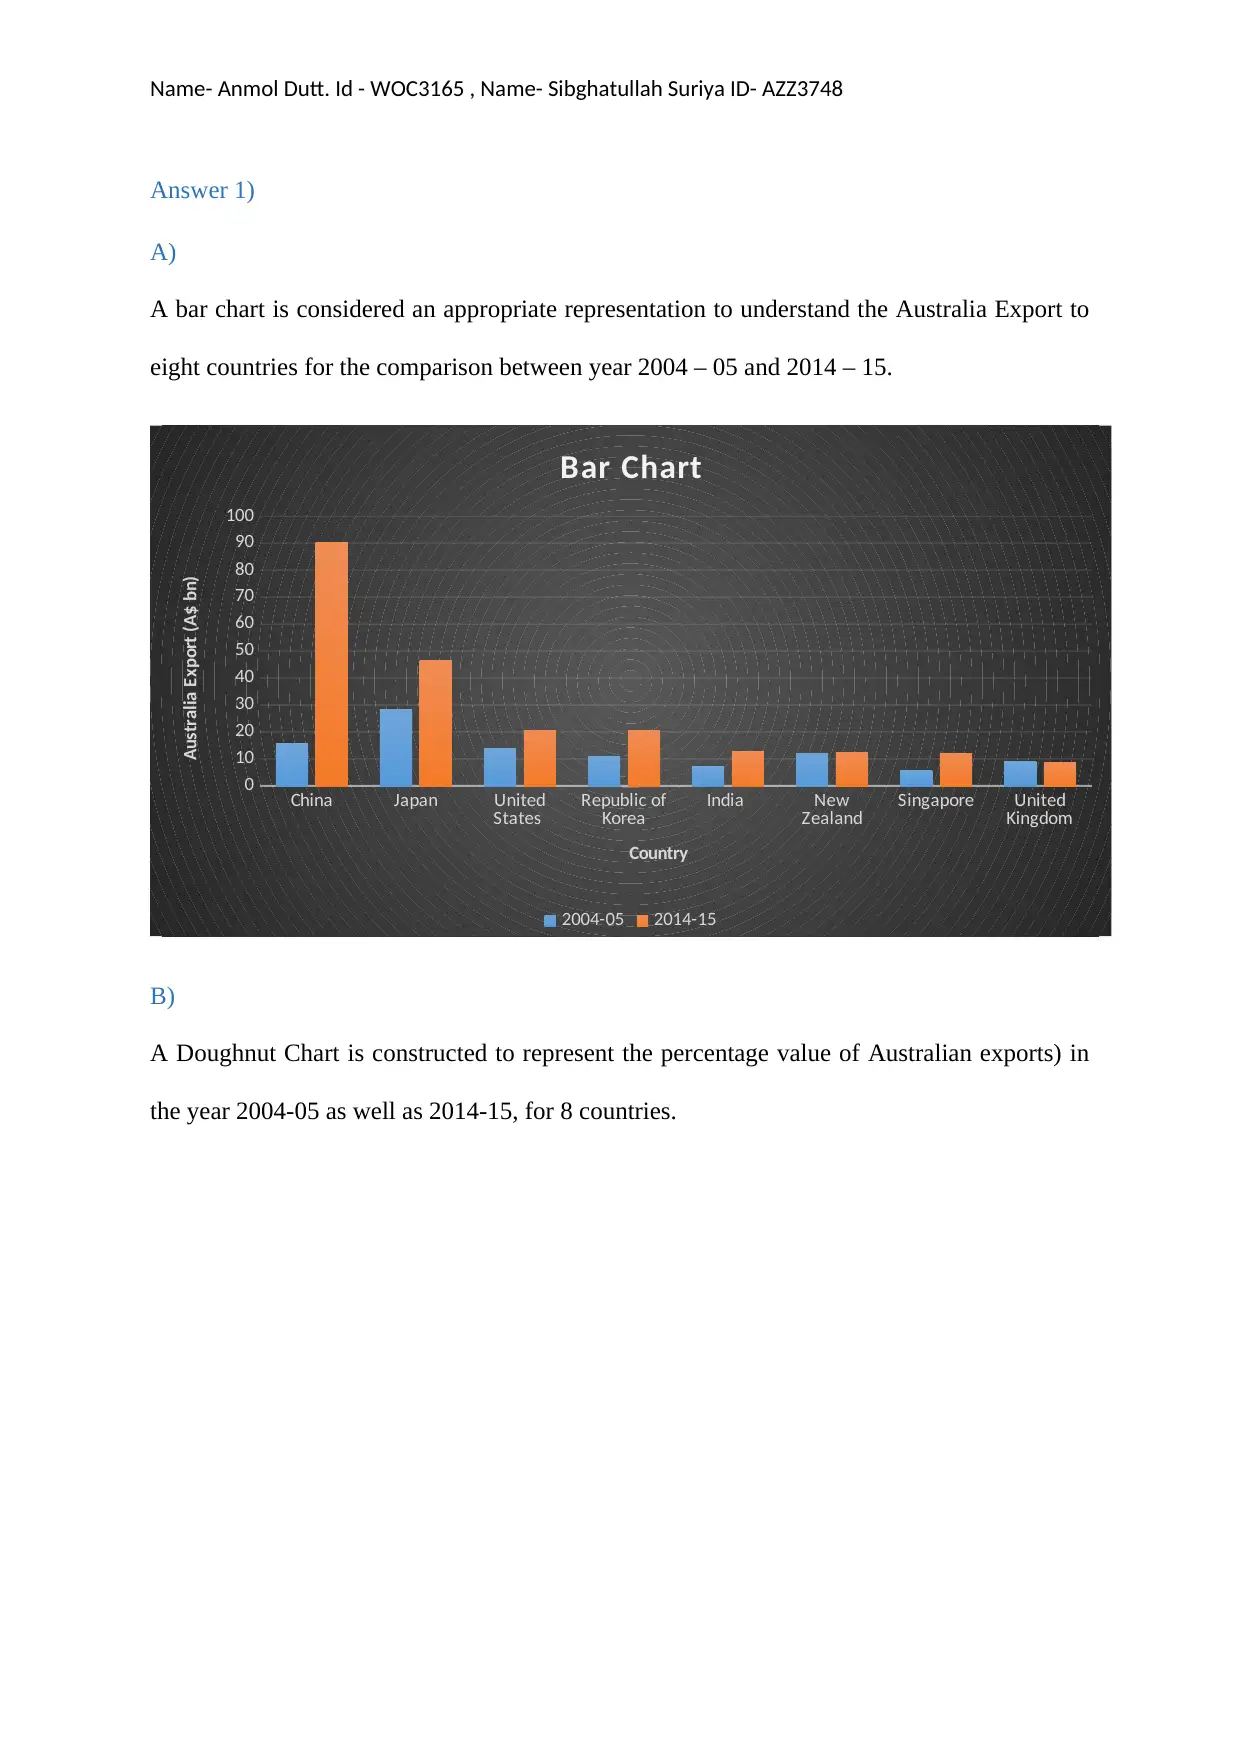
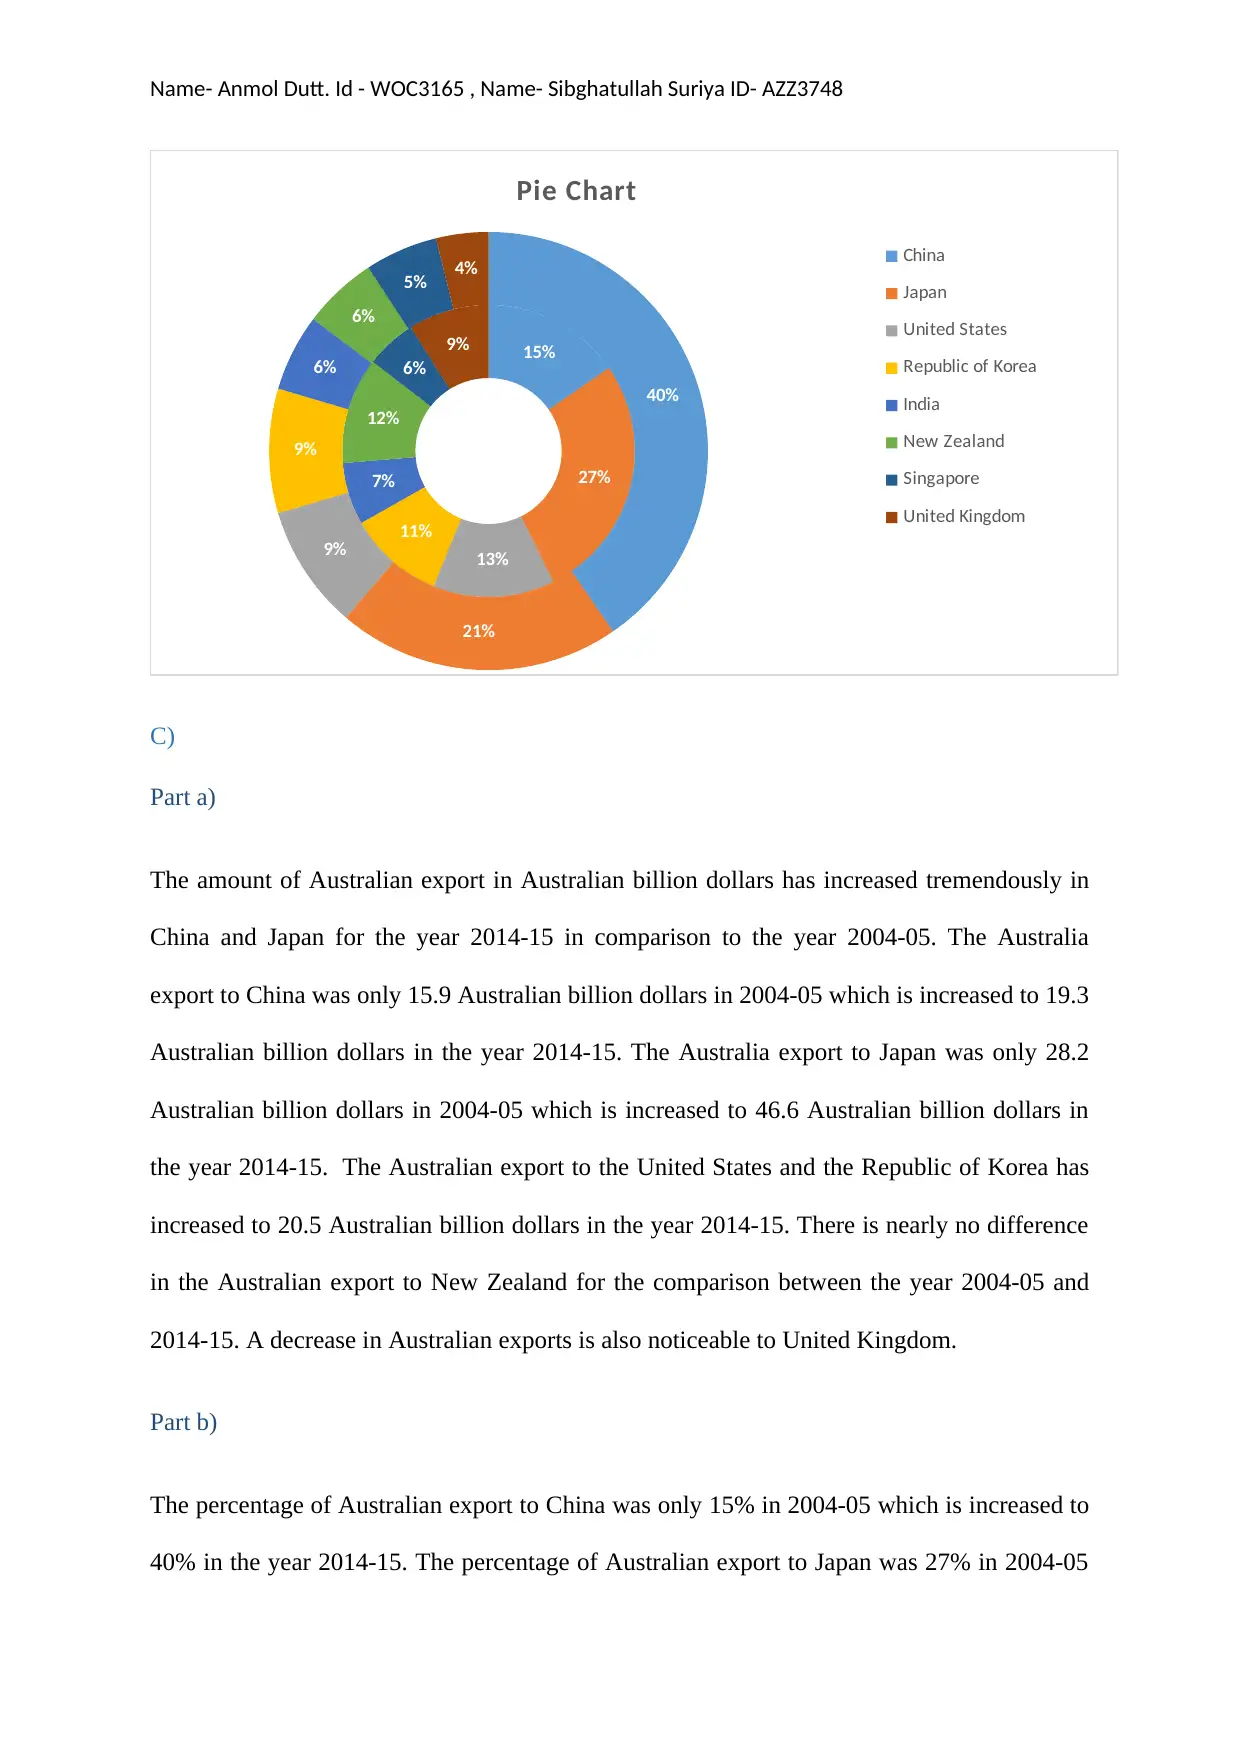
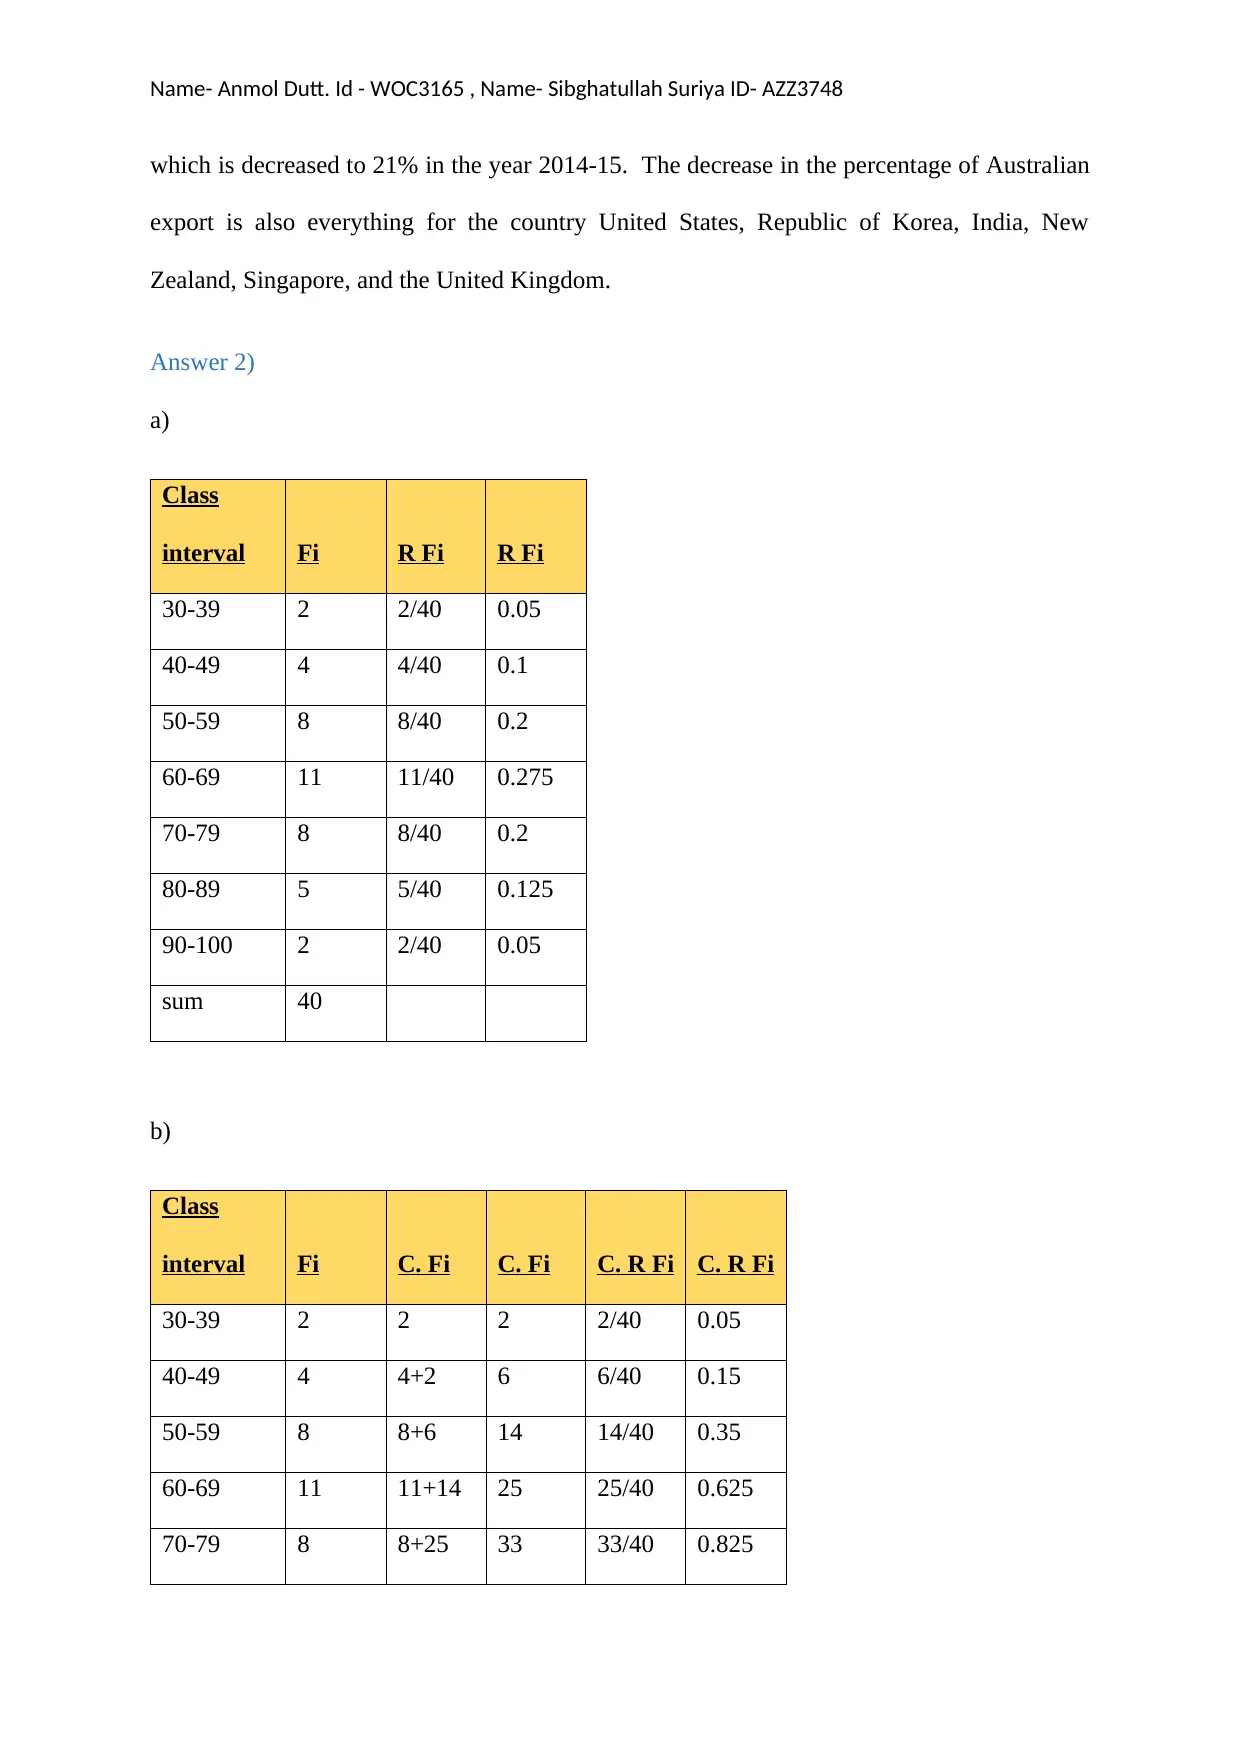
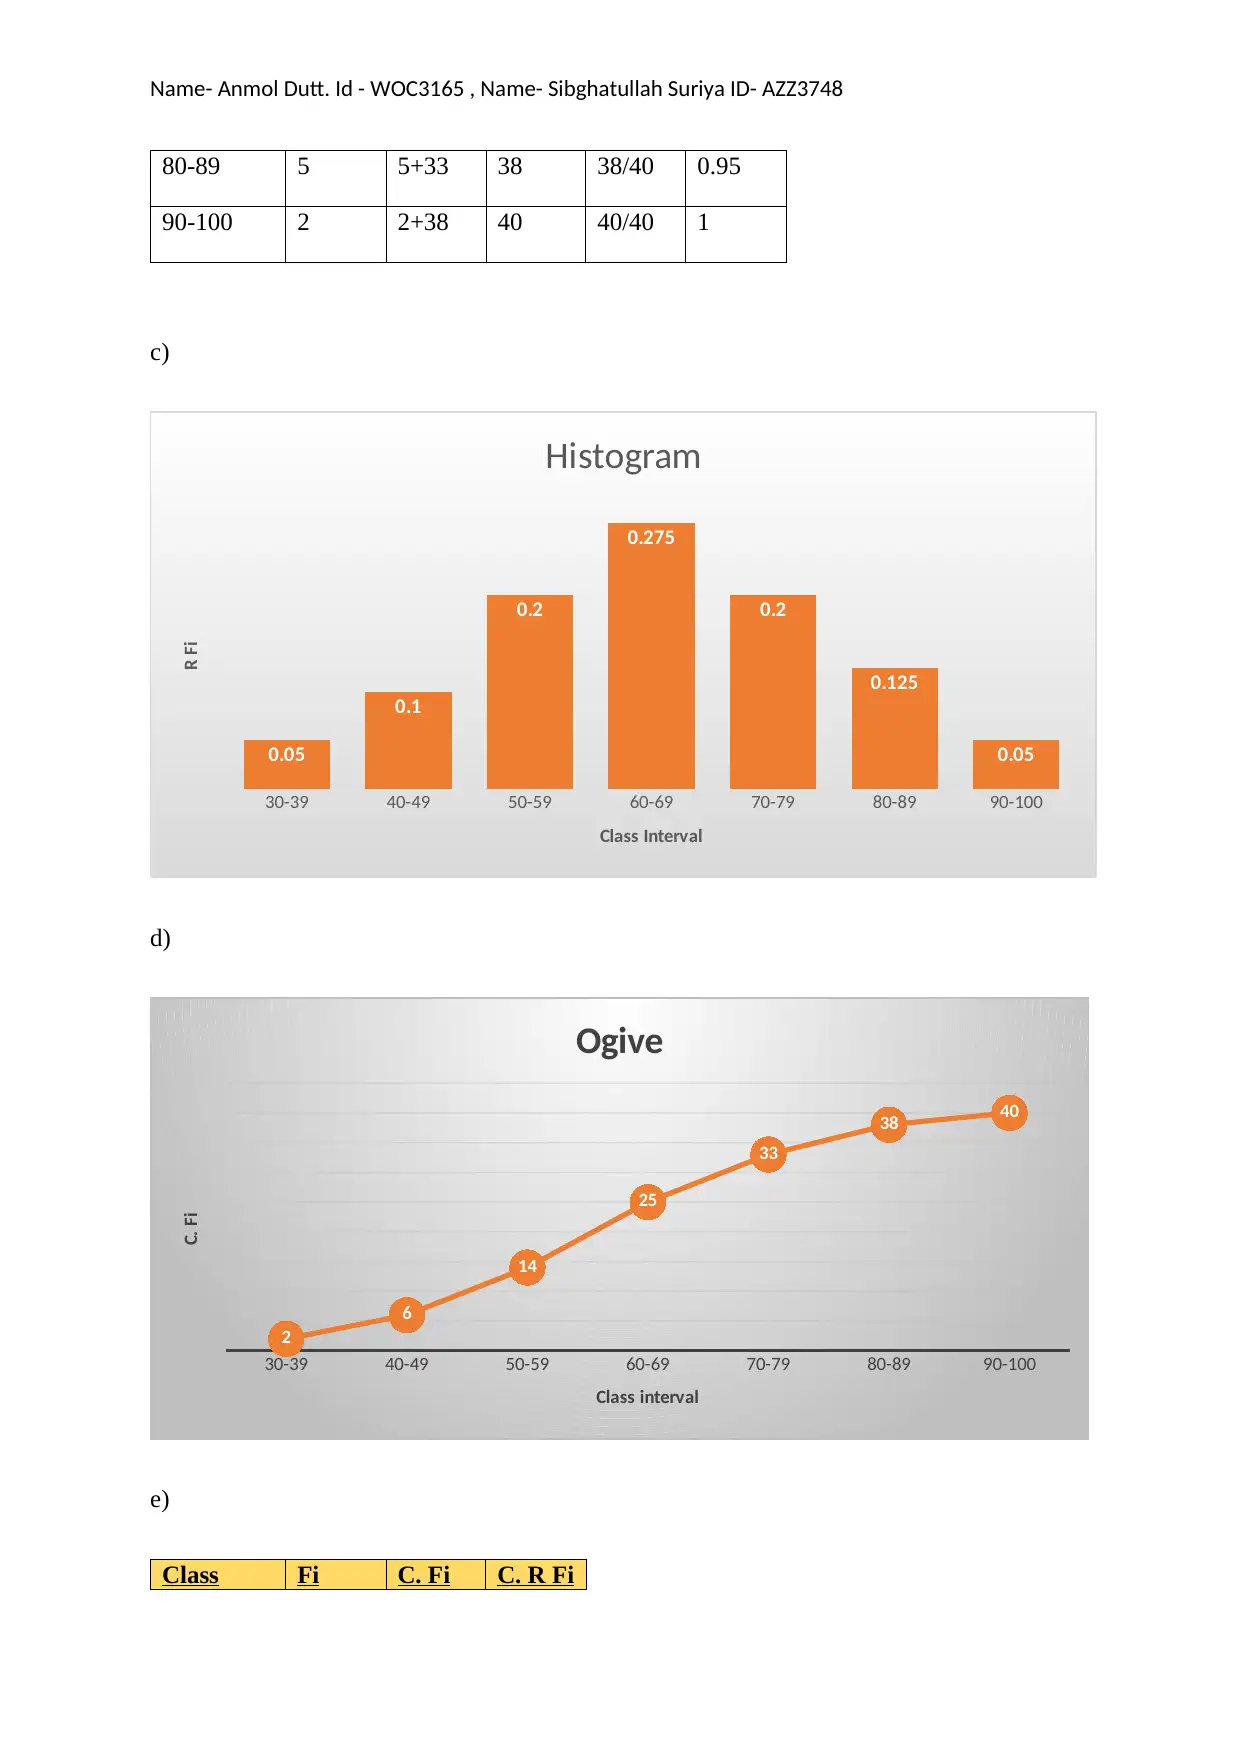
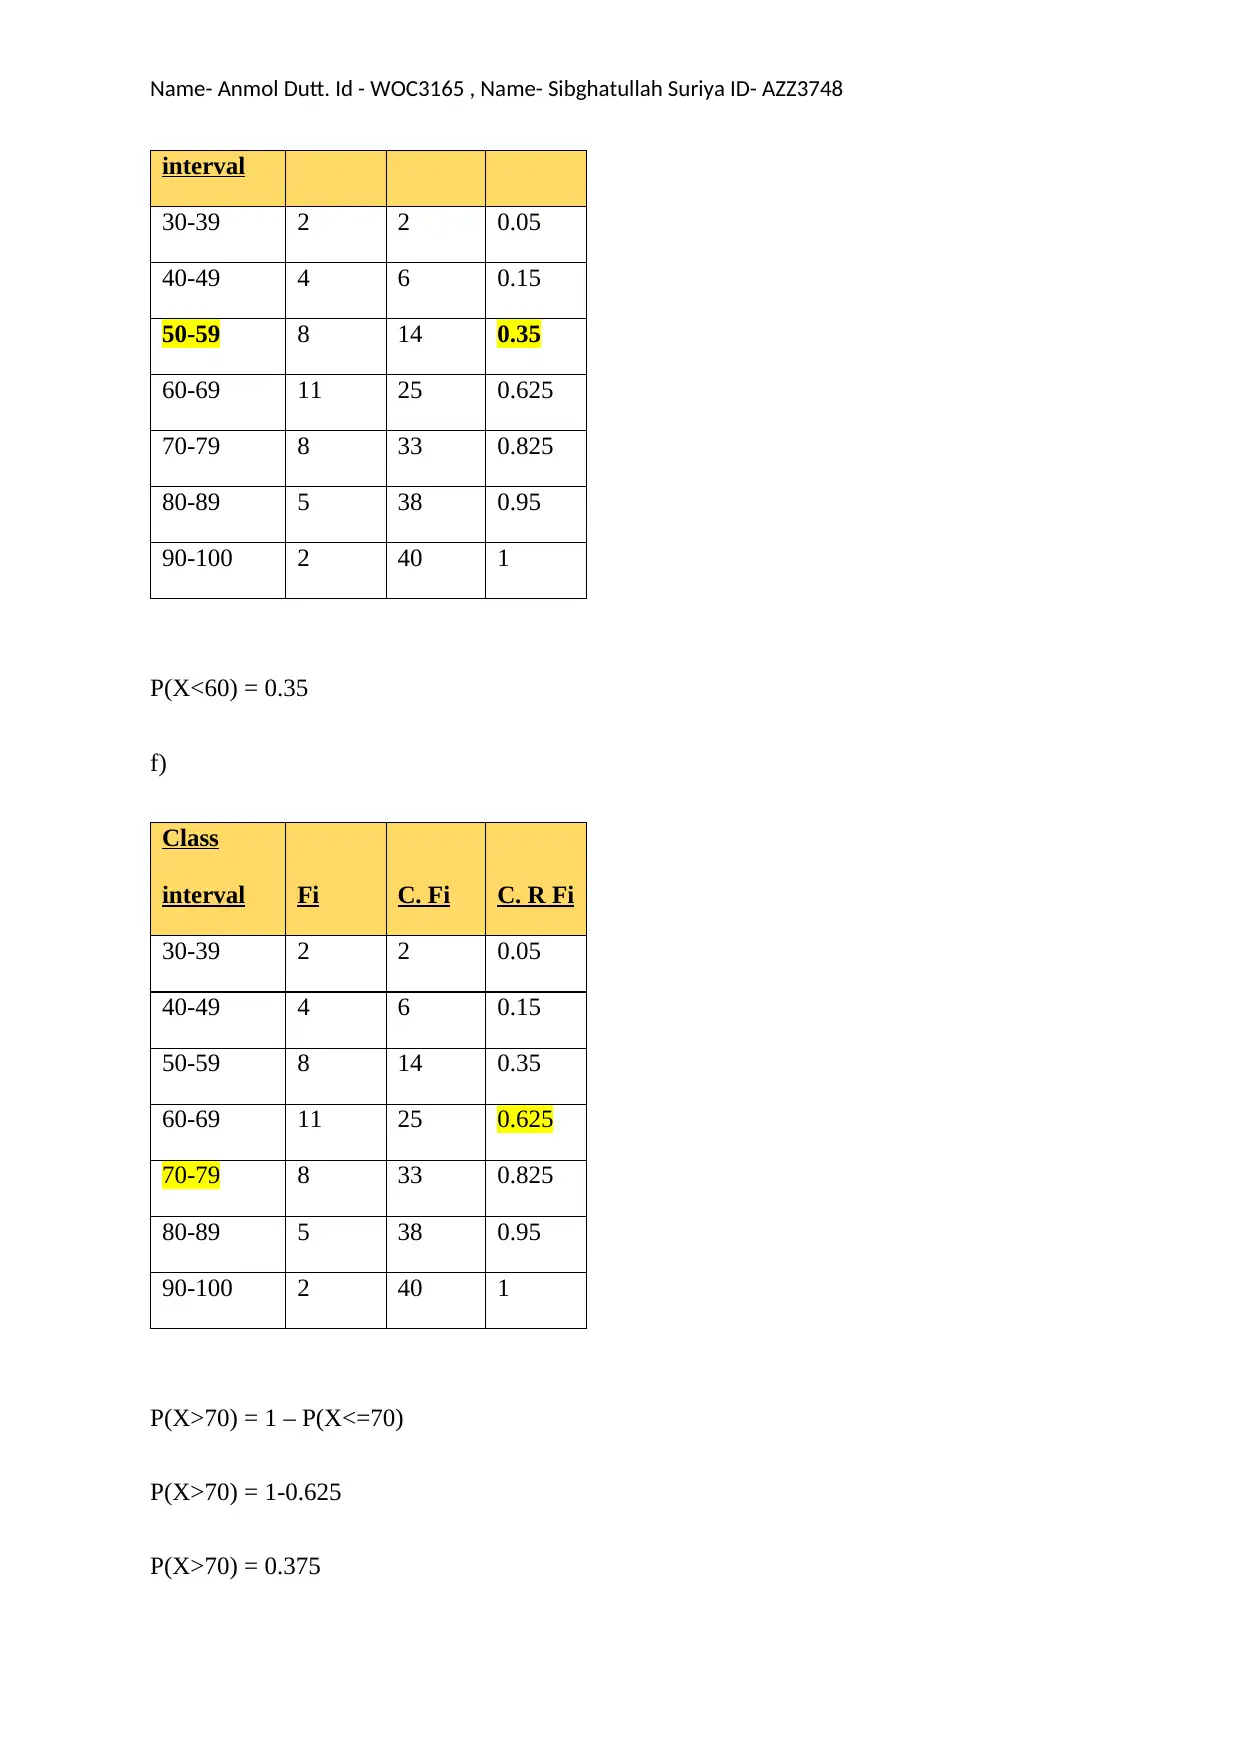
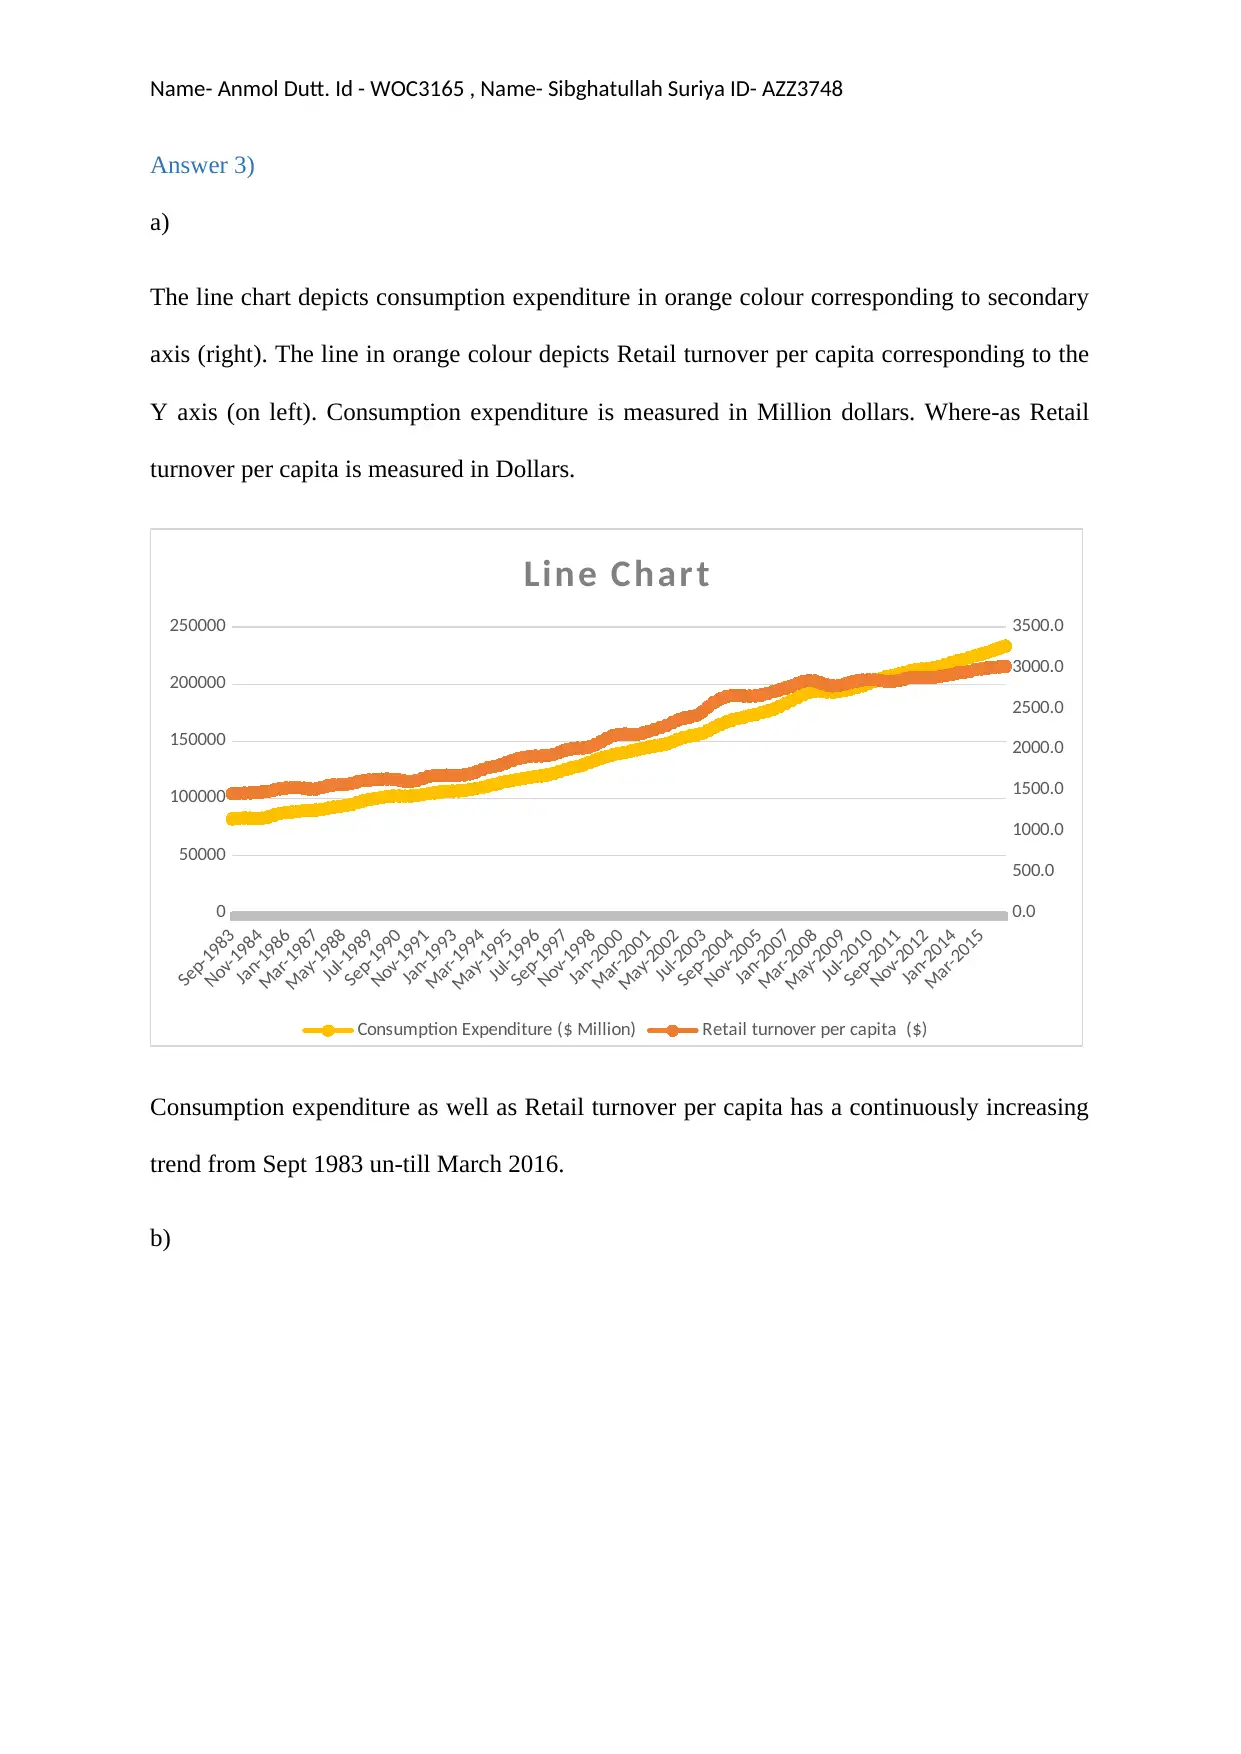
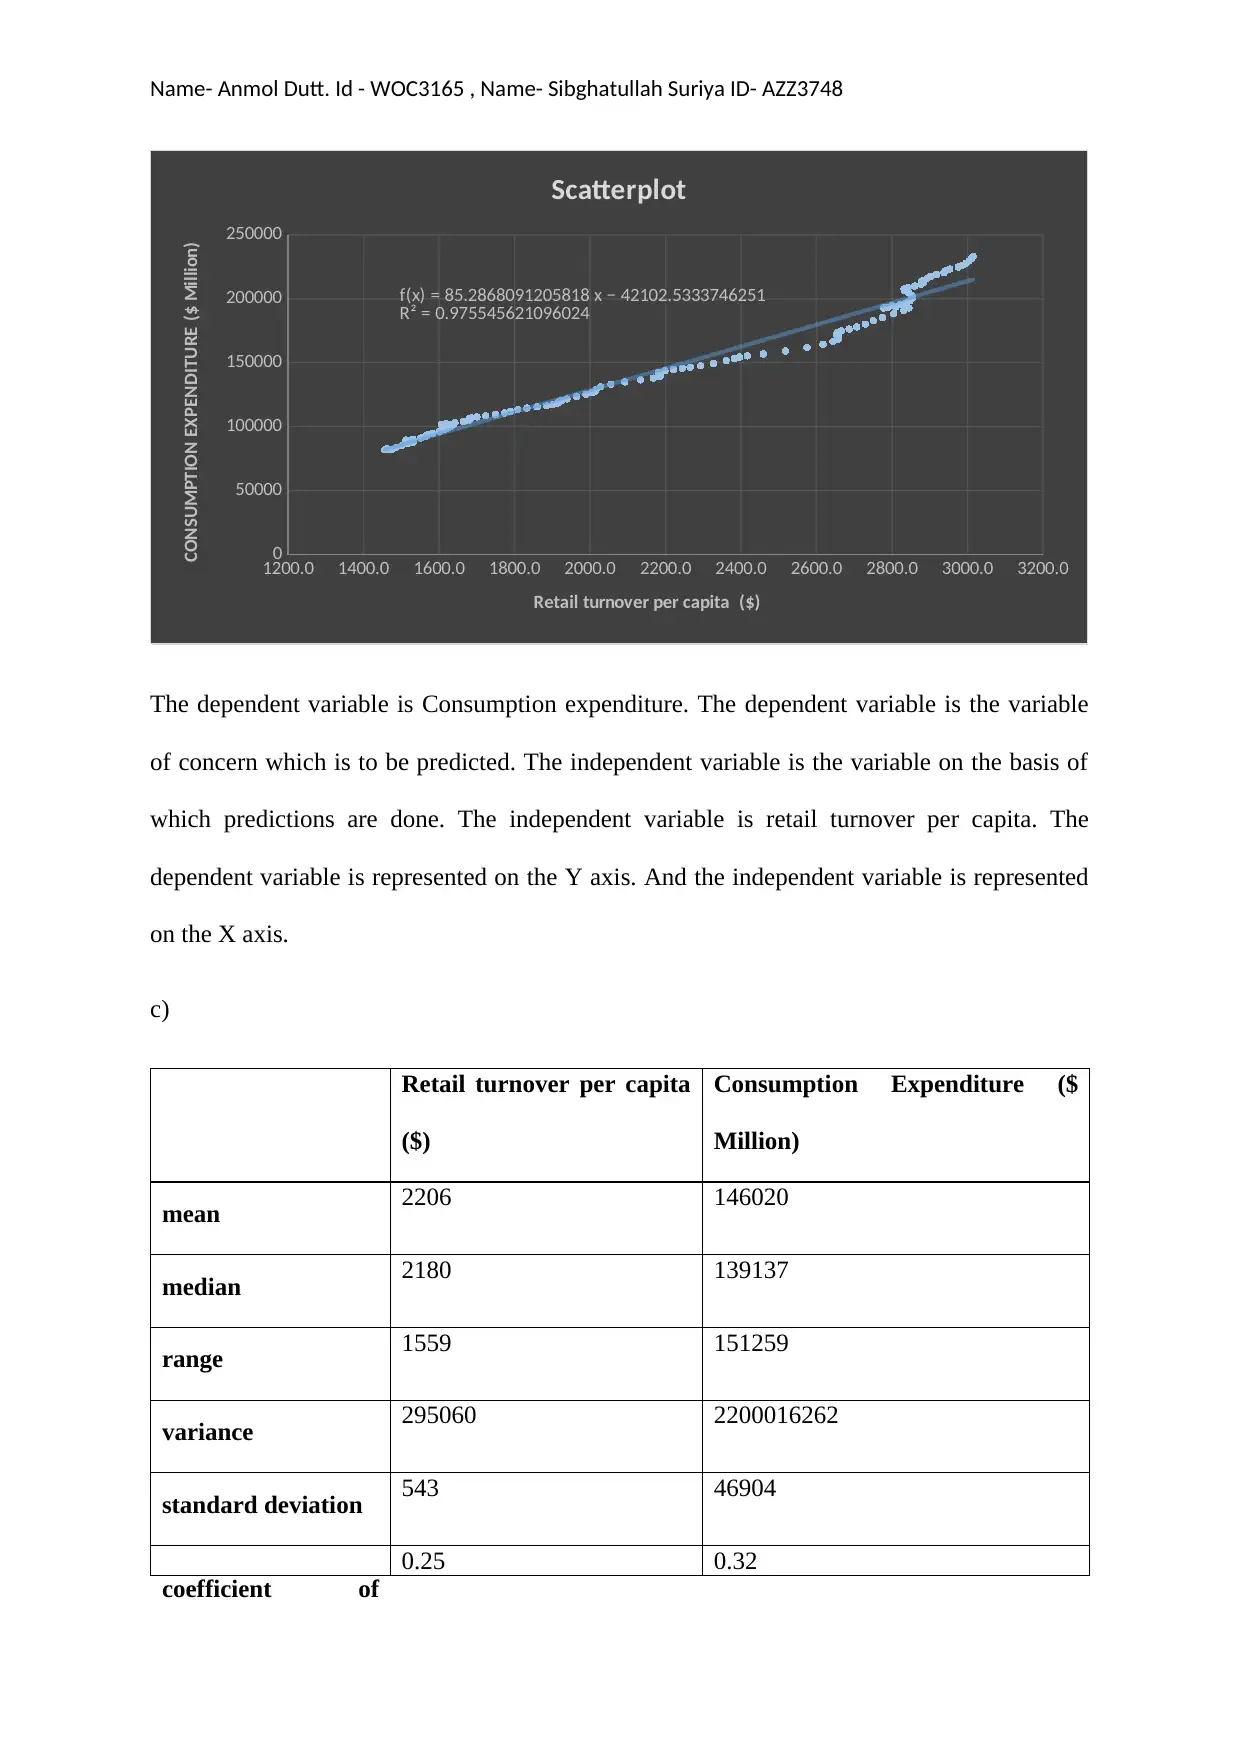
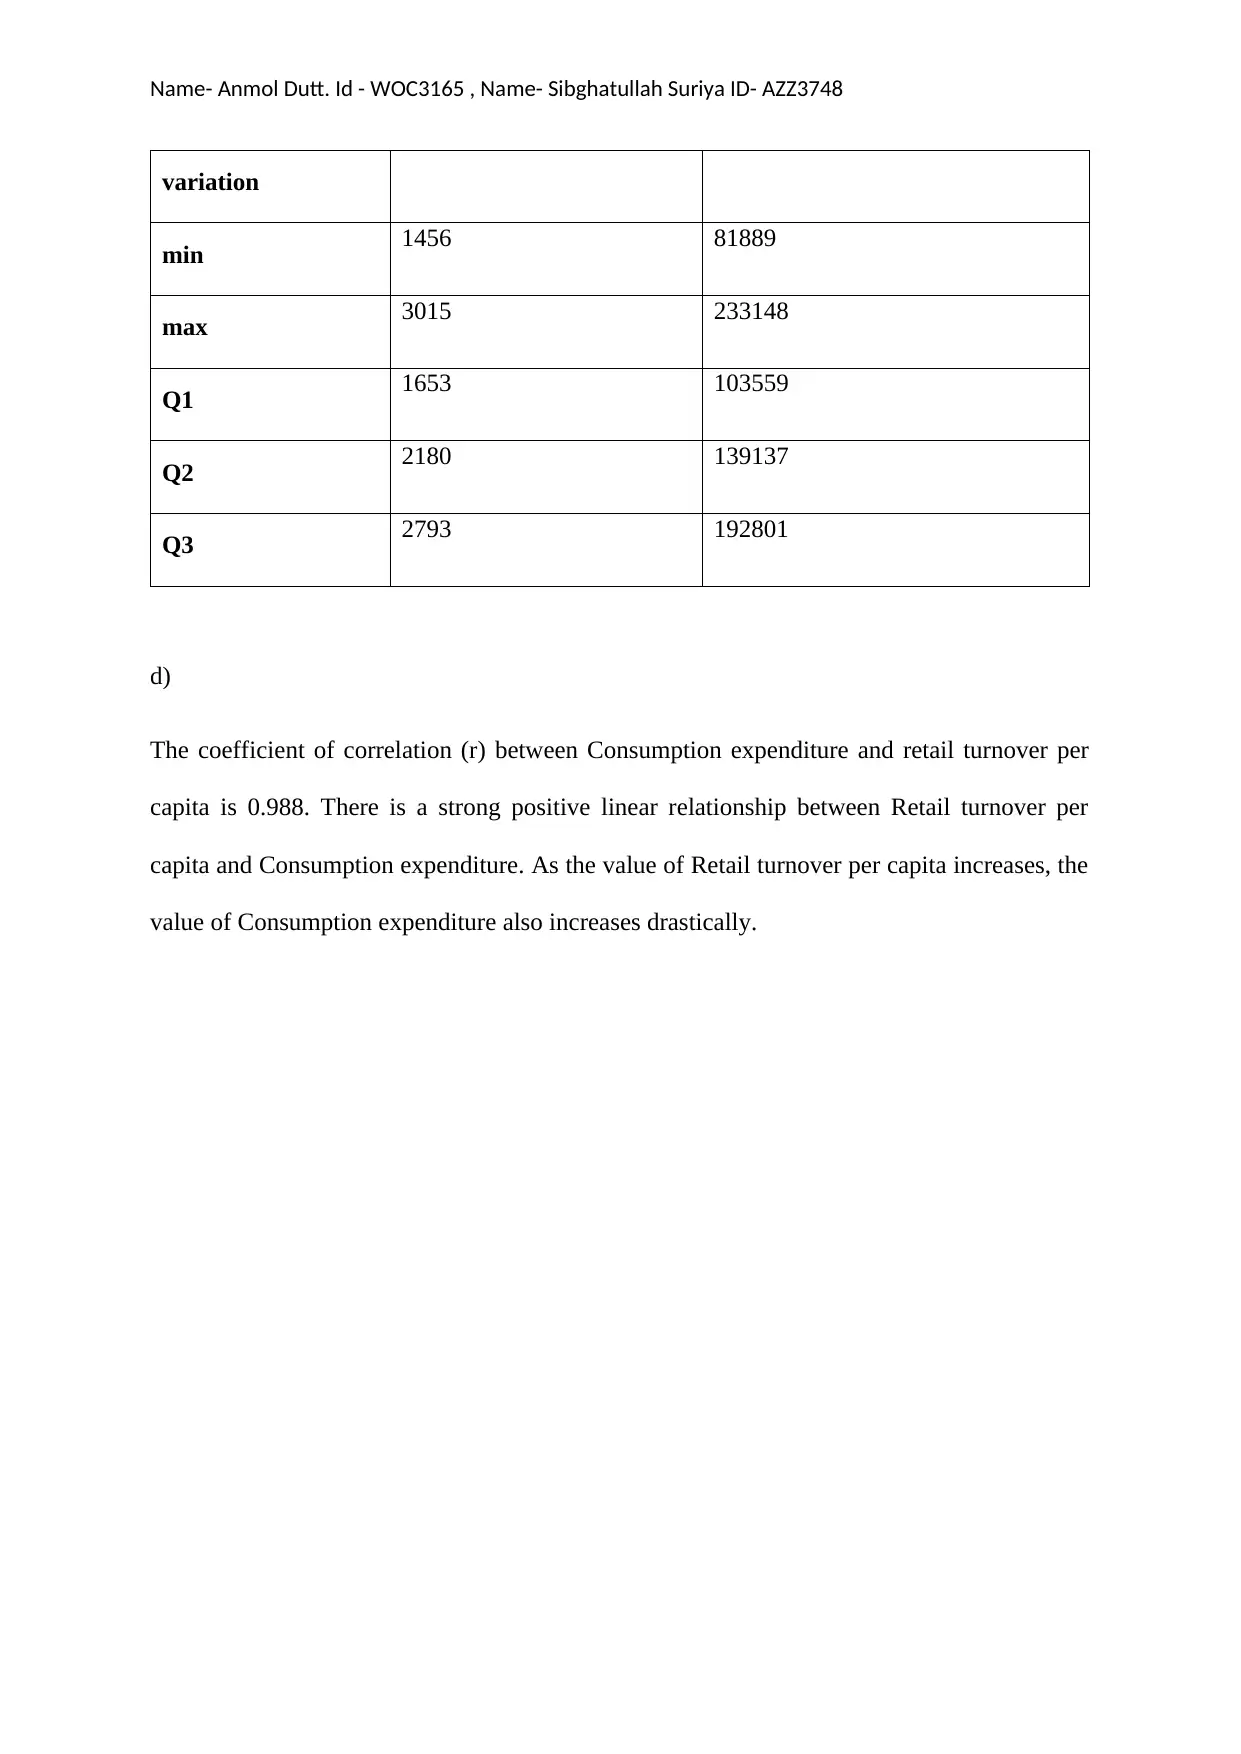
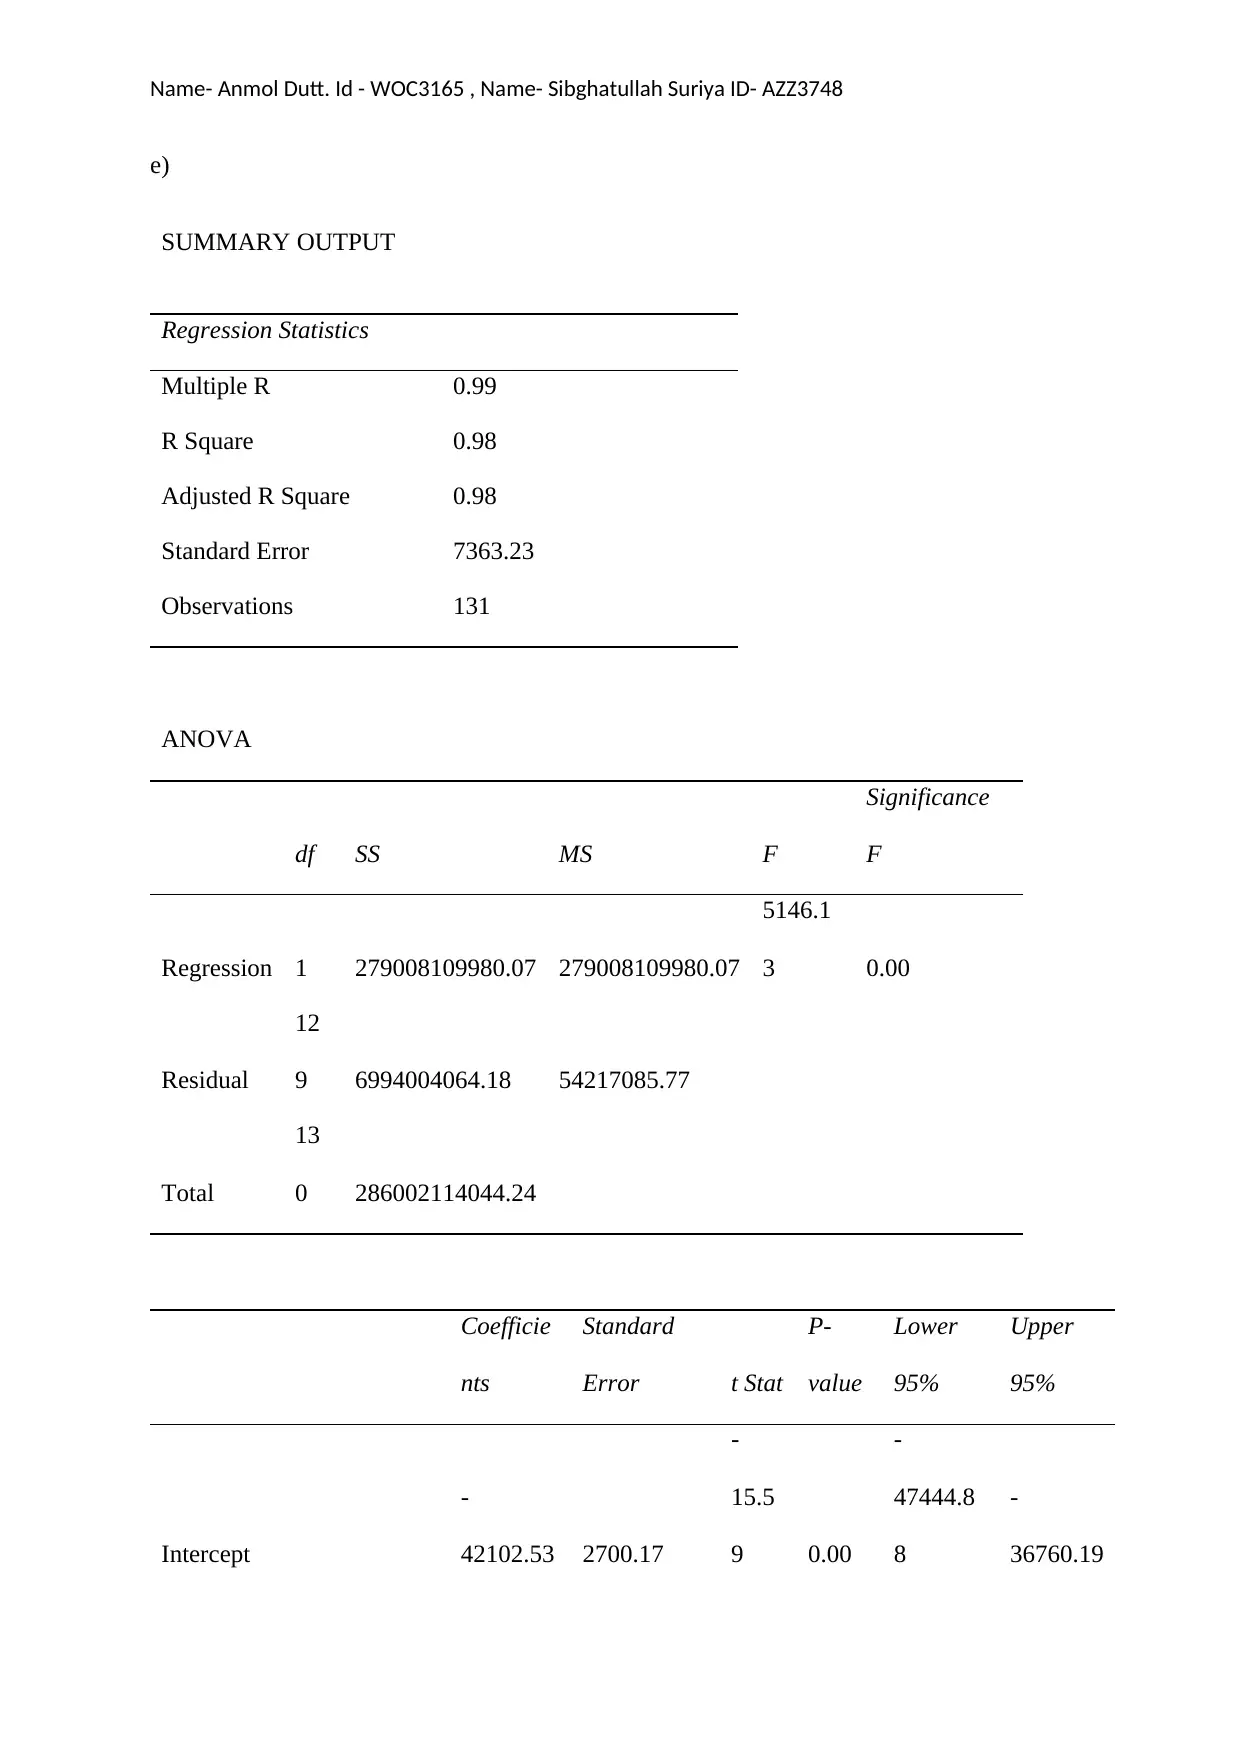
This statistics assignment, completed by Anmol Dutt and Sibghatullah Suriya, covers data analysis and interpretation. The assignment includes the analysis of Australian export data to various countries using bar and doughnut charts, comparing exports between 2004-05 and 2014-15. It also involves frequency distribution tables, cumulative frequency, and probability calculations. Furthermore, the assignment analyzes consumption expenditure and retail turnover per capita using a line chart and regression analysis. The analysis includes calculating means, medians, ranges, variances, standard deviations, and coefficients of correlation. The regression analysis provides a regression equation, interpretation of coefficients, coefficient of determination, and hypothesis testing to determine the relationship between consumption expenditure and retail turnover per capita.

Statistics
Student’s Name:
Name- Anmol Dutt. Id - WOC3165 ,
Name- Sibghatullah Suriya ID- AZZ3748
Student’s Name:
Name- Anmol Dutt. Id - WOC3165 ,
Name- Sibghatullah Suriya ID- AZZ3748
Paraphrase This Document
Need a fresh take? Get an instant paraphrase of this document with our AI Paraphraser

Name- Anmol Dutt. Id - WOC3165 , Name- Sibghatullah Suriya ID- AZZ3748
Table of Contents
Answer 1)..............................................................................................................................................2
A)......................................................................................................................................................2
B).......................................................................................................................................................2
C).......................................................................................................................................................3
Part a)............................................................................................................................................3
Part b)............................................................................................................................................3
Answer 2)..............................................................................................................................................4
Answer 3)..............................................................................................................................................7

Name- Anmol Dutt. Id - WOC3165 , Name- Sibghatullah Suriya ID- AZZ3748
Answer 1)
A)
A bar chart is considered an appropriate representation to understand the Australia Export to
eight countries for the comparison between year 2004 – 05 and 2014 – 15.
China Japan United
States Republic of
Korea India New
Zealand Singapore United
Kingdom
0
10
20
30
40
50
60
70
80
90
100
Bar Chart
2004-05 2014-15
Country
Australia Export (A$ bn)
B)
A Doughnut Chart is constructed to represent the percentage value of Australian exports) in
the year 2004-05 as well as 2014-15, for 8 countries.
⊘ This is a preview!⊘
Do you want full access?
Subscribe today to unlock all pages.

Trusted by 1+ million students worldwide

Name- Anmol Dutt. Id - WOC3165 , Name- Sibghatullah Suriya ID- AZZ3748
15%
27%
13%
11%
7%
12%
6%
9%
40%
21%
9%
9%
6%
6%
5% 4%
Pie Chart
China
Japan
United States
Republic of Korea
India
New Zealand
Singapore
United Kingdom
C)
Part a)
The amount of Australian export in Australian billion dollars has increased tremendously in
China and Japan for the year 2014-15 in comparison to the year 2004-05. The Australia
export to China was only 15.9 Australian billion dollars in 2004-05 which is increased to 19.3
Australian billion dollars in the year 2014-15. The Australia export to Japan was only 28.2
Australian billion dollars in 2004-05 which is increased to 46.6 Australian billion dollars in
the year 2014-15. The Australian export to the United States and the Republic of Korea has
increased to 20.5 Australian billion dollars in the year 2014-15. There is nearly no difference
in the Australian export to New Zealand for the comparison between the year 2004-05 and
2014-15. A decrease in Australian exports is also noticeable to United Kingdom.
Part b)
The percentage of Australian export to China was only 15% in 2004-05 which is increased to
40% in the year 2014-15. The percentage of Australian export to Japan was 27% in 2004-05
Paraphrase This Document
Need a fresh take? Get an instant paraphrase of this document with our AI Paraphraser

Name- Anmol Dutt. Id - WOC3165 , Name- Sibghatullah Suriya ID- AZZ3748
which is decreased to 21% in the year 2014-15. The decrease in the percentage of Australian
export is also everything for the country United States, Republic of Korea, India, New
Zealand, Singapore, and the United Kingdom.
Answer 2)
a)
Class
interval Fi R Fi R Fi
30-39 2 2/40 0.05
40-49 4 4/40 0.1
50-59 8 8/40 0.2
60-69 11 11/40 0.275
70-79 8 8/40 0.2
80-89 5 5/40 0.125
90-100 2 2/40 0.05
sum 40
b)
Class
interval Fi C. Fi C. Fi C. R Fi C. R Fi
30-39 2 2 2 2/40 0.05
40-49 4 4+2 6 6/40 0.15
50-59 8 8+6 14 14/40 0.35
60-69 11 11+14 25 25/40 0.625
70-79 8 8+25 33 33/40 0.825

Name- Anmol Dutt. Id - WOC3165 , Name- Sibghatullah Suriya ID- AZZ3748
80-89 5 5+33 38 38/40 0.95
90-100 2 2+38 40 40/40 1
c)
30-39 40-49 50-59 60-69 70-79 80-89 90-100
0.05
0.1
0.2
0.275
0.2
0.125
0.05
Histogram
Class Interval
R Fi
d)
30-39 40-49 50-59 60-69 70-79 80-89 90-100
2
6
14
25
33
38 40
Ogive
Class interval
C. Fi
e)
Class Fi C. Fi C. R Fi
80-89 5 5+33 38 38/40 0.95
90-100 2 2+38 40 40/40 1
c)
30-39 40-49 50-59 60-69 70-79 80-89 90-100
0.05
0.1
0.2
0.275
0.2
0.125
0.05
Histogram
Class Interval
R Fi
d)
30-39 40-49 50-59 60-69 70-79 80-89 90-100
2
6
14
25
33
38 40
Ogive
Class interval
C. Fi
e)
Class Fi C. Fi C. R Fi
⊘ This is a preview!⊘
Do you want full access?
Subscribe today to unlock all pages.

Trusted by 1+ million students worldwide

Name- Anmol Dutt. Id - WOC3165 , Name- Sibghatullah Suriya ID- AZZ3748
interval
30-39 2 2 0.05
40-49 4 6 0.15
50-59 8 14 0.35
60-69 11 25 0.625
70-79 8 33 0.825
80-89 5 38 0.95
90-100 2 40 1
P(X<60) = 0.35
f)
Class
interval Fi C. Fi C. R Fi
30-39 2 2 0.05
40-49 4 6 0.15
50-59 8 14 0.35
60-69 11 25 0.625
70-79 8 33 0.825
80-89 5 38 0.95
90-100 2 40 1
P(X>70) = 1 – P(X<=70)
P(X>70) = 1-0.625
P(X>70) = 0.375
Paraphrase This Document
Need a fresh take? Get an instant paraphrase of this document with our AI Paraphraser

Name- Anmol Dutt. Id - WOC3165 , Name- Sibghatullah Suriya ID- AZZ3748
Answer 3)
a)
The line chart depicts consumption expenditure in orange colour corresponding to secondary
axis (right). The line in orange colour depicts Retail turnover per capita corresponding to the
Y axis (on left). Consumption expenditure is measured in Million dollars. Where-as Retail
turnover per capita is measured in Dollars.
Sep-1983
Nov-1984
Jan-1986
Mar-1987
May-1988
Jul-1989
Sep-1990
Nov-1991
Jan-1993
Mar-1994
May-1995
Jul-1996
Sep-1997
Nov-1998
Jan-2000
Mar-2001
May-2002
Jul-2003
Sep-2004
Nov-2005
Jan-2007
Mar-2008
May-2009
Jul-2010
Sep-2011
Nov-2012
Jan-2014
Mar-2015
0
50000
100000
150000
200000
250000
0.0
500.0
1000.0
1500.0
2000.0
2500.0
3000.0
3500.0
Line Chart
Consumption Expenditure ($ Million) Retail turnover per capita ($)
Consumption expenditure as well as Retail turnover per capita has a continuously increasing
trend from Sept 1983 un-till March 2016.
b)

Name- Anmol Dutt. Id - WOC3165 , Name- Sibghatullah Suriya ID- AZZ3748
1200.0 1400.0 1600.0 1800.0 2000.0 2200.0 2400.0 2600.0 2800.0 3000.0 3200.0
0
50000
100000
150000
200000
250000
f(x) = 85.2868091205818 x − 42102.5333746251
R² = 0.975545621096024
Scatterplot
Retail turnover per capita ($)
CONSUMPTION EXPENDITURE ($ Million)
The dependent variable is Consumption expenditure. The dependent variable is the variable
of concern which is to be predicted. The independent variable is the variable on the basis of
which predictions are done. The independent variable is retail turnover per capita. The
dependent variable is represented on the Y axis. And the independent variable is represented
on the X axis.
c)
Retail turnover per capita
($)
Consumption Expenditure ($
Million)
mean 2206 146020
median 2180 139137
range 1559 151259
variance 295060 2200016262
standard deviation 543 46904
coefficient of
0.25 0.32
⊘ This is a preview!⊘
Do you want full access?
Subscribe today to unlock all pages.

Trusted by 1+ million students worldwide

Name- Anmol Dutt. Id - WOC3165 , Name- Sibghatullah Suriya ID- AZZ3748
variation
min 1456 81889
max 3015 233148
Q1 1653 103559
Q2 2180 139137
Q3 2793 192801
d)
The coefficient of correlation (r) between Consumption expenditure and retail turnover per
capita is 0.988. There is a strong positive linear relationship between Retail turnover per
capita and Consumption expenditure. As the value of Retail turnover per capita increases, the
value of Consumption expenditure also increases drastically.
Paraphrase This Document
Need a fresh take? Get an instant paraphrase of this document with our AI Paraphraser

Name- Anmol Dutt. Id - WOC3165 , Name- Sibghatullah Suriya ID- AZZ3748
e)
SUMMARY OUTPUT
Regression Statistics
Multiple R 0.99
R Square 0.98
Adjusted R Square 0.98
Standard Error 7363.23
Observations 131
ANOVA
df SS MS F
Significance
F
Regression 1 279008109980.07 279008109980.07
5146.1
3 0.00
Residual
12
9 6994004064.18 54217085.77
Total
13
0 286002114044.24
Coefficie
nts
Standard
Error t Stat
P-
value
Lower
95%
Upper
95%
Intercept
-
42102.53 2700.17
-
15.5
9 0.00
-
47444.8
8
-
36760.19
1 out of 11
Related Documents

Your All-in-One AI-Powered Toolkit for Academic Success.
+13062052269
info@desklib.com
Available 24*7 on WhatsApp / Email
Unlock your academic potential
© 2024 | Zucol Services PVT LTD | All rights reserved.