Detailed Solution for HI6007 Statistics Group Assignment - Analysis

Verified

Added on  2021/05/31

|9
|876
|84
Homework Assignment
AI Summary
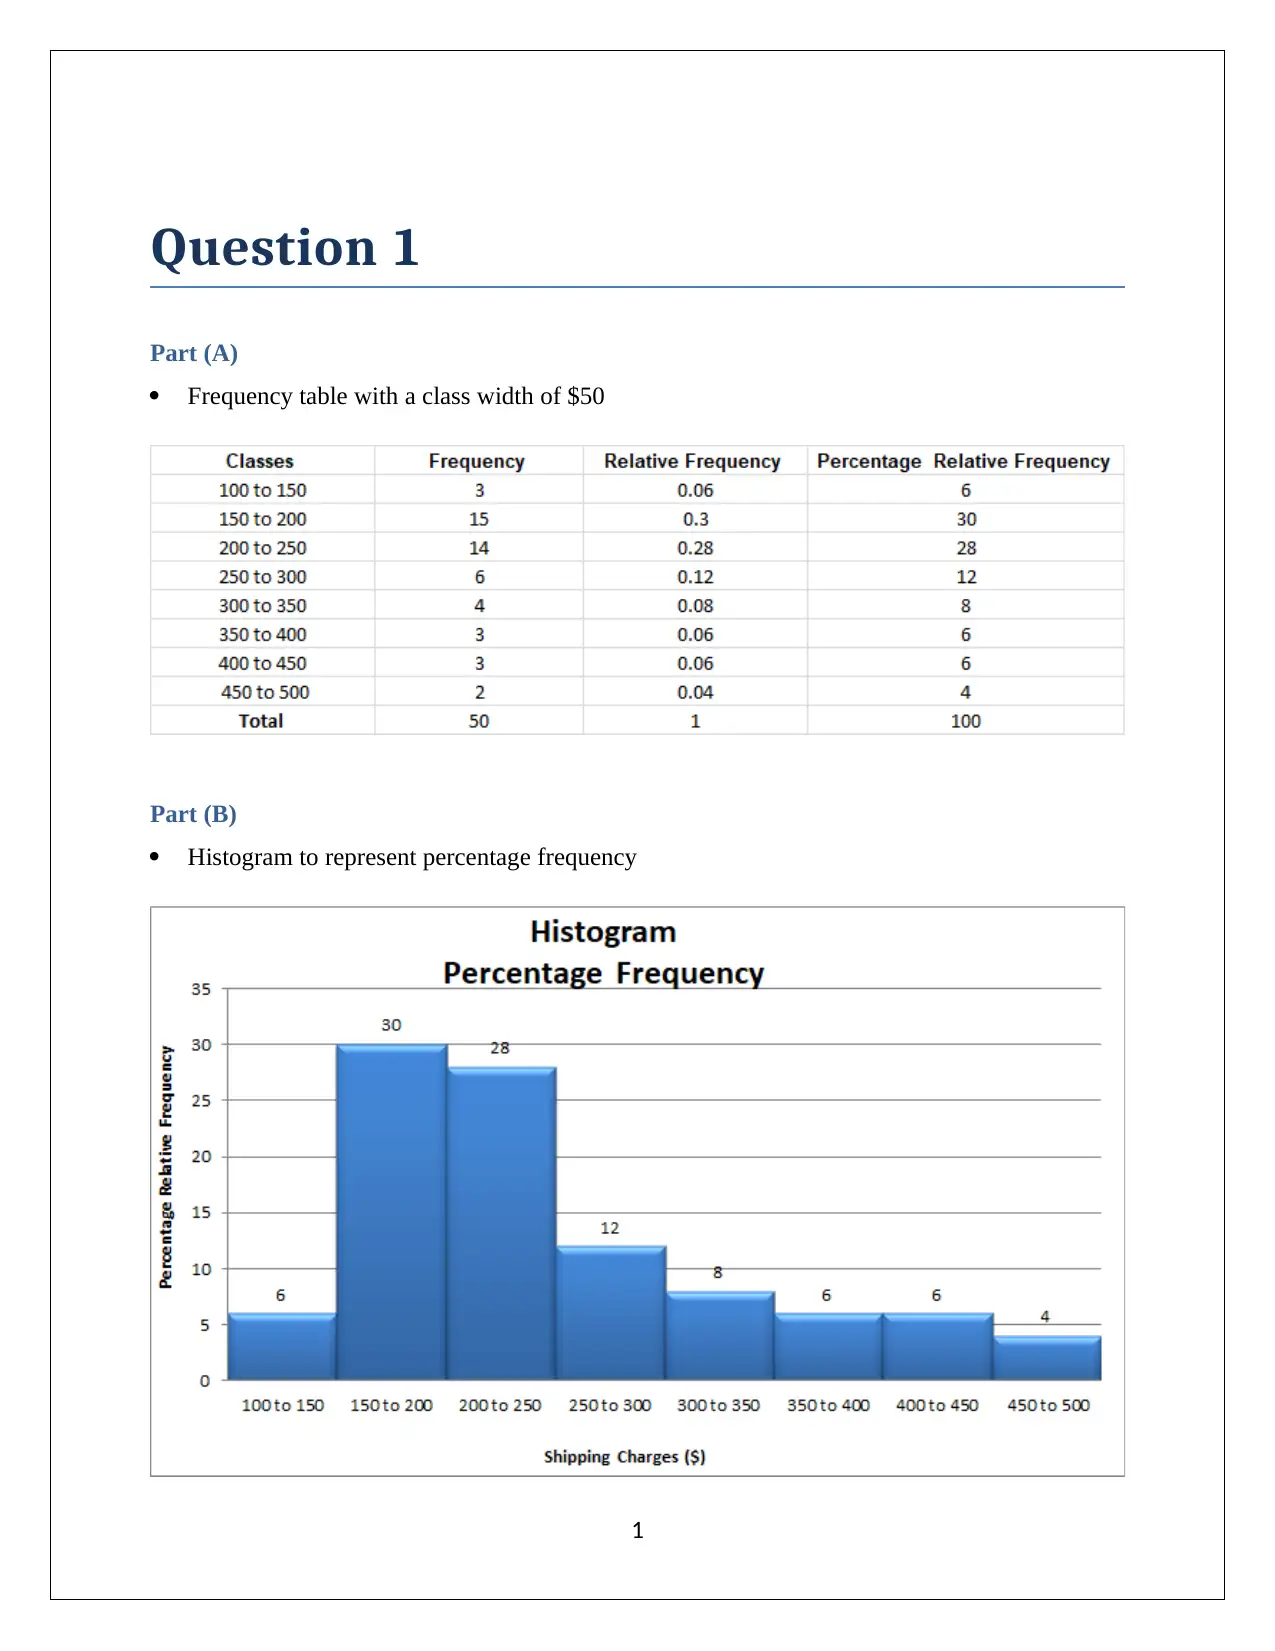
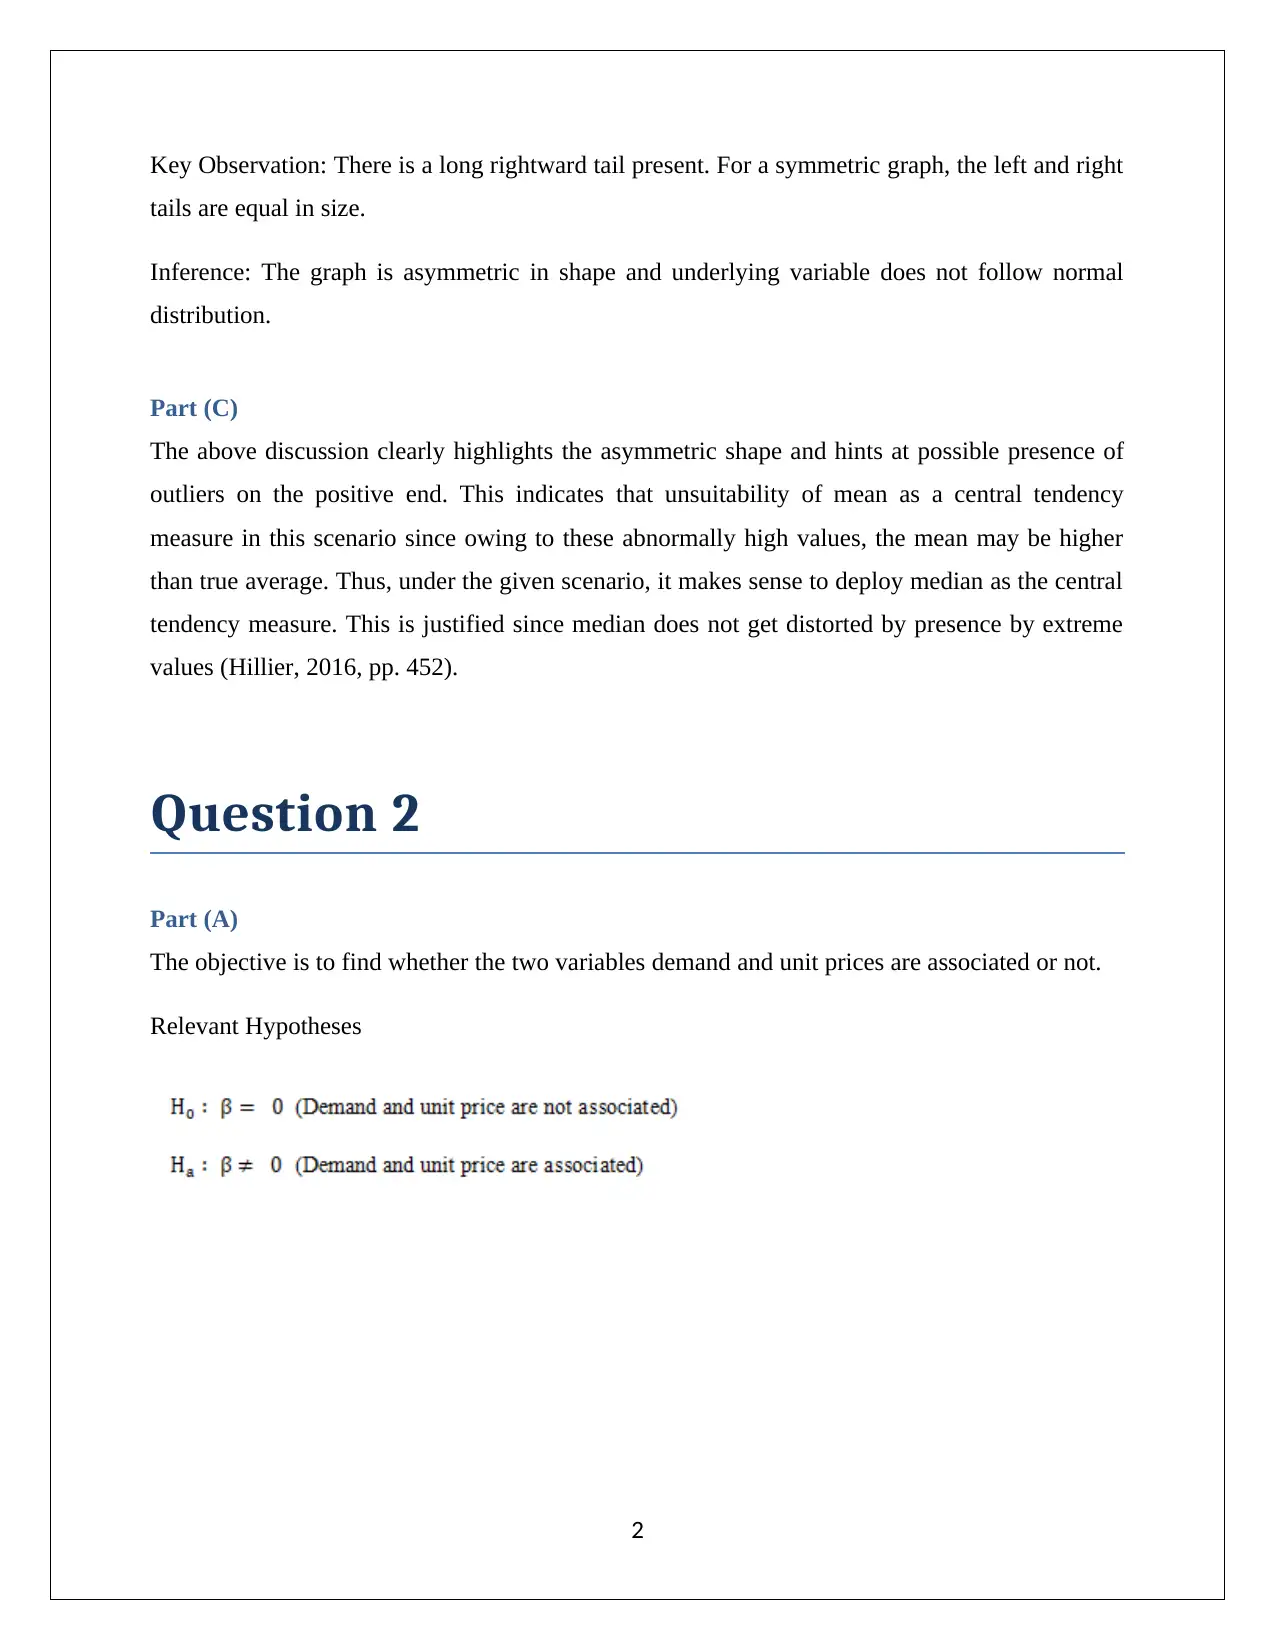
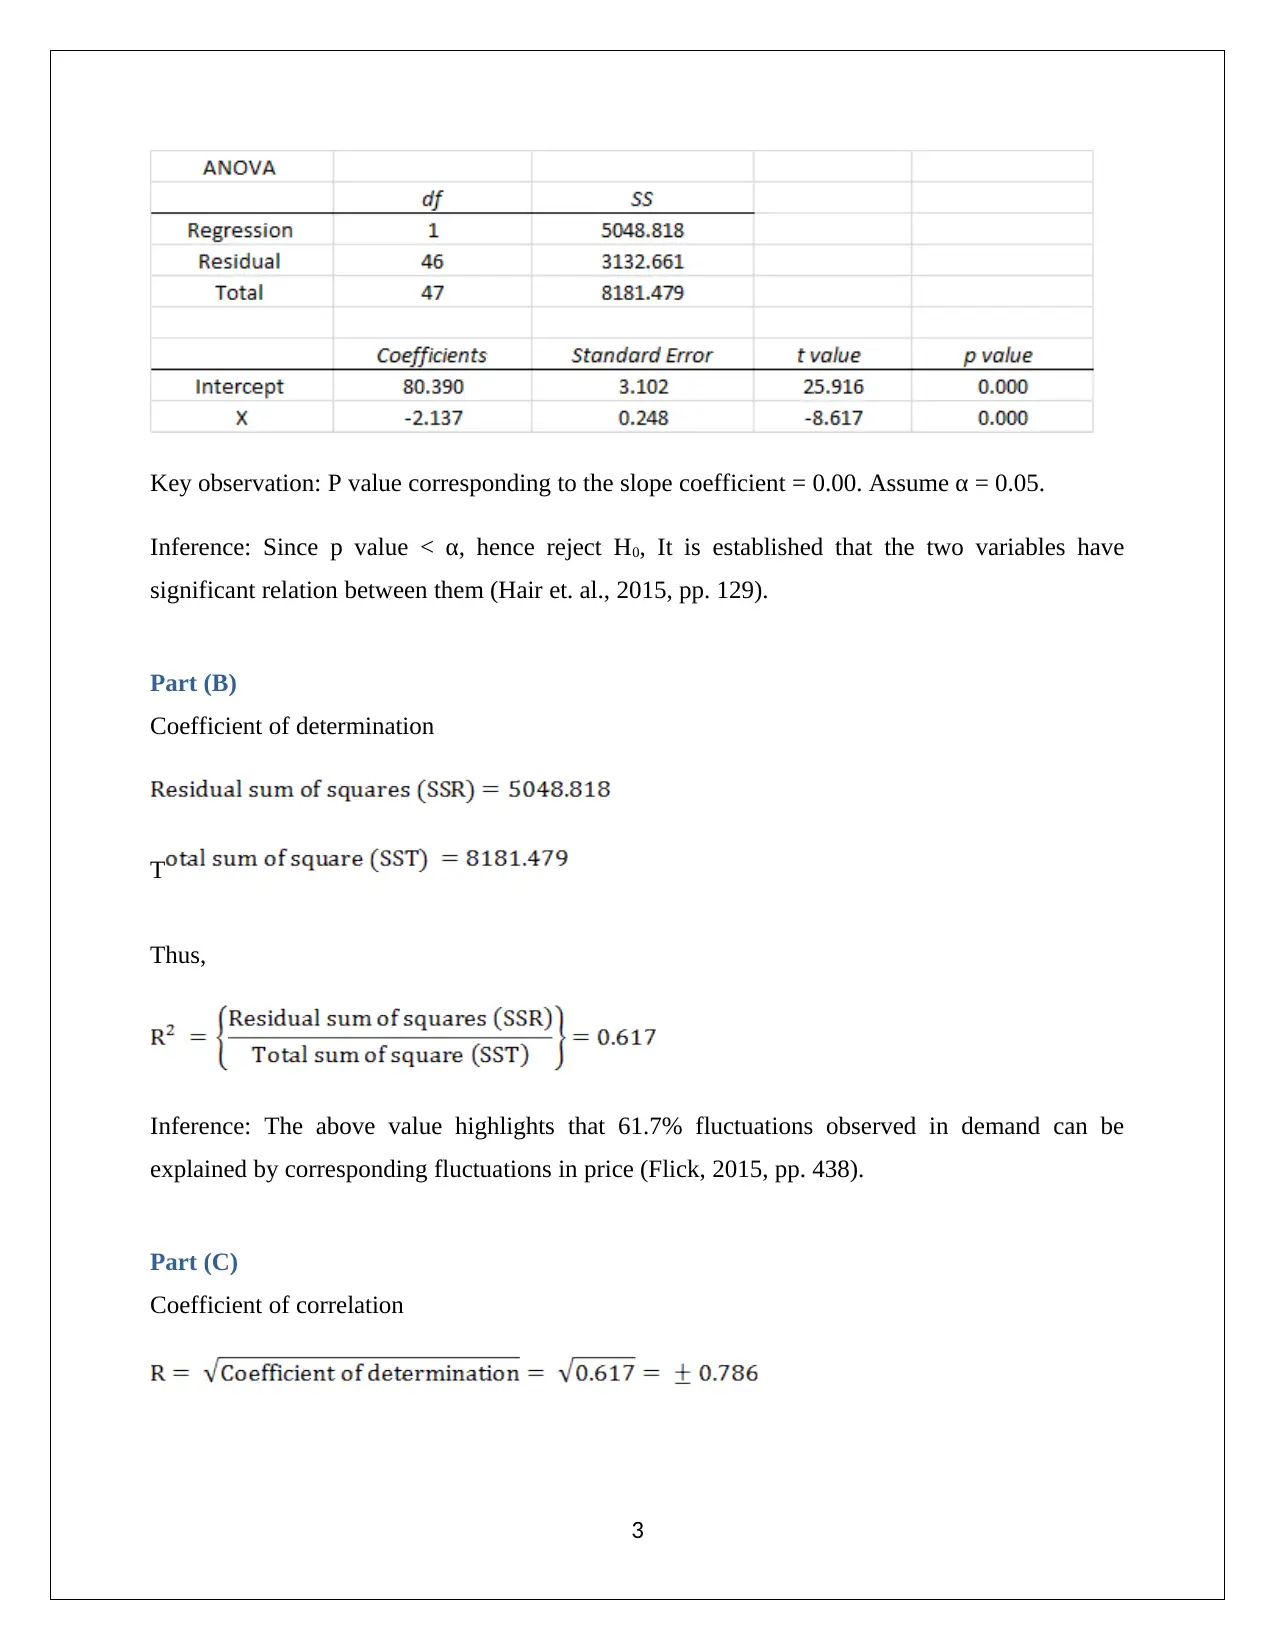
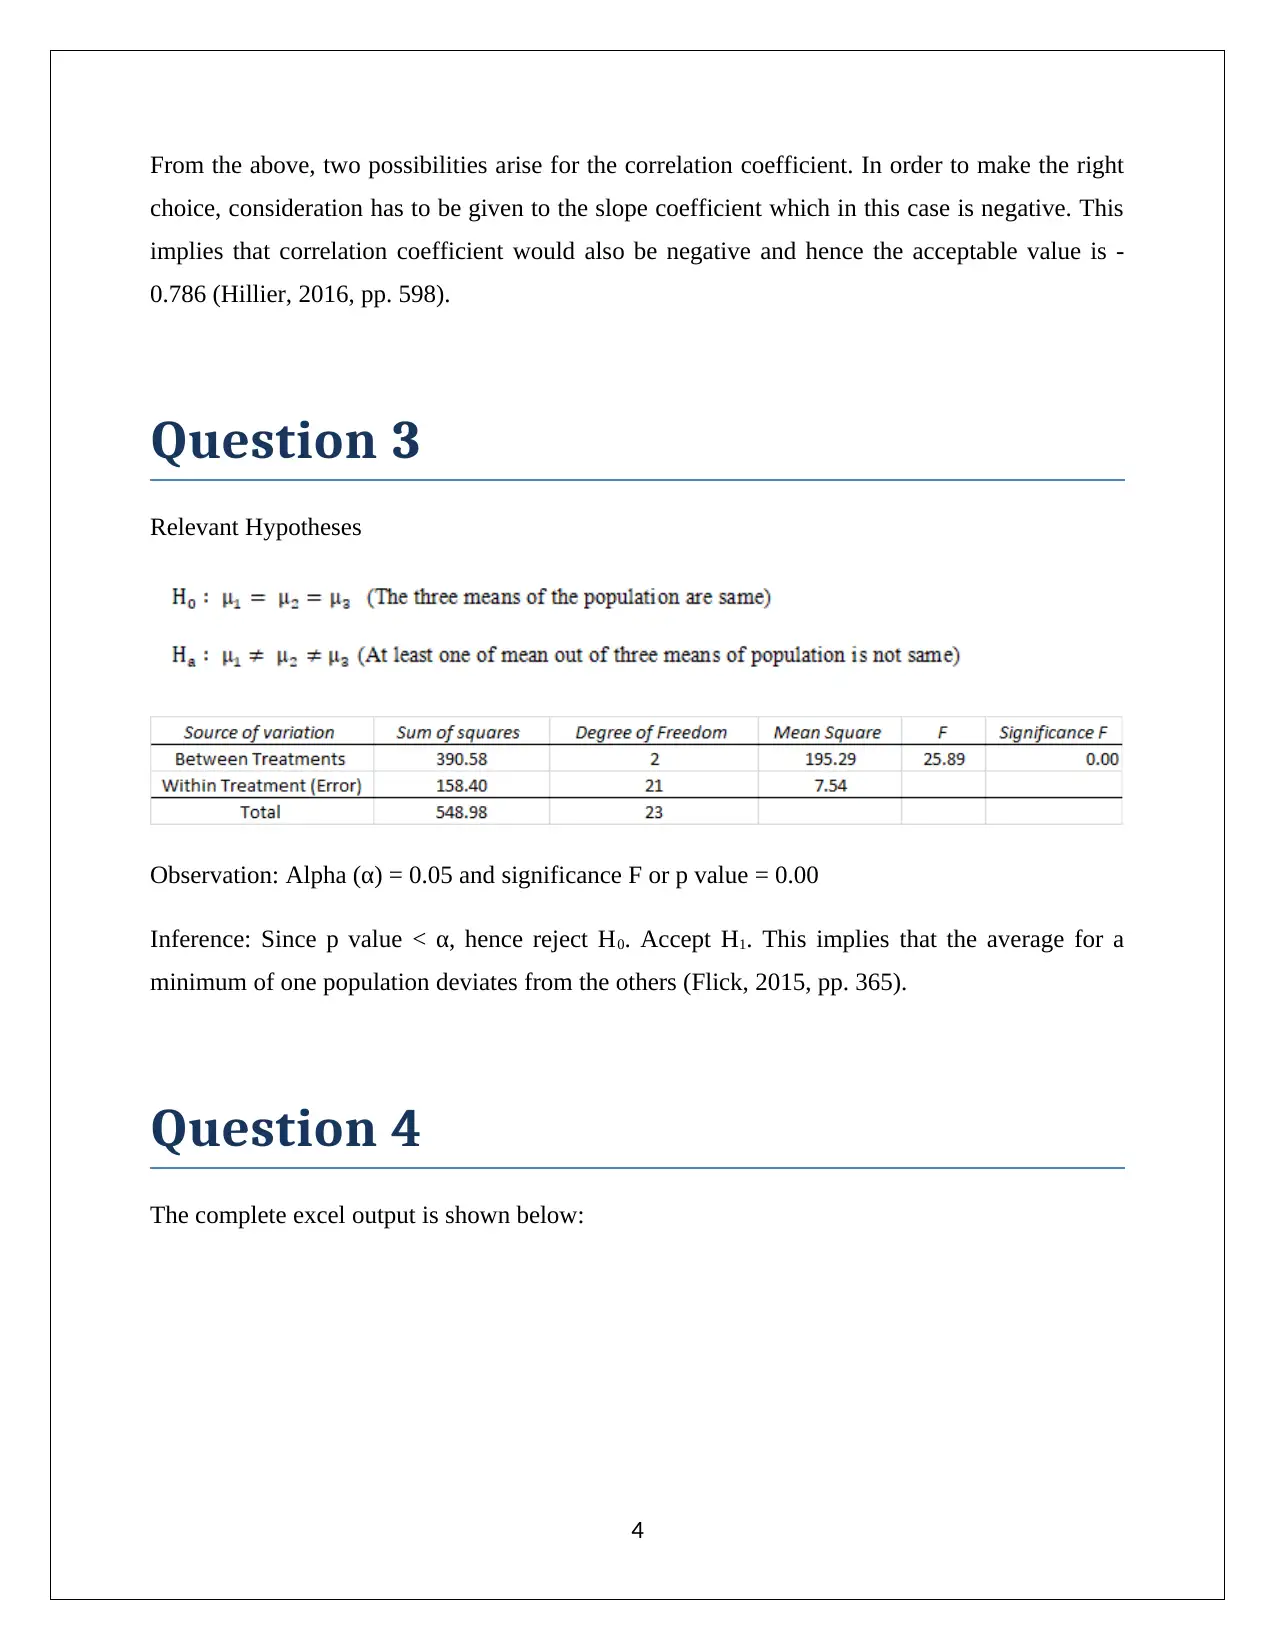
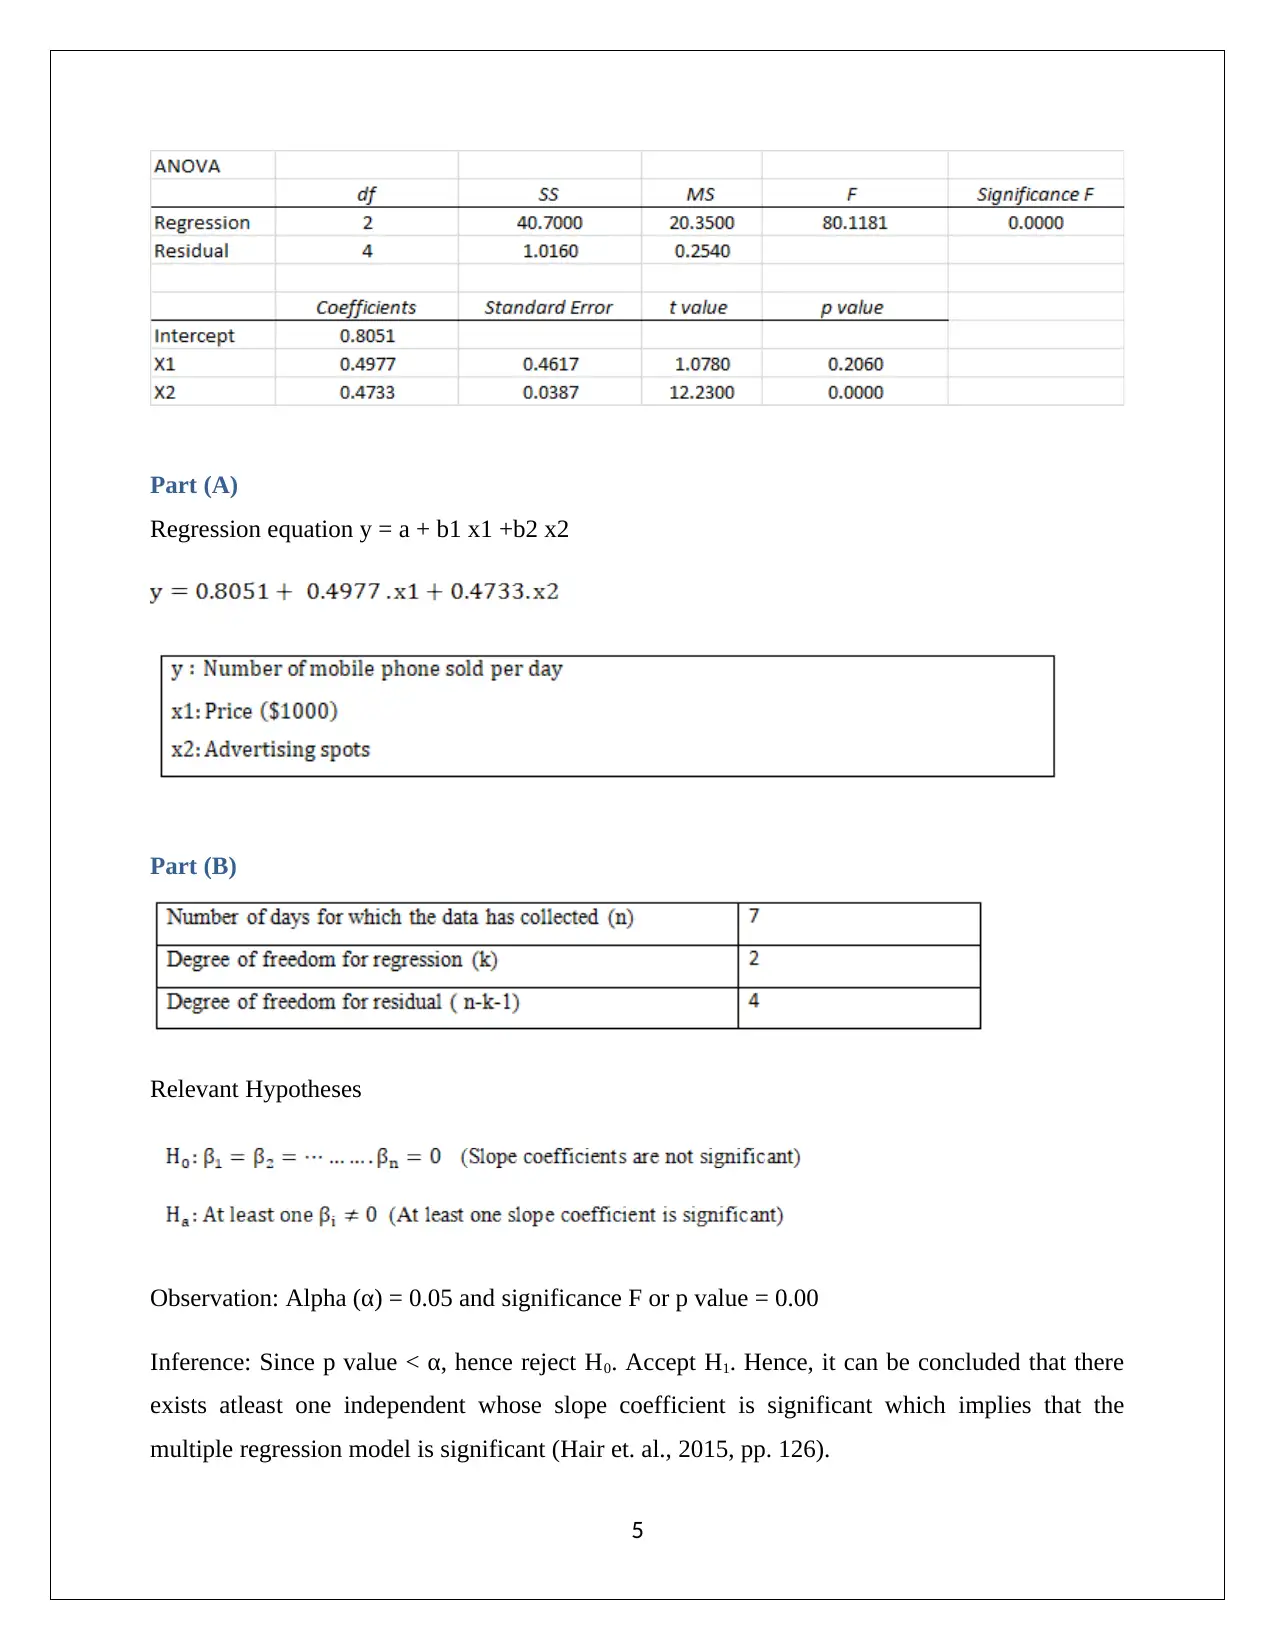
This document presents a complete solution to a statistics group assignment for the HI6007 course. It includes detailed answers to four questions, covering various statistical concepts and techniques. Question 1 involves constructing a frequency table and histogram, analyzing the shape of the distribution, and determining the appropriate measure of central tendency. Question 2 focuses on hypothesis testing to determine the relationship between demand and unit prices, calculating the coefficient of determination, and determining the correlation coefficient. Question 3 involves hypothesis testing using the ANOVA test. Question 4 involves multiple regression analysis, including the creation of a regression equation, hypothesis testing for the overall model and individual variables, interpretation of coefficients, and prediction using the model. The assignment utilizes Excel output to support the analysis, providing a comprehensive understanding of statistical methods. References from Flick, Hair, and Hillier are included to support the solution.
Document Page
STATISTICS
HI6007 GROUP ASSIGNMENT
Student Name
[Pick the date]
tabler-icon-diamond-filled.svg

Paraphrase This Document

Need a fresh take? Get an instant paraphrase of this document with our AI Paraphraser
Document Page
Question 1
Part (A)
Frequency table with a class width of $50
Part (B)
Histogram to represent percentage frequency
1
Document Page
Key Observation: There is a long rightward tail present. For a symmetric graph, the left and right
tails are equal in size.
Inference: The graph is asymmetric in shape and underlying variable does not follow normal
distribution.
Part (C)
The above discussion clearly highlights the asymmetric shape and hints at possible presence of
outliers on the positive end. This indicates that unsuitability of mean as a central tendency
measure in this scenario since owing to these abnormally high values, the mean may be higher
than true average. Thus, under the given scenario, it makes sense to deploy median as the central
tendency measure. This is justified since median does not get distorted by presence by extreme
values (Hillier, 2016, pp. 452).
Question 2
Part (A)
The objective is to find whether the two variables demand and unit prices are associated or not.
Relevant Hypotheses
2
Document Page
Key observation: P value corresponding to the slope coefficient = 0.00. Assume α = 0.05.
Inference: Since p value < α, hence reject H0, It is established that the two variables have
significant relation between them (Hair et. al., 2015, pp. 129).
Part (B)
Coefficient of determination
T
Thus,
Inference: The above value highlights that 61.7% fluctuations observed in demand can be
explained by corresponding fluctuations in price (Flick, 2015, pp. 438).
Part (C)
Coefficient of correlation
3
tabler-icon-diamond-filled.svg

Paraphrase This Document

Need a fresh take? Get an instant paraphrase of this document with our AI Paraphraser
Document Page
From the above, two possibilities arise for the correlation coefficient. In order to make the right
choice, consideration has to be given to the slope coefficient which in this case is negative. This
implies that correlation coefficient would also be negative and hence the acceptable value is -
0.786 (Hillier, 2016, pp. 598).
Question 3
Relevant Hypotheses
Observation: Alpha (α) = 0.05 and significance F or p value = 0.00
Inference: Since p value < α, hence reject H0. Accept H1. This implies that the average for a
minimum of one population deviates from the others (Flick, 2015, pp. 365).
Question 4
The complete excel output is shown below:
4
Document Page
Part (A)
Regression equation y = a + b1 x1 +b2 x2
Part (B)
Relevant Hypotheses
Observation: Alpha (α) = 0.05 and significance F or p value = 0.00
Inference: Since p value < α, hence reject H0. Accept H1. Hence, it can be concluded that there
exists atleast one independent whose slope coefficient is significant which implies that the
multiple regression model is significant (Hair et. al., 2015, pp. 126).
5
Document Page
Part (C)
Relevant hypotheses for variable mobile price x1
Relevant hypotheses for variable advertising spots x2
Observation: Alpha (α) = 0.05 and p value for slope coefficient of advertisement spots variable =
0.00
Inference: Since p value < α, hence reject H0. Accept H1. Therefore, the slope coefficient cannot
be assumed to be zero which highlights its significance (Flick, 2015, pp. 413).
Part (D)
Observation: βadvertising = 0.4733
Inferences: A unit change in the advertising spots count would lead to change in mobile sales by
0.4733 on a daily basis. Also, considering the directly proportional relationship, the change
observed in the two variables mentioned above would be unidirectional (Hillier, 2016, 279).
Part (E)
Regression equation y = a + b1 x1 +b2 x2
Hence,
6
tabler-icon-diamond-filled.svg

Paraphrase This Document

Need a fresh take? Get an instant paraphrase of this document with our AI Paraphraser
Document Page
Thus, based on the input values provided, daily mobile sales would be 9960.
References
Flick, U. (2015) Introducing research methodology: A beginner's guide to doing a research
project. 4th ed. New York: Sage Publications.
Hair, J. F., Wolfinbarger, M., Money, A. H., Samouel, P., and Page, M. J. (2015) Essentials of
business research methods. 2nd ed. New York: Routledge.
Hillier, F. (2016) Introduction to Operations Research. 6th ed. New York: McGraw Hill
Publications.
7
Document Page
8
chevron_up_icon
1 out of 9
circle_padding
hide_on_mobile
zoom_out_icon
[object Object]