Statistics for Managerial Decisions - Data Analysis and Report

Verified

Added on  2022/11/24

|10
|657
|294
Homework Assignment
AI Summary
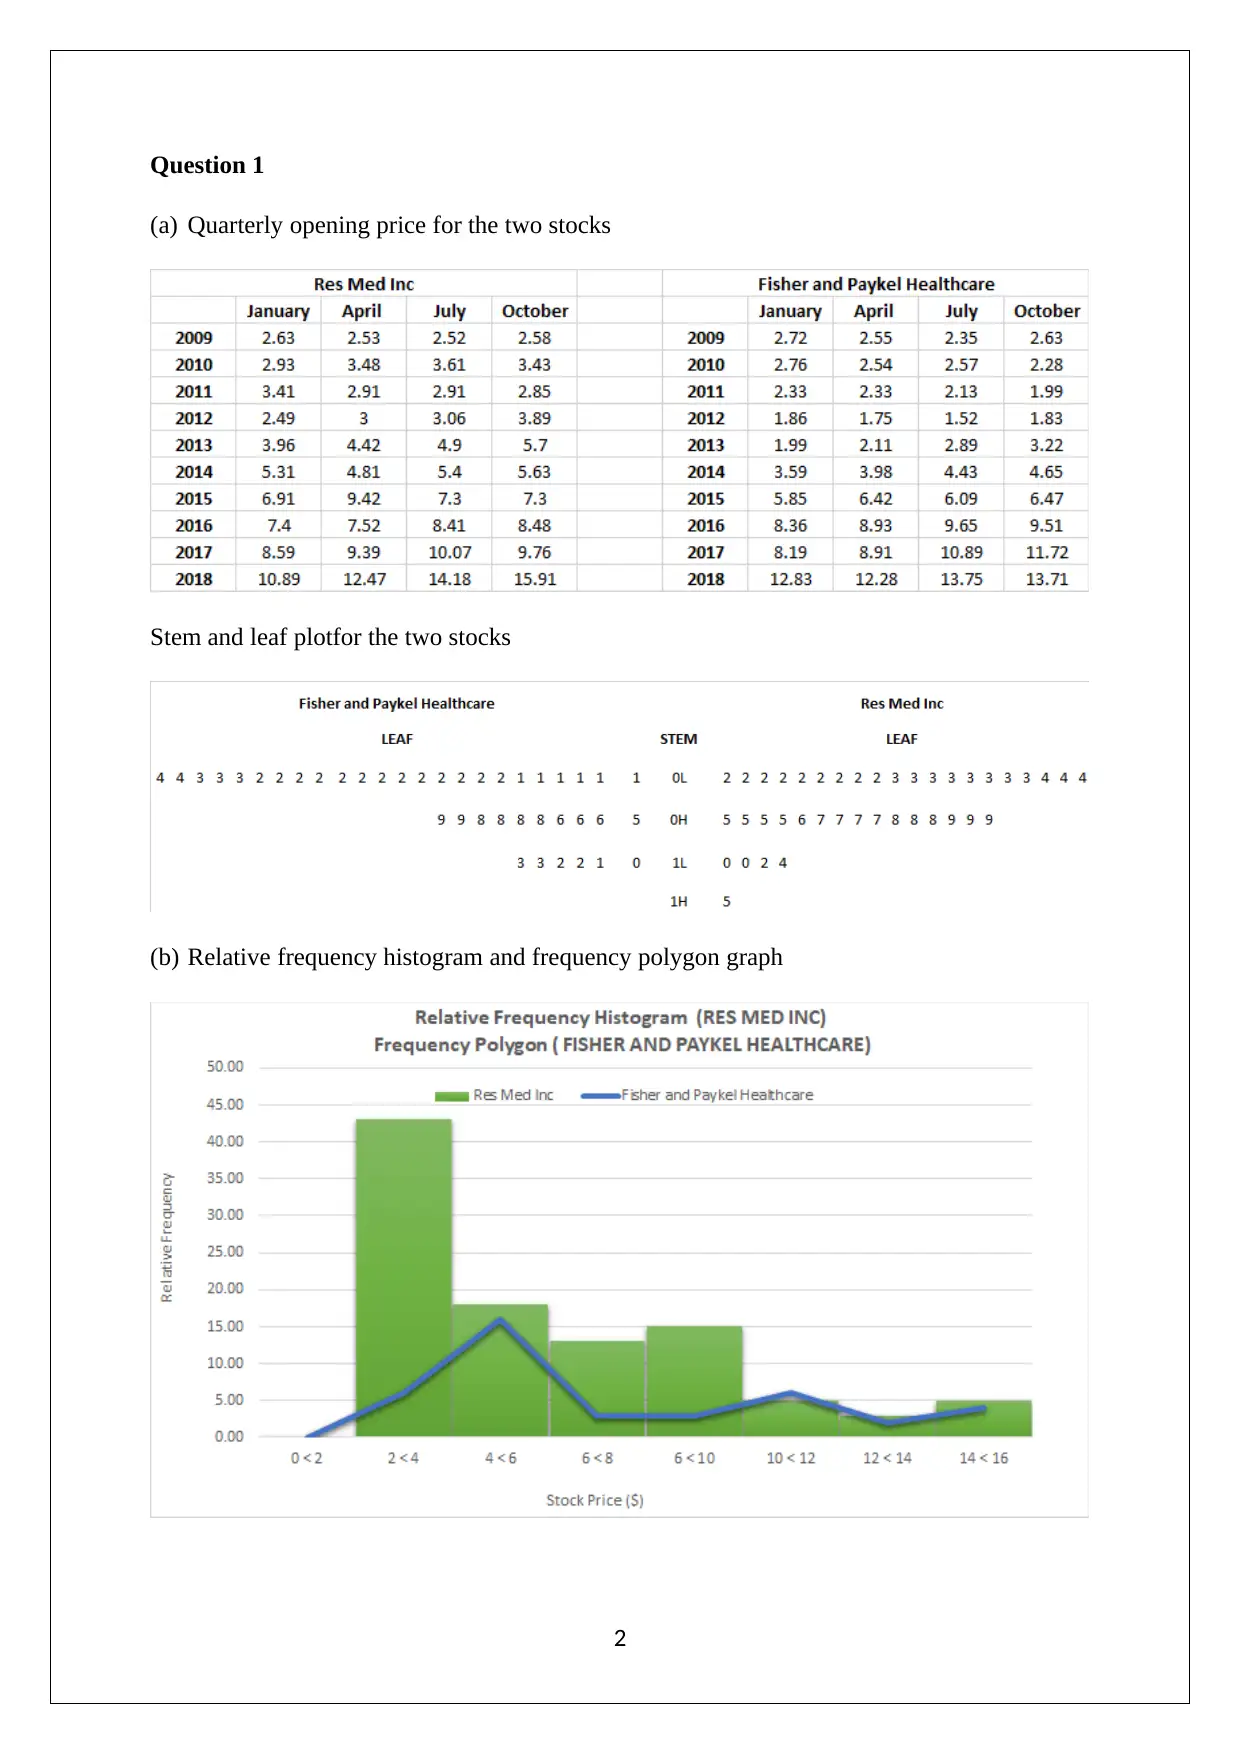
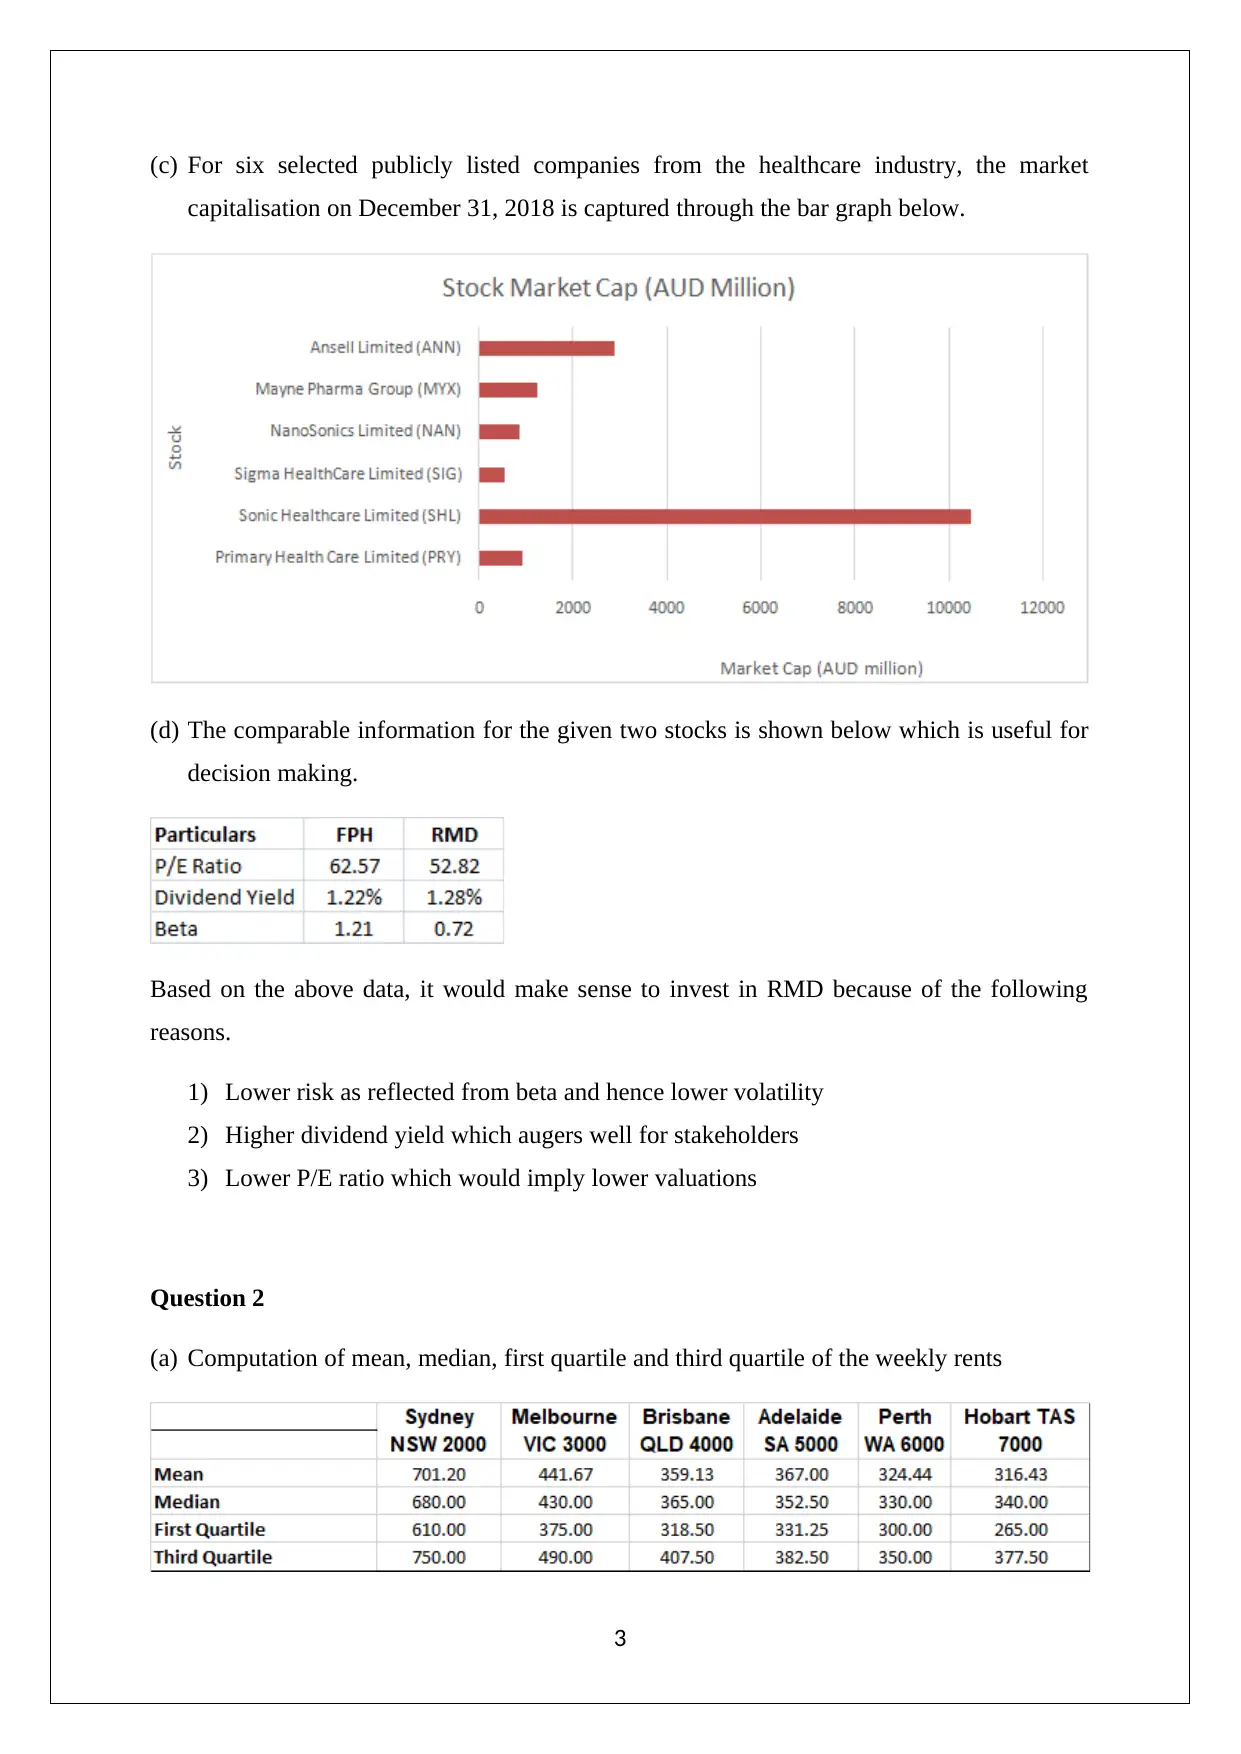
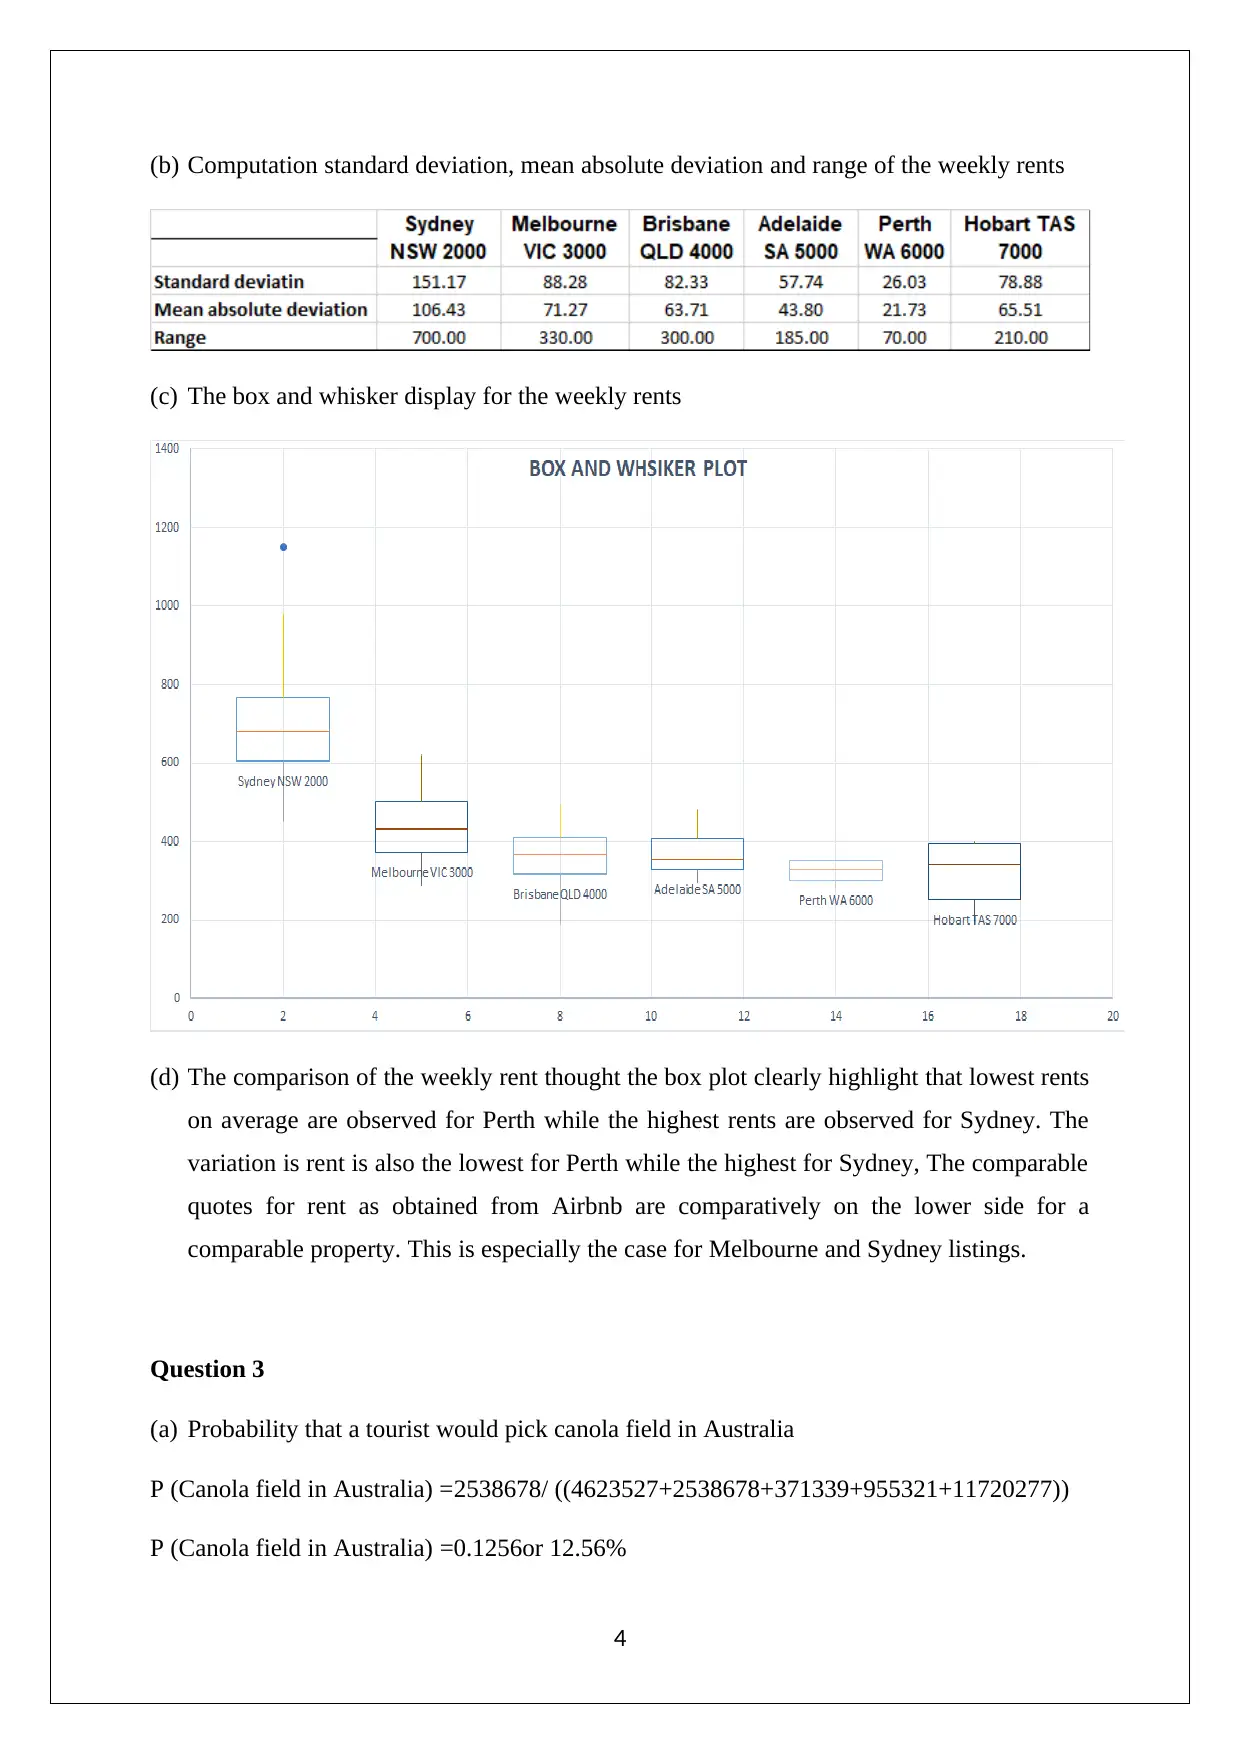
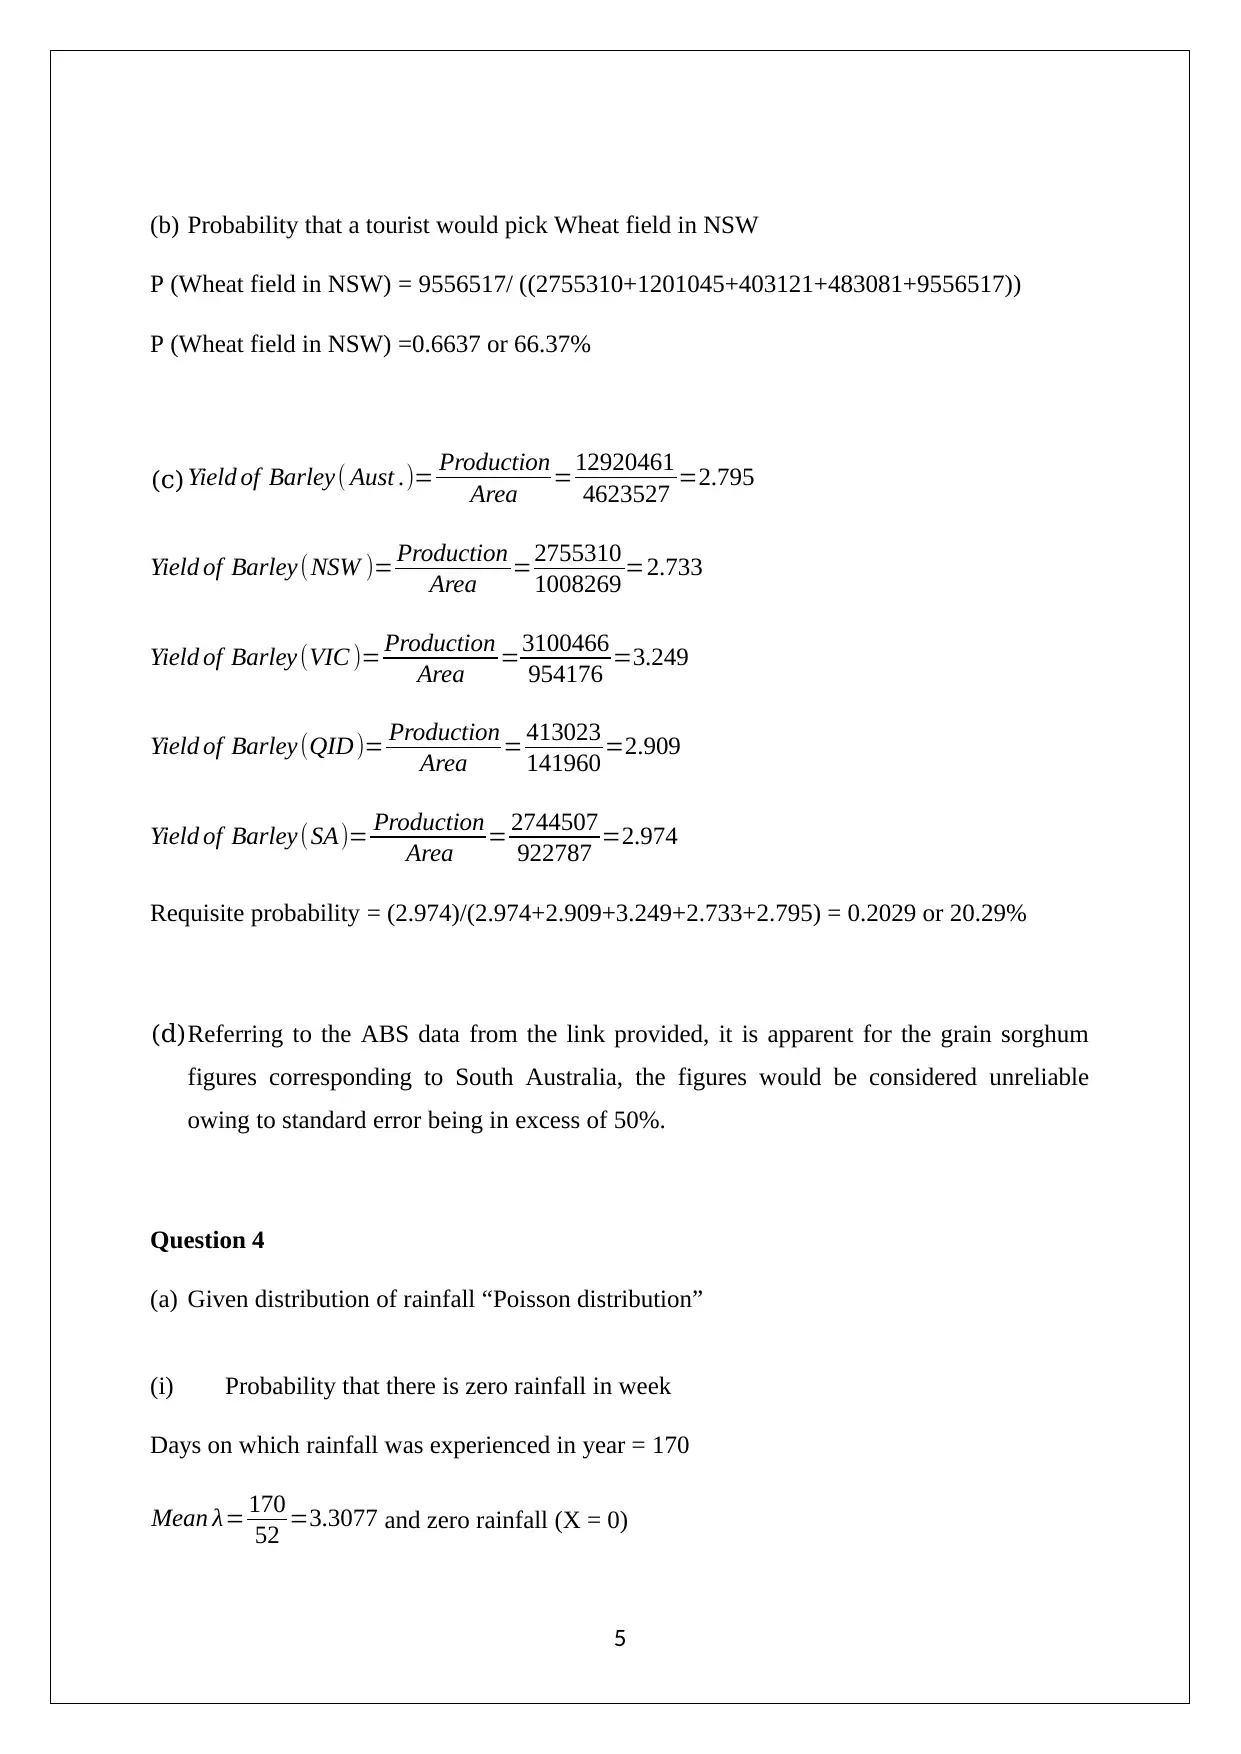
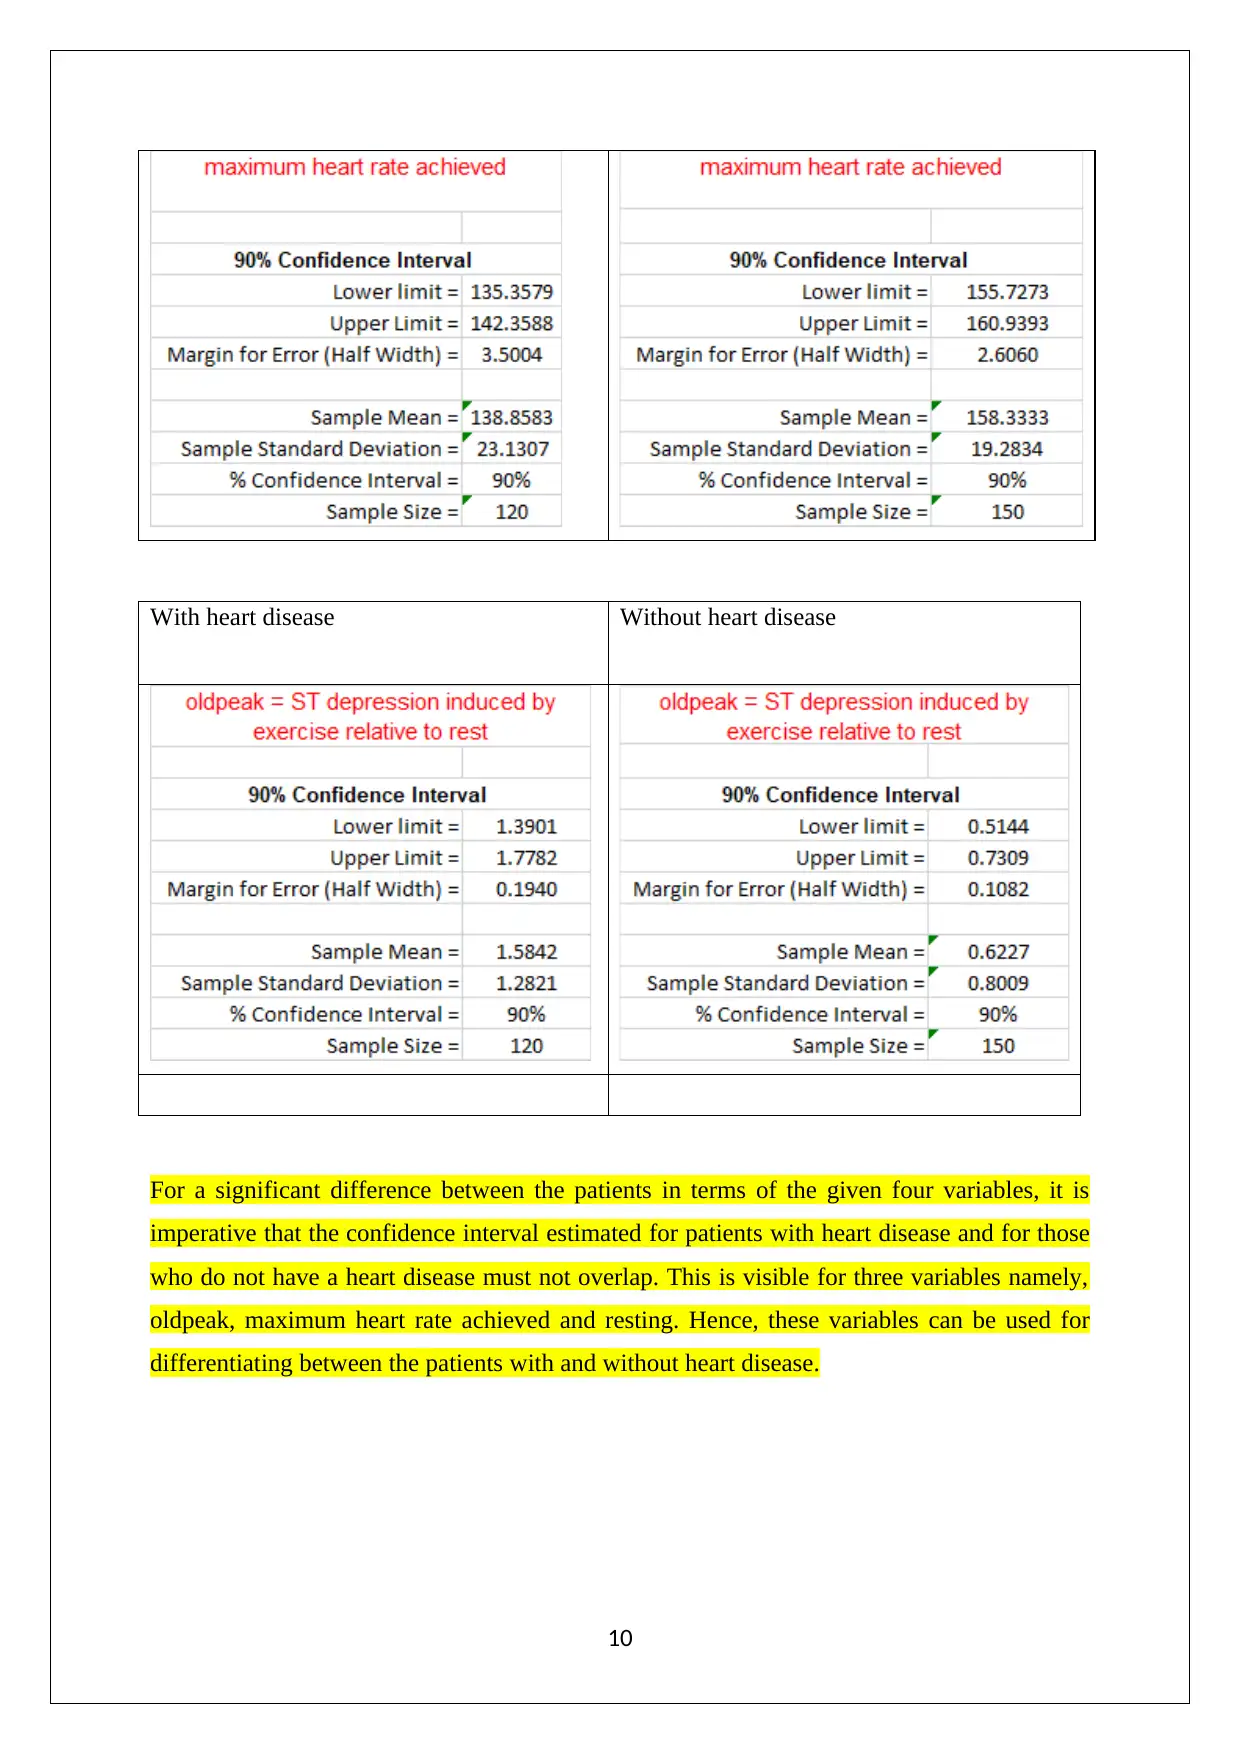
This assignment solution covers various statistical concepts relevant to managerial decisions. It includes data analysis techniques such as stem and leaf plots, relative frequency histograms, and bar graphs to analyze market capitalization data. Probability calculations are performed for different scenarios, including the probability of tourists picking canola fields and wheat fields, as well as analyzing rainfall distributions using Poisson and normal distributions. Furthermore, the assignment explores confidence intervals to differentiate between patients with and without heart disease. The solution demonstrates the application of statistical methods to real-world problems, providing a comprehensive analysis of the given data and drawing meaningful conclusions. The assignment also includes calculations of mean, median, quartiles, standard deviation, and box plots to analyze weekly rents, offering a thorough understanding of statistical concepts.
Document Page
STATISTICS FOR MANAGERIAL DECISIONS
STUDENT ID:
[Pick the date]
tabler-icon-diamond-filled.svg

Paraphrase This Document

Need a fresh take? Get an instant paraphrase of this document with our AI Paraphraser
Document Page
Question 1
(a) Quarterly opening price for the two stocks
Stem and leaf plotfor the two stocks
(b) Relative frequency histogram and frequency polygon graph
2
Document Page
(c) For six selected publicly listed companies from the healthcare industry, the market
capitalisation on December 31, 2018 is captured through the bar graph below.
(d) The comparable information for the given two stocks is shown below which is useful for
decision making.
Based on the above data, it would make sense to invest in RMD because of the following
reasons.
1) Lower risk as reflected from beta and hence lower volatility
2) Higher dividend yield which augers well for stakeholders
3) Lower P/E ratio which would imply lower valuations
Question 2
(a) Computation of mean, median, first quartile and third quartile of the weekly rents
3
Document Page
(b) Computation standard deviation, mean absolute deviation and range of the weekly rents
(c) The box and whisker display for the weekly rents
(d) The comparison of the weekly rent thought the box plot clearly highlight that lowest rents
on average are observed for Perth while the highest rents are observed for Sydney. The
variation is rent is also the lowest for Perth while the highest for Sydney, The comparable
quotes for rent as obtained from Airbnb are comparatively on the lower side for a
comparable property. This is especially the case for Melbourne and Sydney listings.
Question 3
(a) Probability that a tourist would pick canola field in Australia
P (Canola field in Australia) =2538678/ ((4623527+2538678+371339+955321+11720277))
P (Canola field in Australia) =0.1256or 12.56%
4
tabler-icon-diamond-filled.svg

Paraphrase This Document

Need a fresh take? Get an instant paraphrase of this document with our AI Paraphraser
Document Page
(b) Probability that a tourist would pick Wheat field in NSW
P (Wheat field in NSW) = 9556517/ ((2755310+1201045+403121+483081+9556517))
P (Wheat field in NSW) =0.6637 or 66.37%
(c)Yield of Barley( Aust .)= Production
Area =12920461
4623527 =2.795
Yield of Barley(NSW )= Production
Area =2755310
1008269 =2.733
Yield of Barley (VIC )= Production
Area =3100466
954176 =3.249
Yield of Barley(QID )= Production
Area = 413023
141960 =2.909
Yield of Barley(SA)= Production
Area = 2744507
922787 =2.974
Requisite probability = (2.974)/(2.974+2.909+3.249+2.733+2.795) = 0.2029 or 20.29%
(d)Referring to the ABS data from the link provided, it is apparent for the grain sorghum
figures corresponding to South Australia, the figures would be considered unreliable
owing to standard error being in excess of 50%.
Question 4
(a) Given distribution of rainfall “Poisson distribution”
(i) Probability that there is zero rainfall in week
Days on which rainfall was experienced in year = 170
Mean λ= 170
52 =3.3077 and zero rainfall (X = 0)
5
Document Page
P(X = 0 | λ= 3.3077) = 3.30770 × e3.30779
0! = 0.0366
(ii) Probability that there would be 3 orhigher than 3 days of rainfall in a week
P(X 3)
P(X 3 | λ= 3.3077) = 1 3.30773 × e3.30779
3! = 1 0.5786 = 0.4214
(b) Given distribution of rainfall Normal distribution
Mean rainfall amount per week = 83.75 mm and standard deviation = 152.74 mm
Standard error = Standard deviation
52 = 21.18
(i) Probability that rainfall will be between 10 and 50 mm
P10 < X < 50= P
10 83.75
21.18 < Z50 83.75
21.18 = PZ2 < 1.59 PZ1 < 3.48
P10 < X < 50= 0.055526 0.000249 (Normal distribution table)
P10 < X < 50= 0.055277
(ii) Rainfall amount for the case when 12% of weeks have amount or higher than the
amount
PRainfall amount > x= 125
z = NORMSINV0.12= 1.17499
Let the rainfall amount be X mm
z = X mean
Standard error ; 1.17499 = X 83.75
21.18
X = 58.86 mm
6
Document Page
Question 5
(a) The normality probability plot for the given variables is as illustrated below.
7
tabler-icon-diamond-filled.svg

Paraphrase This Document

Need a fresh take? Get an instant paraphrase of this document with our AI Paraphraser
Document Page
All the variables for which normal probability plot have been drawn tend to show a linear
pattern in their respective graph especially if some outliers are not considered. Hence, it
would be fair to conclude that all the given variables can be taken to be approximately normal
in their respective distribution.
(b) 90% confidence interval for the variables for the given two cases (With heart disease and
without heart disease)
8
Document Page
With heart disease Without heart disease
9
Document Page
With heart disease Without heart disease
For a significant difference between the patients in terms of the given four variables, it is
imperative that the confidence interval estimated for patients with heart disease and for those
who do not have a heart disease must not overlap. This is visible for three variables namely,
oldpeak, maximum heart rate achieved and resting. Hence, these variables can be used for
differentiating between the patients with and without heart disease.
10
chevron_up_icon
1 out of 10
circle_padding
hide_on_mobile
zoom_out_icon
[object Object]