Comprehensive Statistics Assignment: Data Analysis and Probability

Verified

Added on  2023/04/22

|15
|1444
|214
Homework Assignment
AI Summary
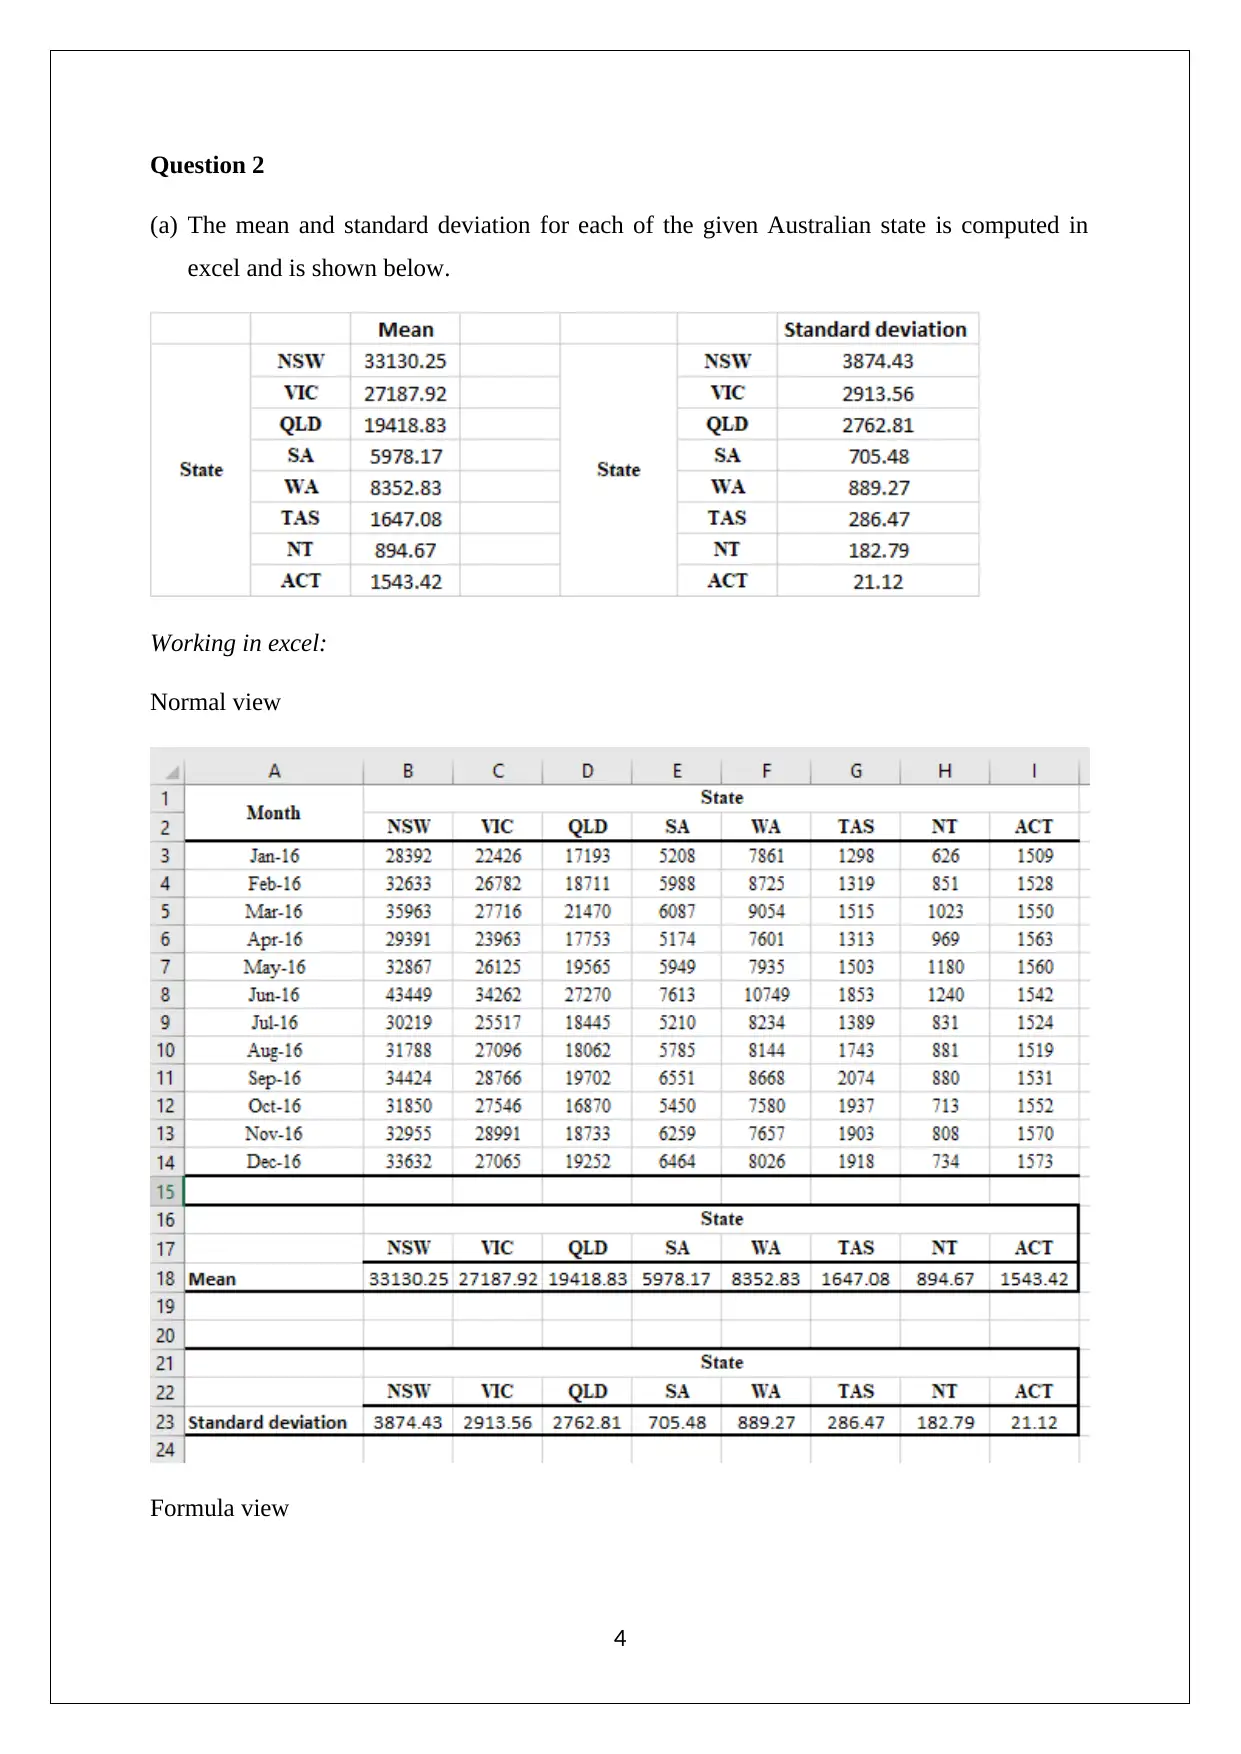
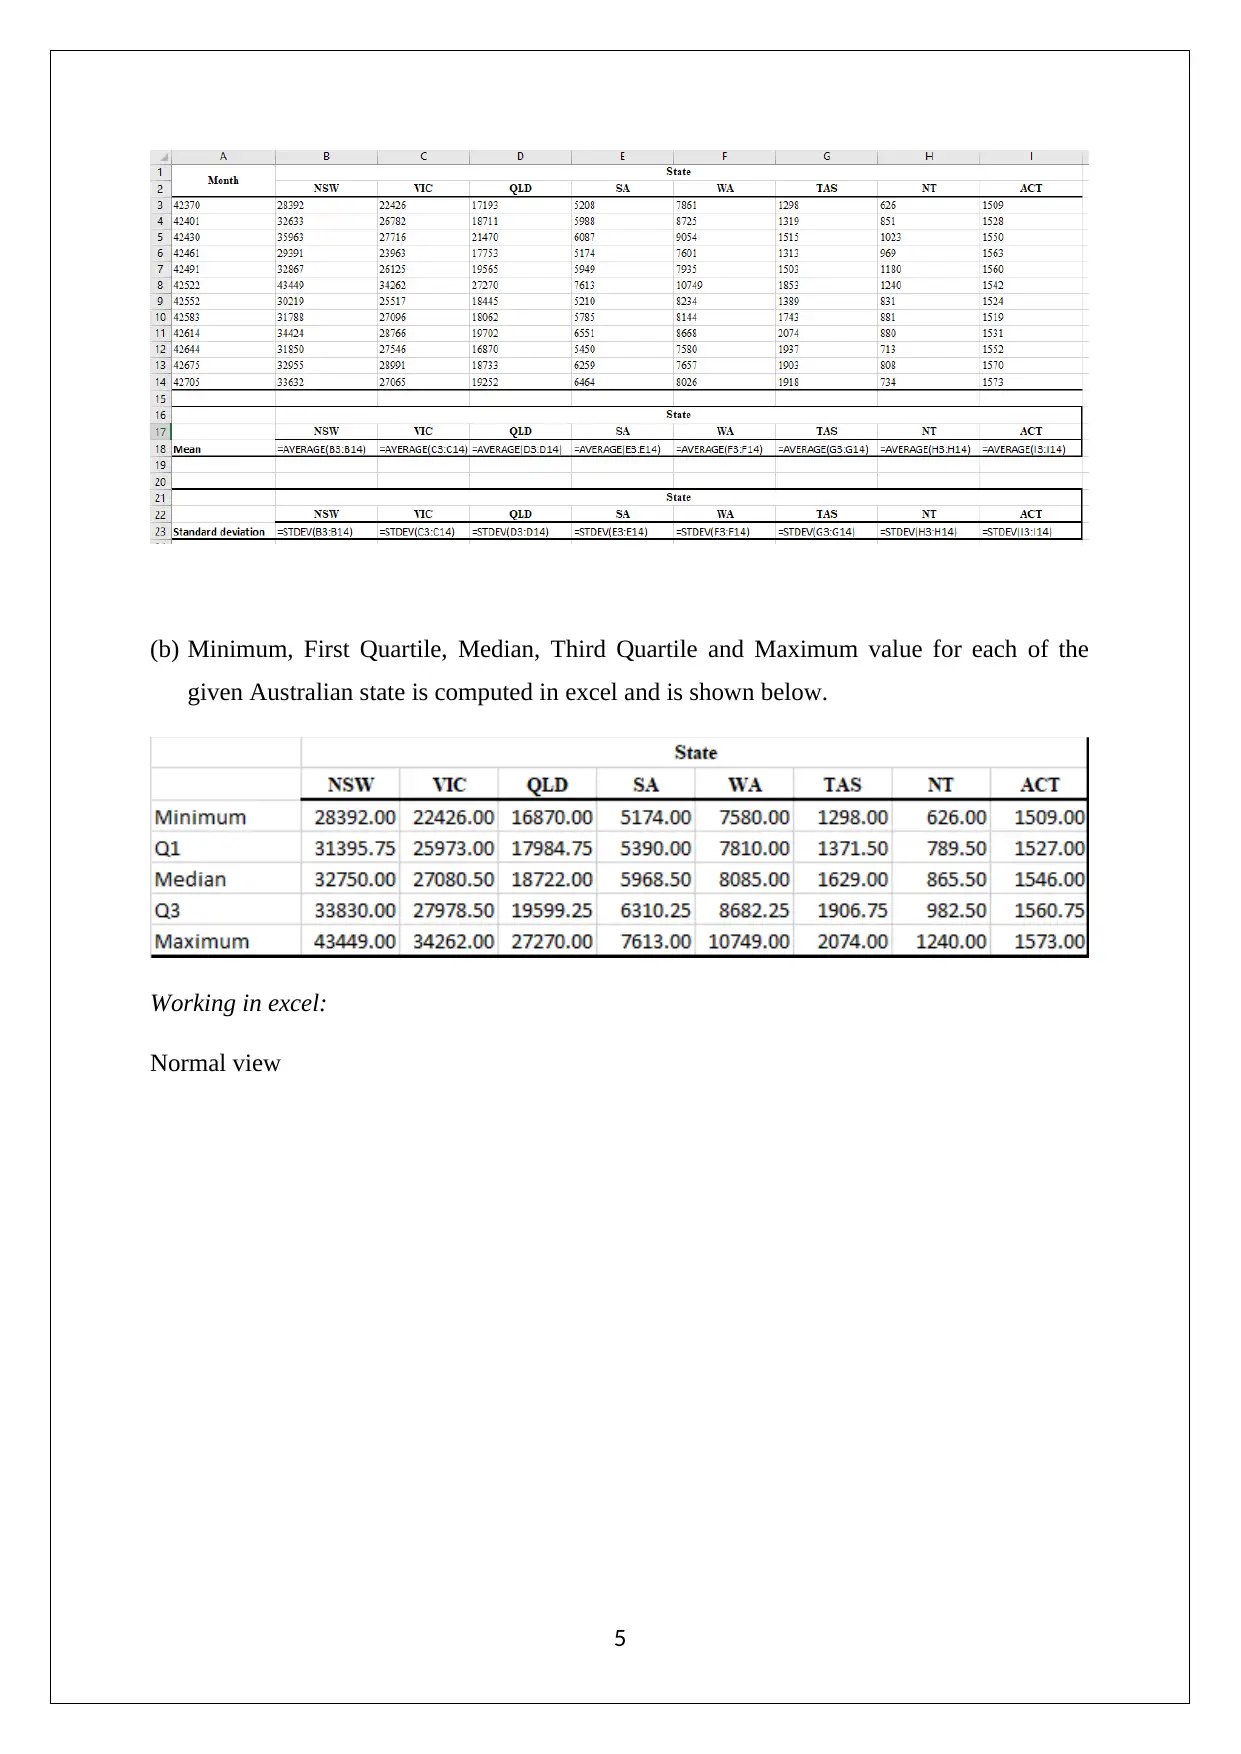
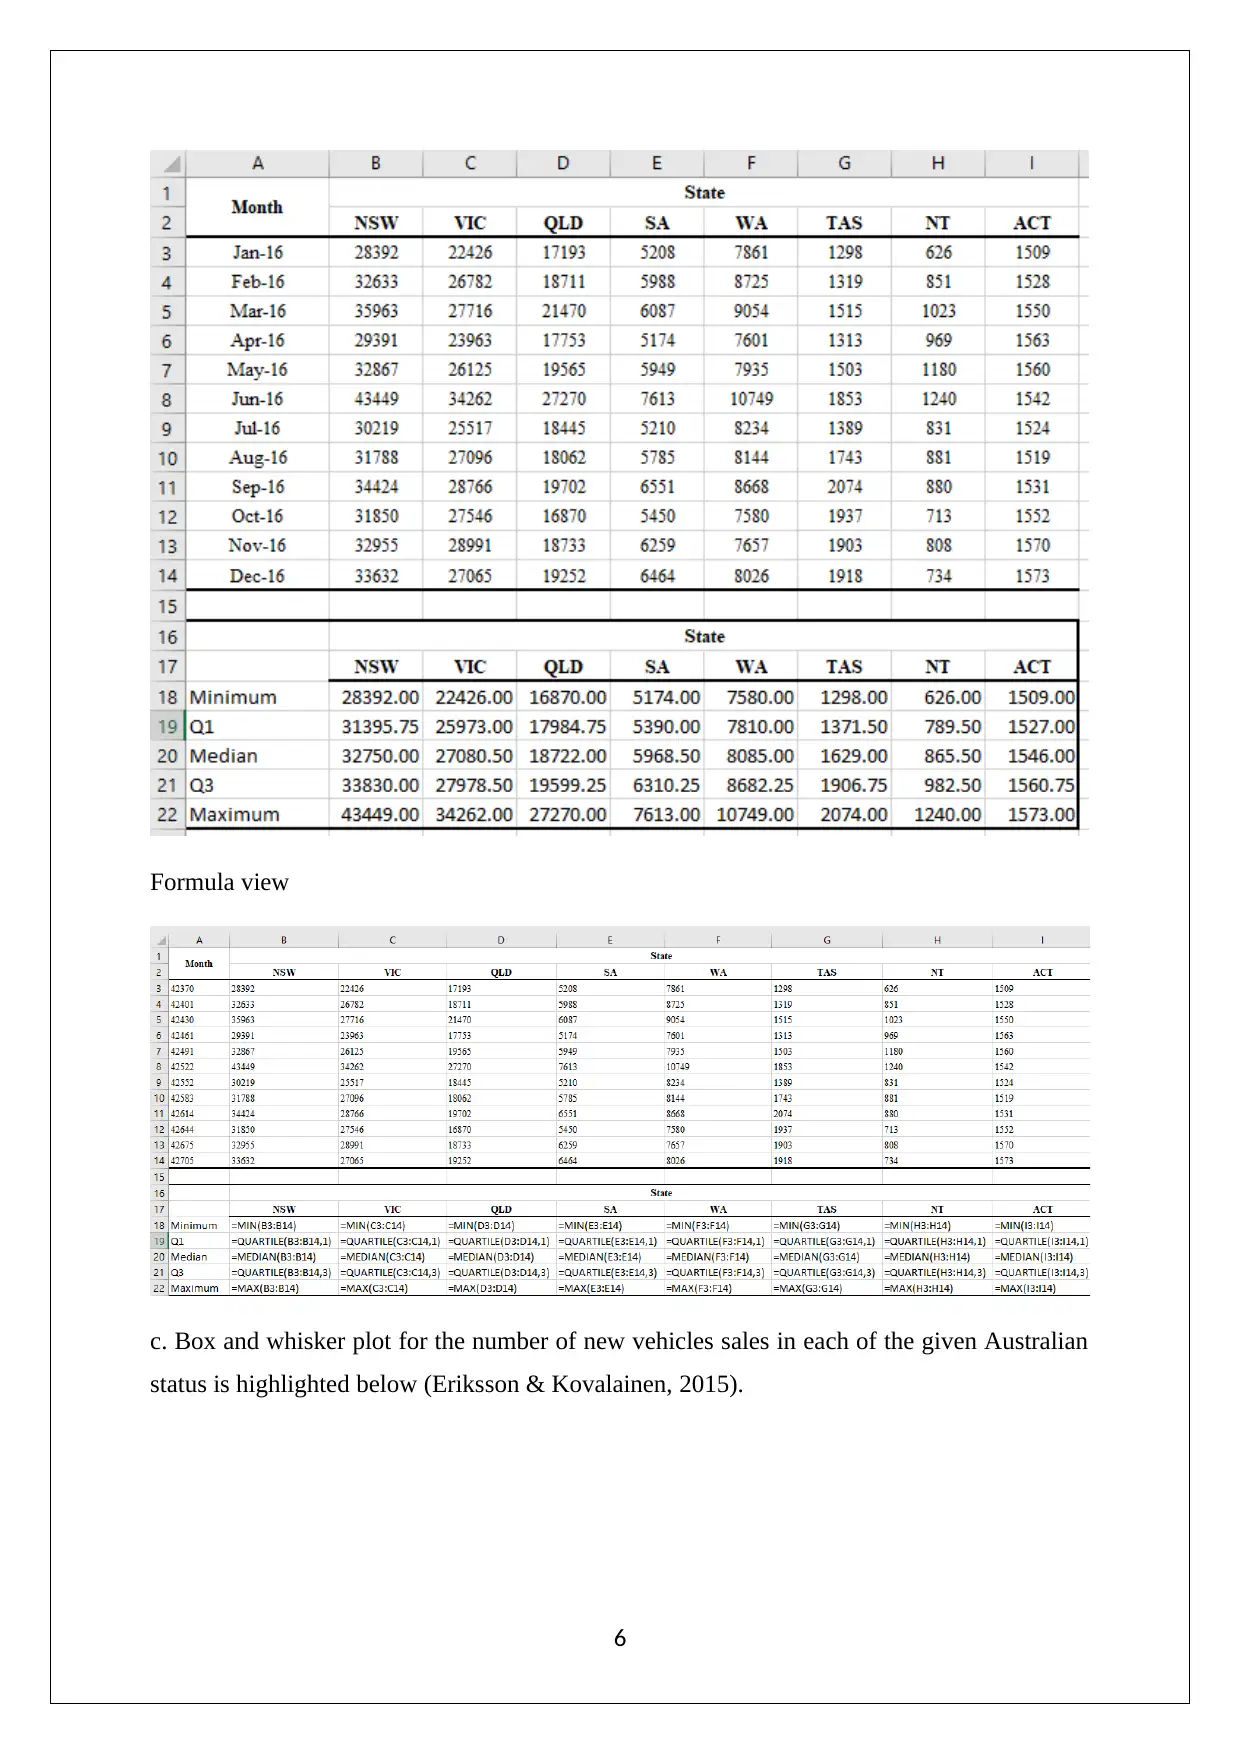
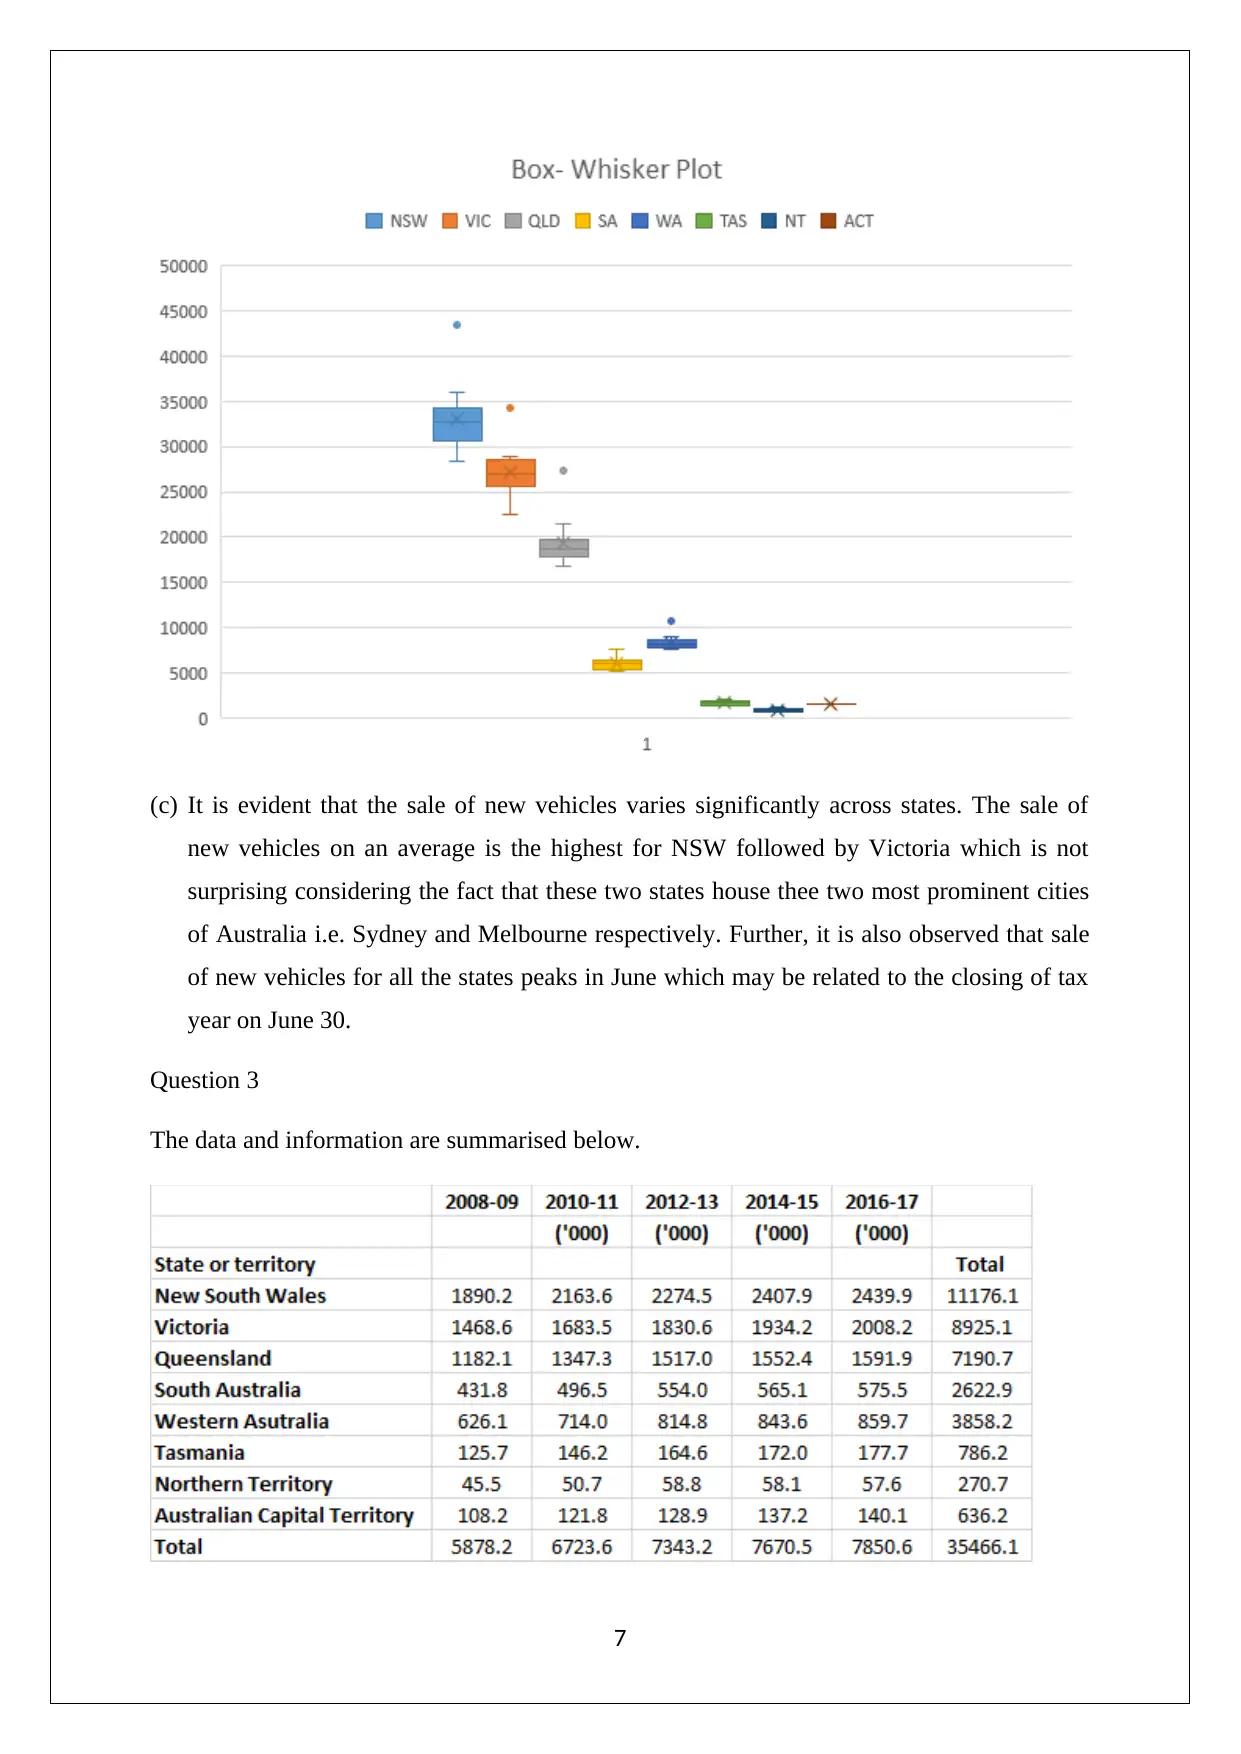
This statistics assignment solution covers a range of topics including descriptive statistics, probability, hypothesis testing, and confidence intervals. The first question involves analyzing quarterly opening prices for National Australia Bank (NAB) and Westpac Banking Corporation (WBC) using stem and leaf plots, relative frequency histograms, and bar graphs, concluding with a recommendation to buy NAB based on analyst ratings. Question 2 focuses on computing mean, standard deviation, minimum, quartiles, and maximum values for new vehicle sales across Australian states, visualized with box and whisker plots. Question 3 calculates various probabilities related to household demographics and internet access. Question 4 addresses normal and uniform distributions, including calculating probabilities and z-values. Finally, Question 5 covers binomial distribution approximation, hypothesis testing for proportions, and confidence interval estimation. This solved assignment is available on Desklib, a platform offering a wide range of study resources for students.
Document Page
STATISICS
[Document subtitle]
[DATE]
tabler-icon-diamond-filled.svg

Paraphrase This Document

Need a fresh take? Get an instant paraphrase of this document with our AI Paraphraser
Document Page
Question 1
(a) Quarterly opening price values for National Australia Bank and Westpac Banking
Corporation is highlighted below.
Stem and leaf plot
Right leaf: NAB quarterly opening price
Left leaf: WBC quarterly opening price
(b) Relative frequency histogram for NAB and frequency polygon for WBC is shown below.
1
Document Page
(c) The requisite bar graph highlighting the total assets is illustrated below.
(d) The mean rating for analysts on WBC is summarised below.
2
Document Page
Source: https://www.reuters.com/finance/stocks/analyst/WBC.AX
The mean rating for analysts on NAB is summarised below.
Source: https://www.reuters.com/finance/stocks/analyst/NAB.AX
Based on the above comparison, it is apparent that one should buy NAB as the mean rating of
NAB is comparatively better in comparison to WBC and is close to outperform.
3
tabler-icon-diamond-filled.svg

Paraphrase This Document

Need a fresh take? Get an instant paraphrase of this document with our AI Paraphraser
Document Page
Question 2
(a) The mean and standard deviation for each of the given Australian state is computed in
excel and is shown below.
Working in excel:
Normal view
Formula view
4
Document Page
(b) Minimum, First Quartile, Median, Third Quartile and Maximum value for each of the
given Australian state is computed in excel and is shown below.
Working in excel:
Normal view
5
Document Page
Formula view
c. Box and whisker plot for the number of new vehicles sales in each of the given Australian
status is highlighted below (Eriksson & Kovalainen, 2015).
6
tabler-icon-diamond-filled.svg

Paraphrase This Document

Need a fresh take? Get an instant paraphrase of this document with our AI Paraphraser
Document Page
(c) It is evident that the sale of new vehicles varies significantly across states. The sale of
new vehicles on an average is the highest for NSW followed by Victoria which is not
surprising considering the fact that these two states house thee two most prominent cities
of Australia i.e. Sydney and Melbourne respectively. Further, it is also observed that sale
of new vehicles for all the states peaks in June which may be related to the closing of tax
year on June 30.
Question 3
The data and information are summarised below.
7
Document Page
a. Probability that a randomly selected household lives in Victoria (Eriksson & Kovalainen,
2015).
¿ 8925.10
35466.1 =0.252
b. Probability that a randomly selected household lives in Tasmania and has an internal
access in 2010-11
¿ 146.2
6723.6 =0.022
c. Probability that a randomly selected household has an internal access in 2012-13, and
lives in New South Wales
¿ 2274.5
35466.1=0.064
d. Probability that a randomly selected household has an internet access in 2010-11 or 2012-
13.
¿ 6723.6+7343.2
35466.1 =0.397
Question 4
a) Mean arrival time of the bus = 73 minutes
Standard deviation of arrival time = 8 minutes
Let the time that the upper 5% of the time exceeds be X
If 5% of the values exceed X, then cumulative probability corresponding to X is 0.95. Using
normal distribution tables, the corresponding z value for the above cumulative probability
would be 1.6448 (Hillier, 2016).
The z value can be computed using the following formula (Taylor & Cihon, 2016).
Z = (X-Mean)/ Standard Deviation
Hence, 1.6448 = (X-73)/8
Solving the above, we get X = 86.16 minutes
8
Document Page
b) There is uniform variation of temperature between 12 degree Celsius and 25 degree
Celsius. Hence, it may be concluded that 100% of the temperature values are located within
13 degree Celsius of the lower value 12 degree Celsius. 21 degree Celsius is 9 degree greater
than the lower end of the range.
13 degree Celsius contains 100% values
1 degree Celsius would contain (100/13)% values
7 degree Celsius would contain (100*7/13) % or 53.846% values
Hence, the probability that temperature is lower than 21 degree Celsius is 0.5385
c) (i) Since there is no special ability to distinguish, hence the expected probability to
distinguish = 0.5
Further, the standard error for the proportion is estimated below.
Z value = (0.65-0.5)/0.0353 = 4.249
P(Z ≤4.249) = 0.999989 (Using Excel Function NORM.S.Dist)
Hence, P (Z>4.4249) = 1- P(Z ≤4.249) = 1- 0.999989 = 0.00001
Thus, the probability that more than 65% of the respondents would be able to distinguish
correctly is 0.00001.
b) The requisite computations are shown below.
9
tabler-icon-diamond-filled.svg

Paraphrase This Document

Need a fresh take? Get an instant paraphrase of this document with our AI Paraphraser
Document Page
The respective probabilities required above are computed using Excel as indicated below.
Hence, the requisite probability is 0.498 (after rounding off).
Question 5
(a) Probability of success p = 0.70
Number of trials = 500
Normal approximation of the binomial distribution is derived below
Mean = n p = 500 * 0.7 = 350
Standard deviation ¿ npq= np ( 1 p ) = 5000.7( 10.7 ) =10.2469
Probability of succeeding clinical trials between 280 and 355 times =?
Now,
Probability of succeeding clinical trials between 280 and 355 would be the blue area under
the curve (Fehr, & Grossman, 2016).
10
Document Page
From standard normal distribution table
Hence, there is a 0.6879 probability of succeeding clinical trials between 280 and 355 times.
(b) Total number of travellers = 500
Number of travellers who have cancelled their airlines booking = 210
Level of significance = 0.01
Claim: Proportion of travellers who select their flights and then cancel their bookings is less
than 0.50.
1) Null and alternative hypotheses
Null hypothesis H0 : p 0.50
Alternative hypothesis Ha : p<0.50
11
chevron_up_icon
1 out of 15
circle_padding
hide_on_mobile
zoom_out_icon
[object Object]