Statistics Group Project: Data Analysis of Student Performance
VerifiedAdded on  2020/12/18
|17
|3134
|119
Project
AI Summary
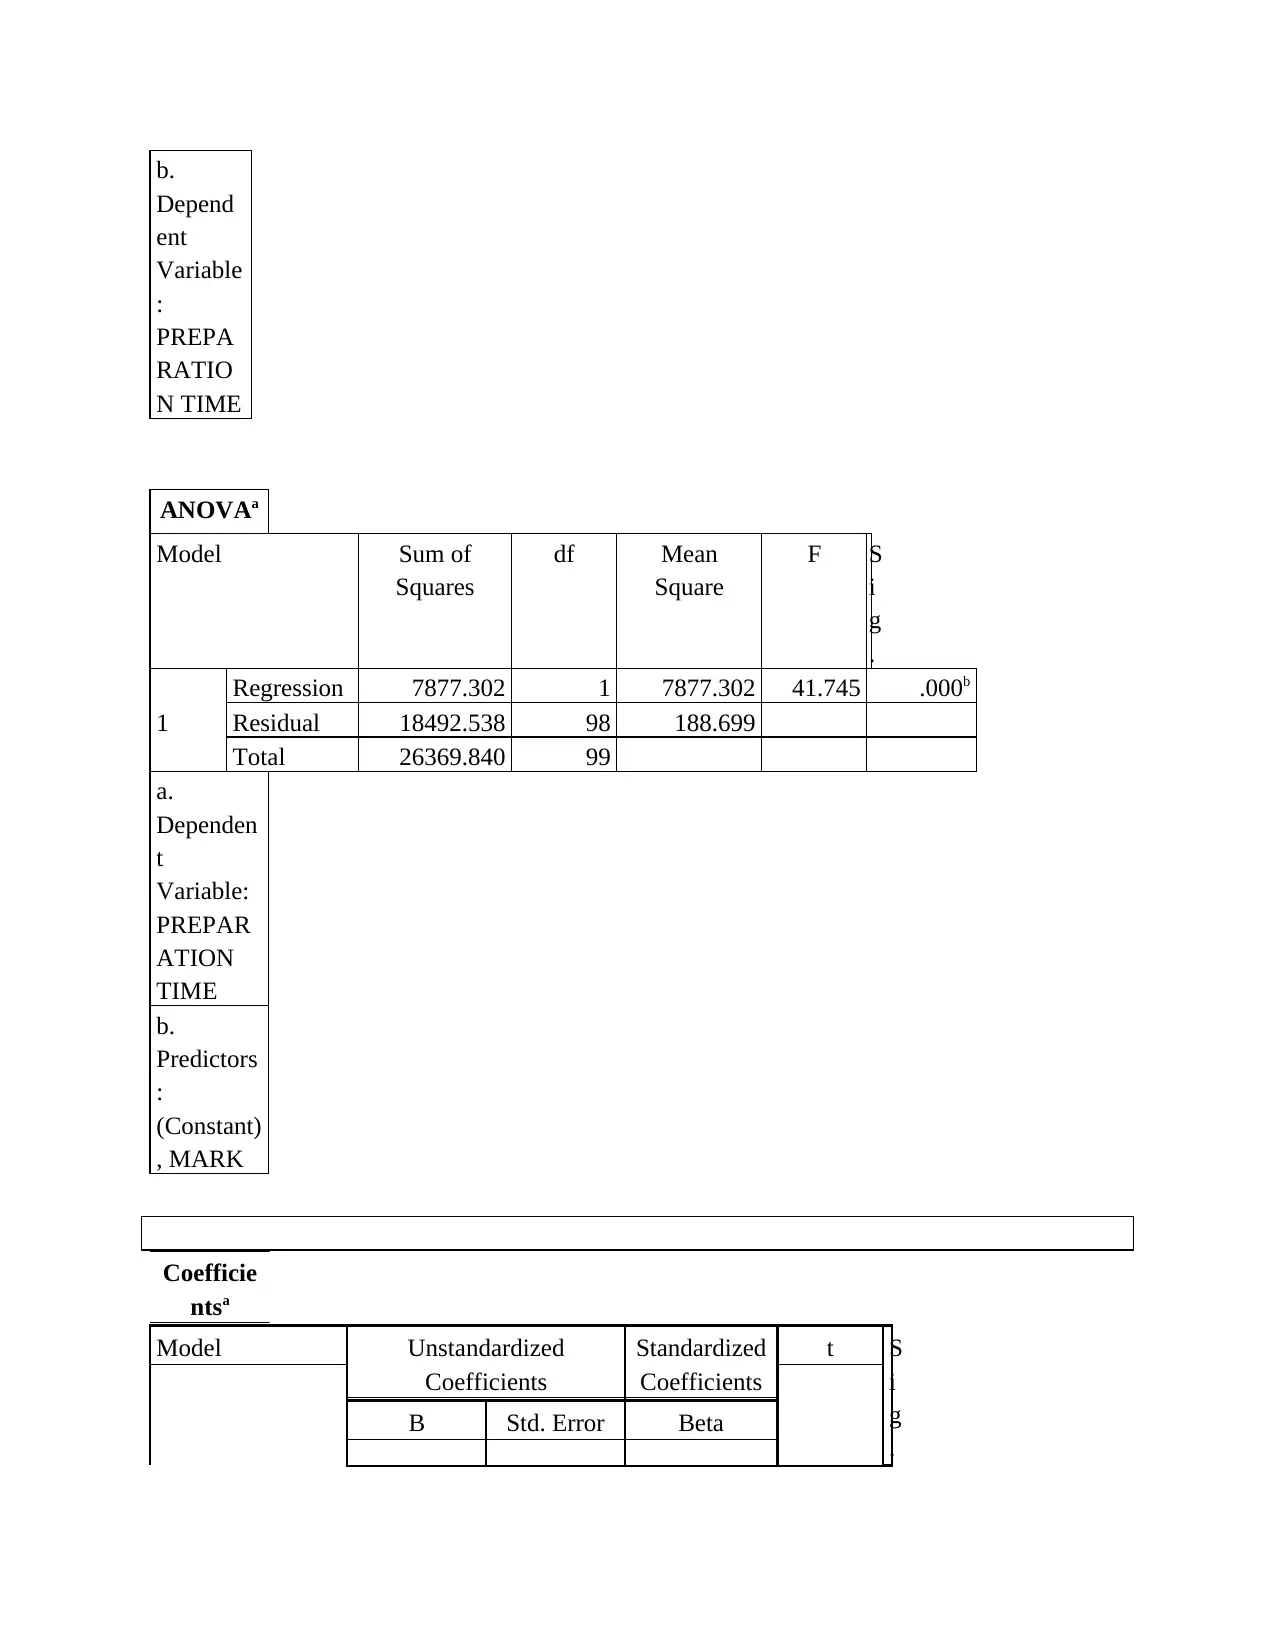
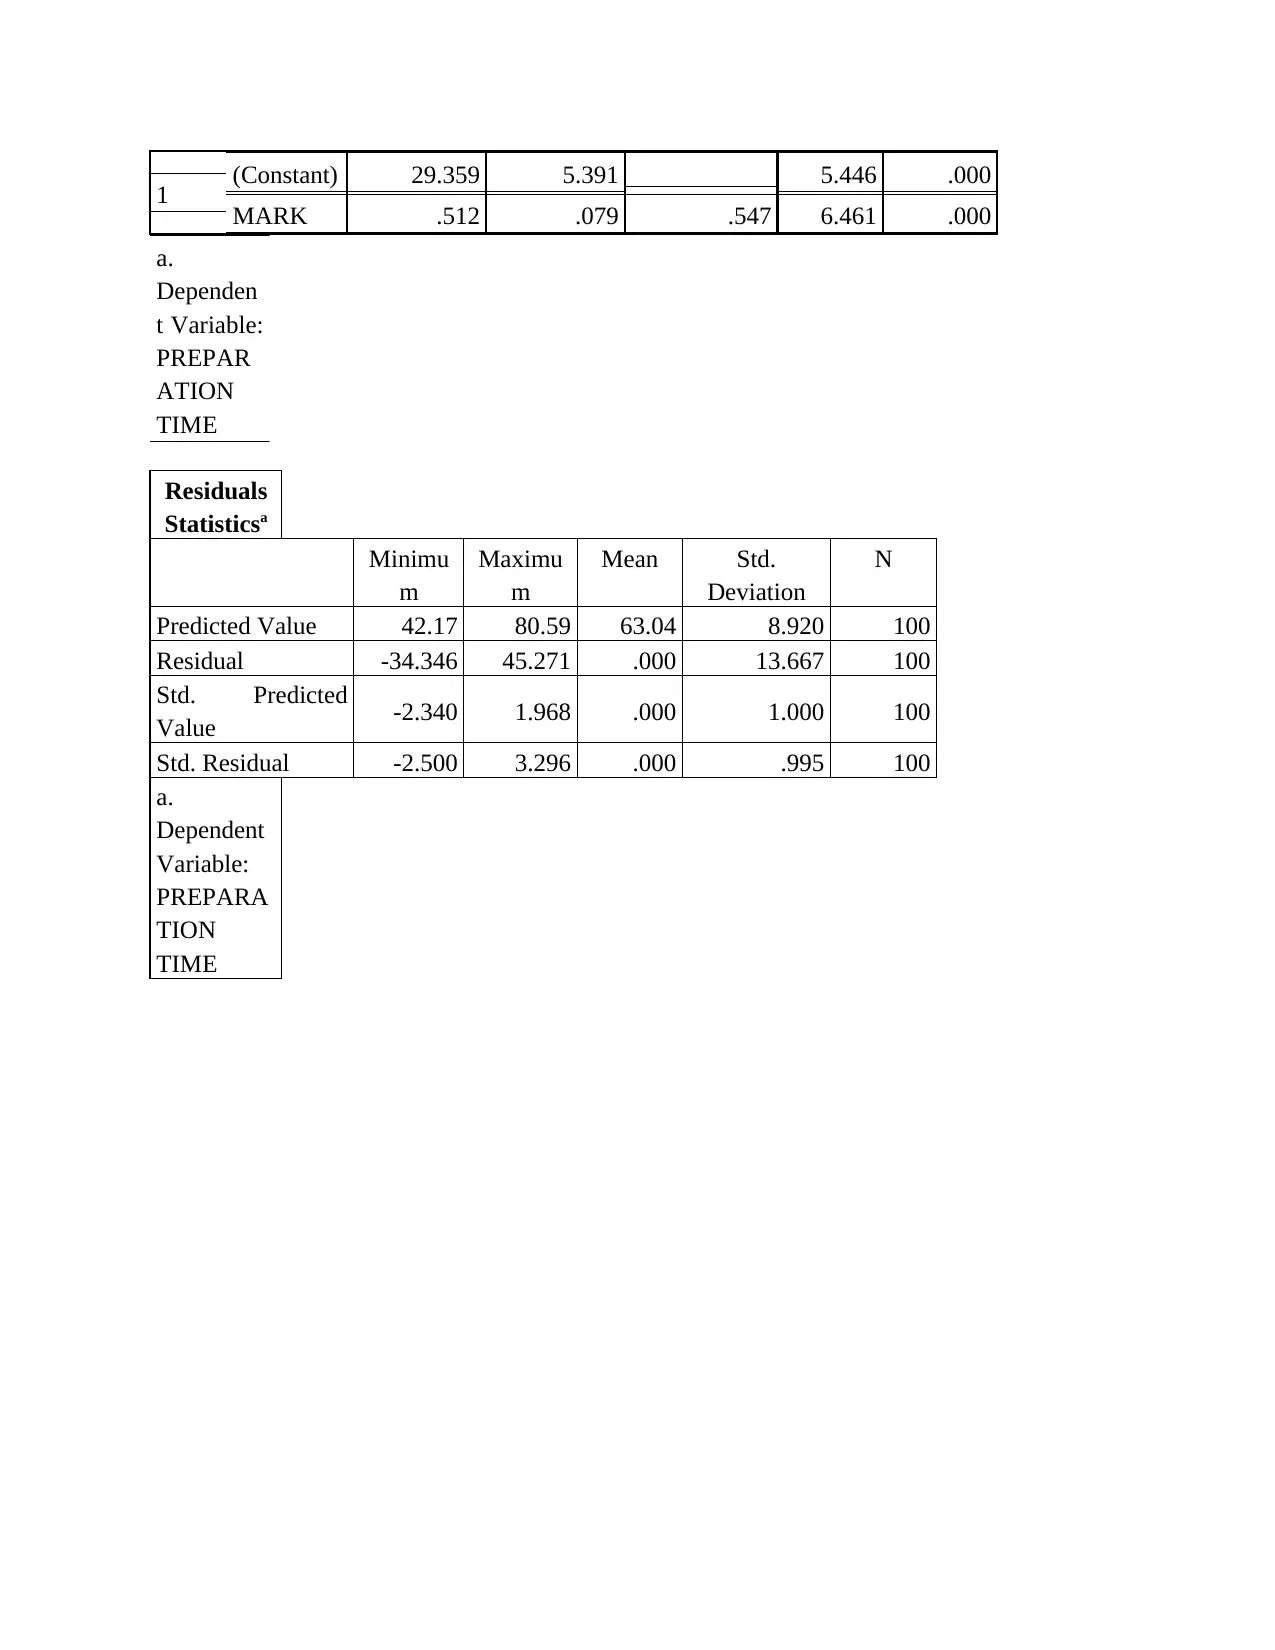
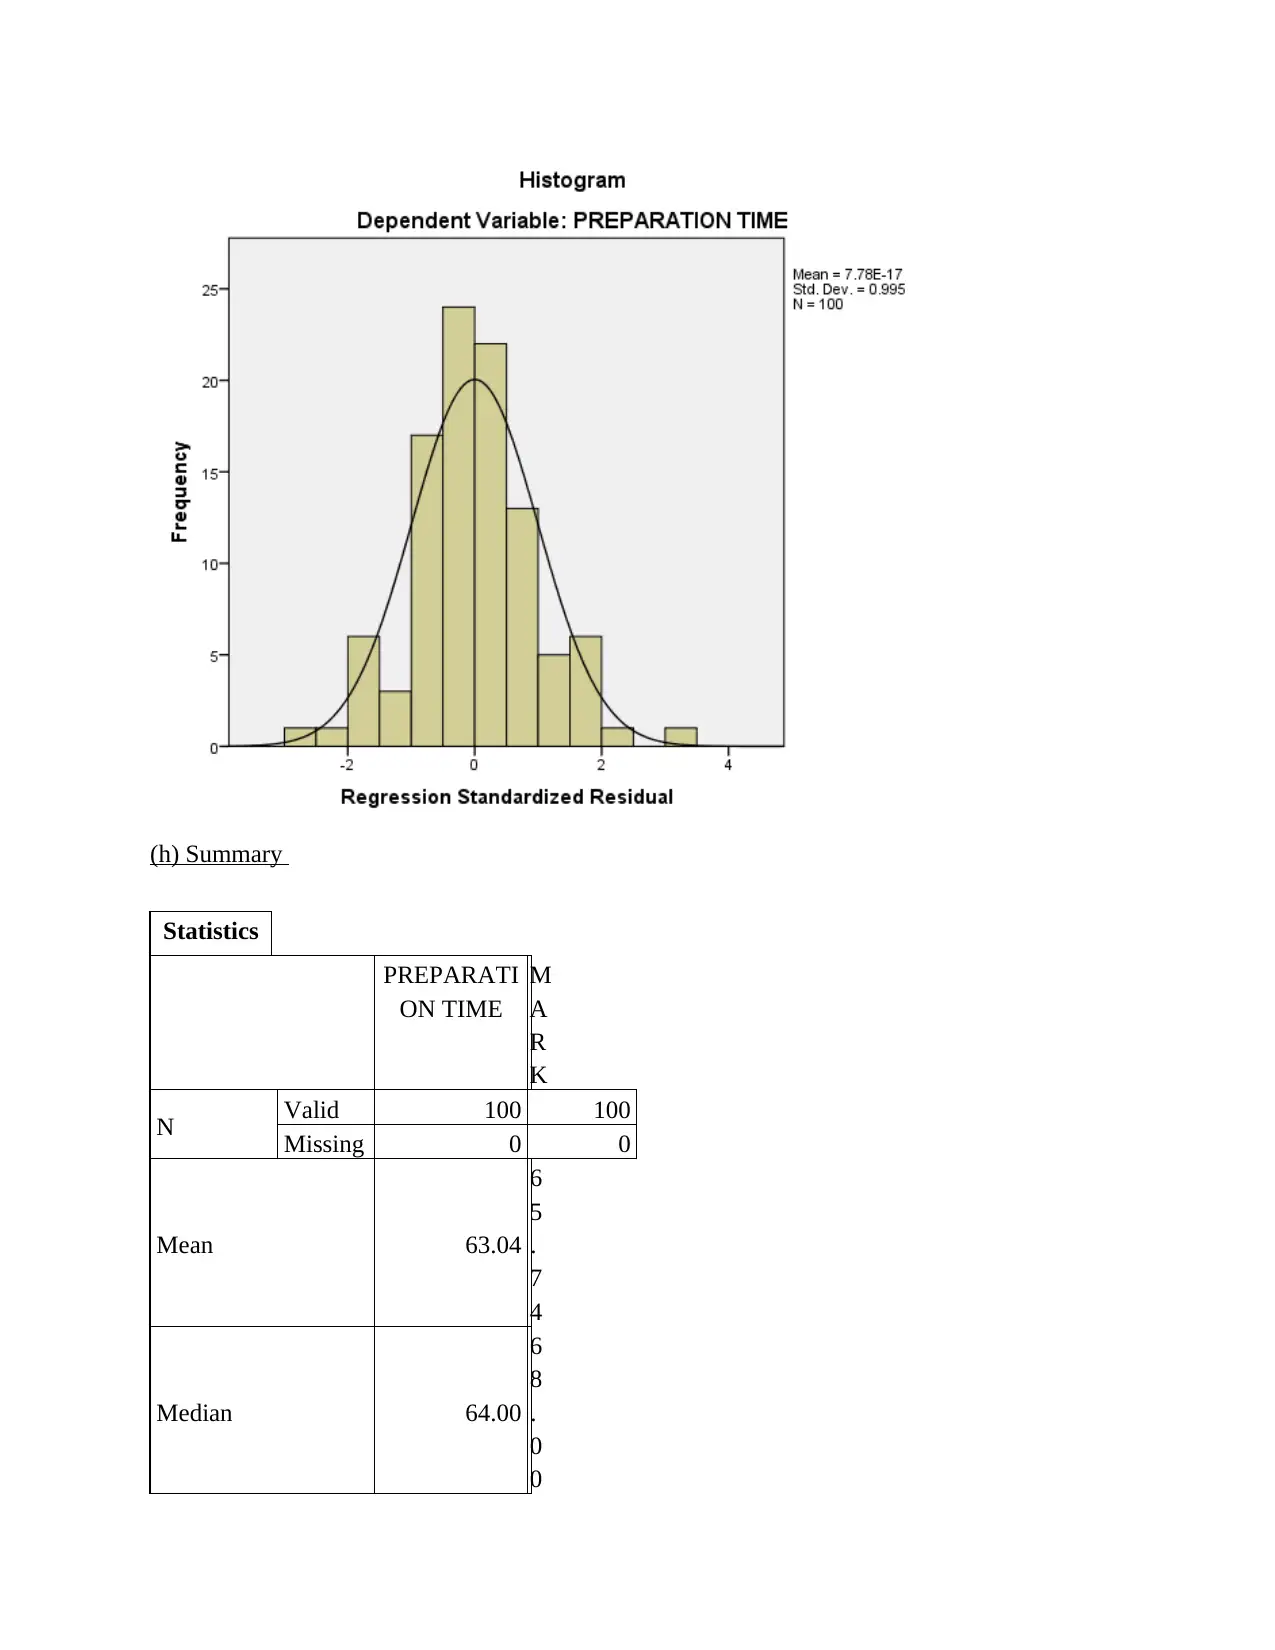
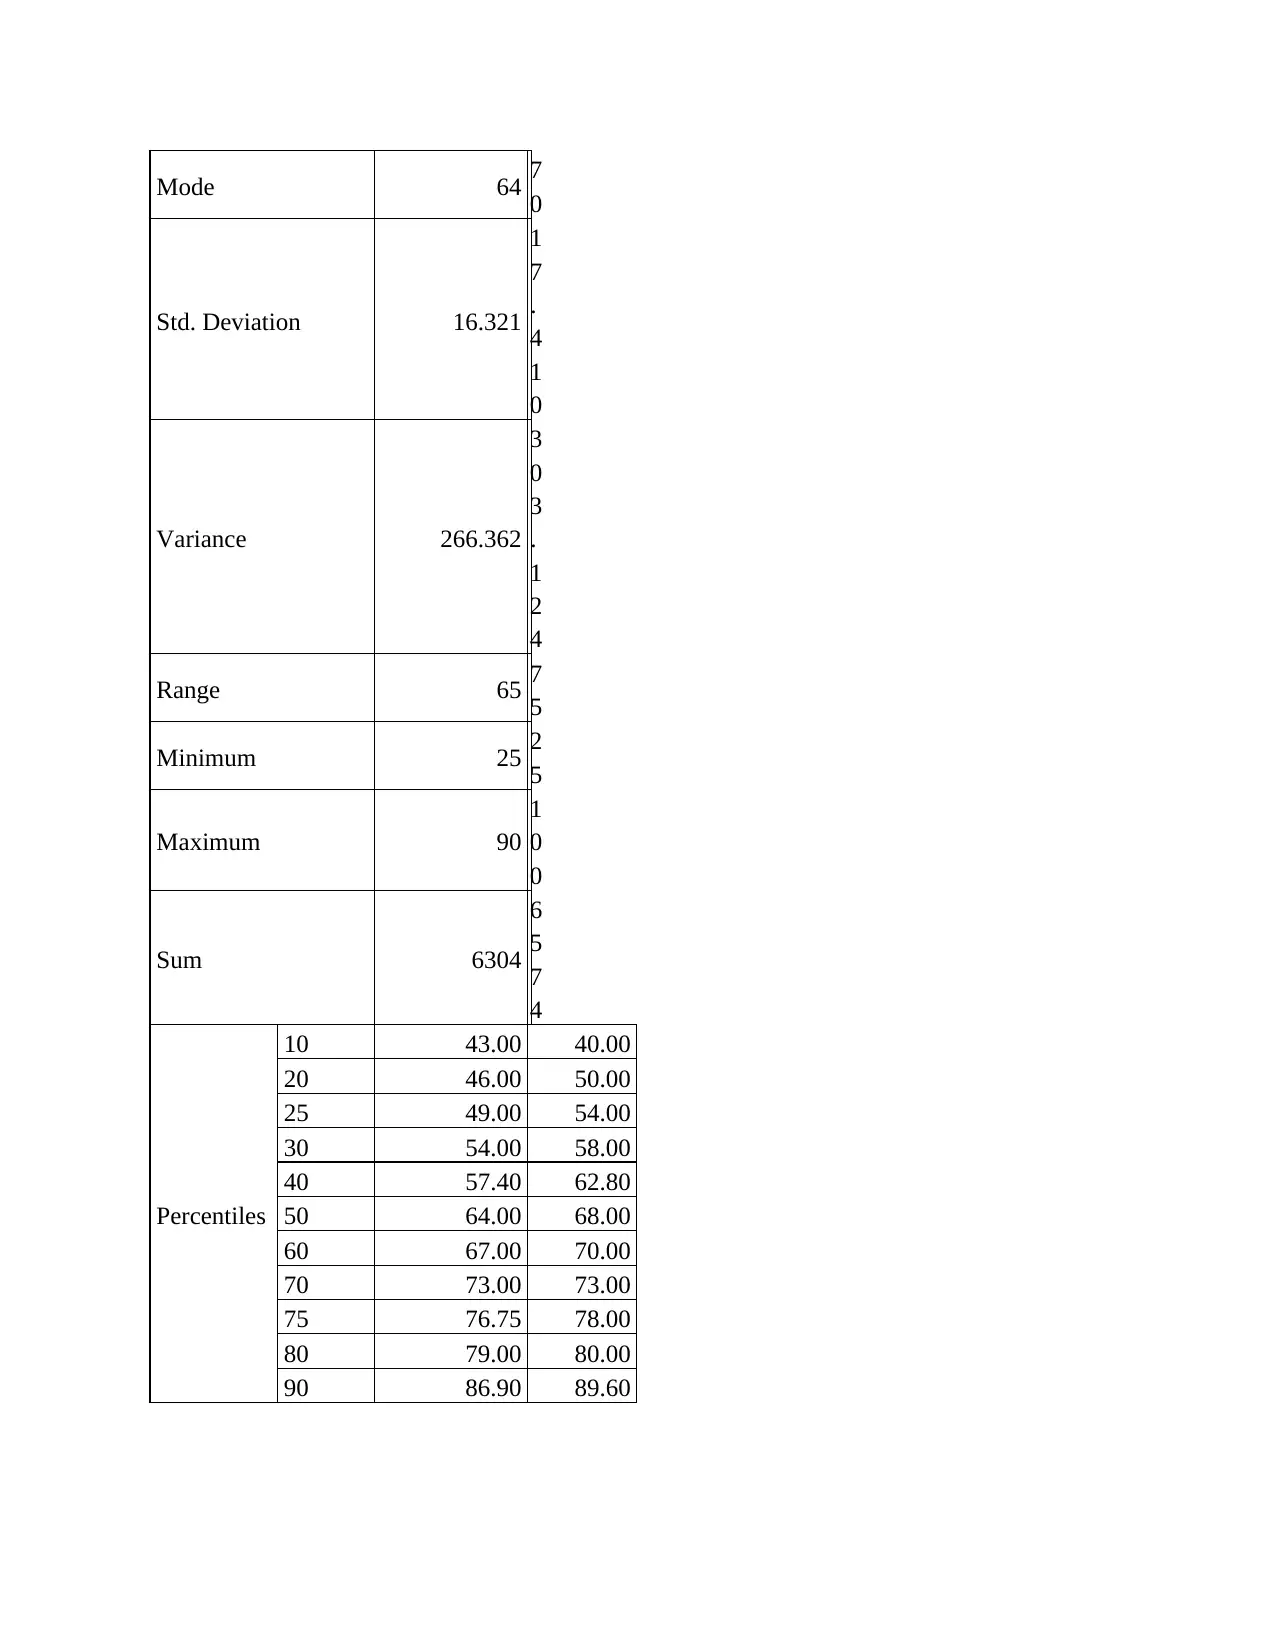
This statistics group project analyzes student performance data, focusing on the relationship between preparation time and marks. The project begins with an overview of survey methods and sampling techniques, specifically questionnaire-based surveys and probability sampling methods like random, stratified, and cluster sampling. It then identifies dependent and independent variables, determining data types, and addresses potential issues encountered during data collection, such as dishonesty and differences in interpretation. The project includes the creation and interpretation of frequency histograms and scatter plots to visualize the data. Regression analysis is performed to determine the equation of the estimated fitting line, and statistical measures like the correlation coefficient are used to quantify the strength and direction of the relationship between variables. The project concludes with an interpretation of the findings, highlighting the linear relationship between preparation time and student marks, along with standard error estimation and coefficient of determination analysis. Overall, the project provides a comprehensive statistical analysis of student data, including descriptive statistics, correlations, and regression modeling.

Statistics Group Project
Paraphrase This Document
Need a fresh take? Get an instant paraphrase of this document with our AI Paraphraser

Table of Contents
TASK 1............................................................................................................................................3
(a) Survey method..................................................................................................................3
(b) Sampling method for selecting a sample:.........................................................................3
(c) Determination of the dependent and independent variables and identification of the data
type:........................................................................................................................................4
(d) Issues ................................................................................................................................4
(e) Frequency histogram ........................................................................................................5
(f) Scatter plot :.......................................................................................................................7
(g) Equation of estimated fitting line :...................................................................................8
(h) Summary ........................................................................................................................11
(i) Interpretation:..................................................................................................................13
TASK 2..........................................................................................................................................13
(a) Estimate errors................................................................................................................13
(b) Coefficient......................................................................................................................13
(c) Attuned coefficient of resoluteness for grade of exemption:..........................................14
(d) ........................................................................................................................................15
(e) .........................................................................................................................................15
(f) Relation between tallness of father and son....................................................................16
(g) Relation between tallness of Mother and son:................................................................17

TASK 1
(a) Survey method
The survey method may be in two forms such as questionnaire and interviews. There will
be questionnaire method was select to conduct a survey. Questionnaire contains a number of
questions in sequence about various aspects. These questionnaire are presented to the
respondents and collected their reviews through these questions. The questionnaire may be in
form of printed paper or electronic. It may be emailed to various respondents if physically
distribution is not possible. It also provide choice of answers to the respondents so that they can
make easy decision while filling up the questionnaire. Questionnaire may be of various types
such as customer satisfaction questionnaire, product use satisfactory questionnaire, company
communication evaluation questionnaire, etc.. on the other hand it contain some specific
characteristics such as uniformity, exploratory, questions sequencing, etc..
(b) Sampling method for selecting a sample:
There are two types of sampling methods such as probability and non-probability.
Probability based techniques are more useful and reliable. Following are the probability based
techniques:
ï‚· Random sampling: As the name indicate that method is very simple which based on
totally selection of sample from individuals through automated process. The sample is
selected on random basis.
ï‚· Stratified sampling: This type of sampling method used when there was a large size of
population. According to that sampling technique the whole population are divided into
small strata and then sample is chosen from each group.
ï‚· Cluster sampling: that type of method contains the random selection of samples from
geographical spread variables.
Probability based sampling methods are more reliable because these provides the total population
based sample which present the guaranteed results based on whole population.
There are some specific steps to conduct probability sampling, which are as follows:
1. choosing of interested population carefully.
2. Determination of appropriate sample frame.
3. Selection of sample according to sample frame and start up of survey.
⊘ This is a preview!⊘
Do you want full access?
Subscribe today to unlock all pages.

Trusted by 1+ million students worldwide

(c) Determination of the dependent and independent variables and identification of the data type:
The data are given for the preparation time and marks of students. The values which
does not consider by researcher is known as dependent variable. Independent variable are those
values which can be manipulated in experiment. Both the variables are important for the
interpretation of results, but the data given for the preparation time are independent in nature and
marks of the students are dependent.
Why? - The data for marks of the students are dependent and data for preparation time is
independent because the marks of students depends on the preparation of students. As the more
preparation students done they get more marks and if they give less time to their preparation then
they get less marks. So the data of marks of students is depend on the data of preparation time.
So that the dependent variables are marks of students and independent variables preparation of
data.
Data types : Variable is numerical in context to type of data.
(d) Issues
1. Lack of attention
2. Dishonesty
3. Differences in understanding and interpretation
4. Problems in expressing felling and emotions
5. Difficulty in analysing some questions
6. Biasses
7. Lack of personal relation with respondents
8. Accessibility issues
Explanation of two cases: Following are the explanation of two cases from the list of issues
which faced due to data collection with the help of questionnaire method:
Dishonesty: The foremost problem with this method is that the respondents are not
honest every time. Most of the respondents answers without any truthfulness and proper
attention. So the whole survey goes in wrong direction.
Differences in understanding and interpretation: most of the respondents interpret the
presented questions in wrong way so that answers were fluctuate according to distinct point of
view of respondents and researcher.
Paraphrase This Document
Need a fresh take? Get an instant paraphrase of this document with our AI Paraphraser

(e) Frequency histogram
Marks F RF CF CRF
20-30 4 4% 4 4%
30-40 8 8% 12 12%
40-50 11 11% 23 23%
50-60 15 15% 38 38%
60-70 31 31% 69 69%
70-80 13 13% 82 82%
80-90 10 10% 92 92%
90-100 8 8% 100 100%
Prepartion
time F RF CF CRF
20-30 1 1% 1 1%
30-40 8 8% 9 9%
40-50 16 16% 25 25%
50-60 20 20% 45 45%
60-70 21 21% 66 66%
70-80 18 18% 84 84%
80-90 16 16% 16 16%

90-100 0 0% 0 0%
There are some specific shapes of frequency histogram, which describes also the nature
of distribution.
Comment: In conducted scenario, the shape of frequency histogram is bell shaped which
shows normal distribution.
These shapes are described as follows, which clarify the reason of above comment:
There are some specific shapes of frequency histogram, which describes also the nature
of distribution.
Comment: In conducted scenario, the shape of frequency histogram is bell shaped which
shows normal distribution.
These shapes are described as follows, which clarify the reason of above comment:
⊘ This is a preview!⊘
Do you want full access?
Subscribe today to unlock all pages.

Trusted by 1+ million students worldwide

Bell shaped: That type of shape of histogram same as the shape of a bell. It shows the normal
distribution.
Bimodal: That type of shapes shows two different peaks. It shows that the data are from two
different sources, which have to be analysed differently.
Skewed right and left: A distribution skewed to the right is said to be positively skewed. This
type of distribution has huge number of occurrences in lower value cells (left side) & few in the
upper value cells (right side). A skewed distribution can result when data is gathered from a
system with has a boundary such as zero. And on the other hand the left skewed distribution is
totally opposite from it.
Uniform: it shows little information. It occurs when number of classes very small.
Random: This type of distribution is a random distribution, which have no apparent. It have two
many classes.
(f) Scatter plot :
(g) Equation of estimated fitting line :
Descriptive
Statistics
Mean Std.
Deviation
N
Paraphrase This Document
Need a fresh take? Get an instant paraphrase of this document with our AI Paraphraser

PREPARATION
TIME 63.04 16.321 100
MARK 65.74 17.410 100
Correlations
PREPARATI
ON TIME
M
A
R
K
Pearson
Correlation
PREPARATION
TIME 1.000 .547
MARK .547 1.000
Sig. (1-tailed)
PREPARATION
TIME . .000
MARK .000 .
N
PREPARATION
TIME 100 100
MARK 100 100
Model
Summa
ryb
Model R R
Square
Adjuste
d R
Square
Std.
Error of
the
Estimate
Change
Statistic
s
R
Square
Change
F
Change
df1 df2 Sig. F
Change
1 .547a .299 .292 13.737 .299 41.745 1 98 .000
a.
Predicto
rs:
(Consta
nt),
MARK

b.
Depend
ent
Variable
:
PREPA
RATIO
N TIME
ANOVAa
Model Sum of
Squares
df Mean
Square
F S
i
g
.
1
Regression 7877.302 1 7877.302 41.745 .000b
Residual 18492.538 98 188.699
Total 26369.840 99
a.
Dependen
t
Variable:
PREPAR
ATION
TIME
b.
Predictors
:
(Constant)
, MARK
Coefficie
ntsa
Model Unstandardized
Coefficients
Standardized
Coefficients
t S
i
g
.
B Std. Error Beta
⊘ This is a preview!⊘
Do you want full access?
Subscribe today to unlock all pages.

Trusted by 1+ million students worldwide

1 (Constant) 29.359 5.391 5.446 .000
MARK .512 .079 .547 6.461 .000
a.
Dependen
t Variable:
PREPAR
ATION
TIME
Residuals
Statisticsa
Minimu
m
Maximu
m
Mean Std.
Deviation
N
Predicted Value 42.17 80.59 63.04 8.920 100
Residual -34.346 45.271 .000 13.667 100
Std. Predicted
Value -2.340 1.968 .000 1.000 100
Std. Residual -2.500 3.296 .000 .995 100
a.
Dependent
Variable:
PREPARA
TION
TIME
Paraphrase This Document
Need a fresh take? Get an instant paraphrase of this document with our AI Paraphraser

(h) Summary
Statistics
PREPARATI
ON TIME
M
A
R
K
N Valid 100 100
Missing 0 0
Mean 63.04
6
5
.
7
4
Median 64.00
6
8
.
0
0
Statistics
PREPARATI
ON TIME
M
A
R
K
N Valid 100 100
Missing 0 0
Mean 63.04
6
5
.
7
4
Median 64.00
6
8
.
0
0

Mode 64 7
0
Std. Deviation 16.321
1
7
.
4
1
0
Variance 266.362
3
0
3
.
1
2
4
Range 65 7
5
Minimum 25 2
5
Maximum 90
1
0
0
Sum 6304
6
5
7
4
Percentiles
10 43.00 40.00
20 46.00 50.00
25 49.00 54.00
30 54.00 58.00
40 57.40 62.80
50 64.00 68.00
60 67.00 70.00
70 73.00 73.00
75 76.75 78.00
80 79.00 80.00
90 86.90 89.60
0
Std. Deviation 16.321
1
7
.
4
1
0
Variance 266.362
3
0
3
.
1
2
4
Range 65 7
5
Minimum 25 2
5
Maximum 90
1
0
0
Sum 6304
6
5
7
4
Percentiles
10 43.00 40.00
20 46.00 50.00
25 49.00 54.00
30 54.00 58.00
40 57.40 62.80
50 64.00 68.00
60 67.00 70.00
70 73.00 73.00
75 76.75 78.00
80 79.00 80.00
90 86.90 89.60
⊘ This is a preview!⊘
Do you want full access?
Subscribe today to unlock all pages.

Trusted by 1+ million students worldwide
1 out of 17
Related Documents

Your All-in-One AI-Powered Toolkit for Academic Success.
 +13062052269
info@desklib.com
Available 24*7 on WhatsApp / Email
Unlock your academic potential
Copyright © 2020–2025 A2Z Services. All Rights Reserved. Developed and managed by ZUCOL.