Statistics Assignment: Data Analysis and Regression Analysis

Verified

Added on  2020/04/07

|5
|1956
|202
Homework Assignment
AI Summary
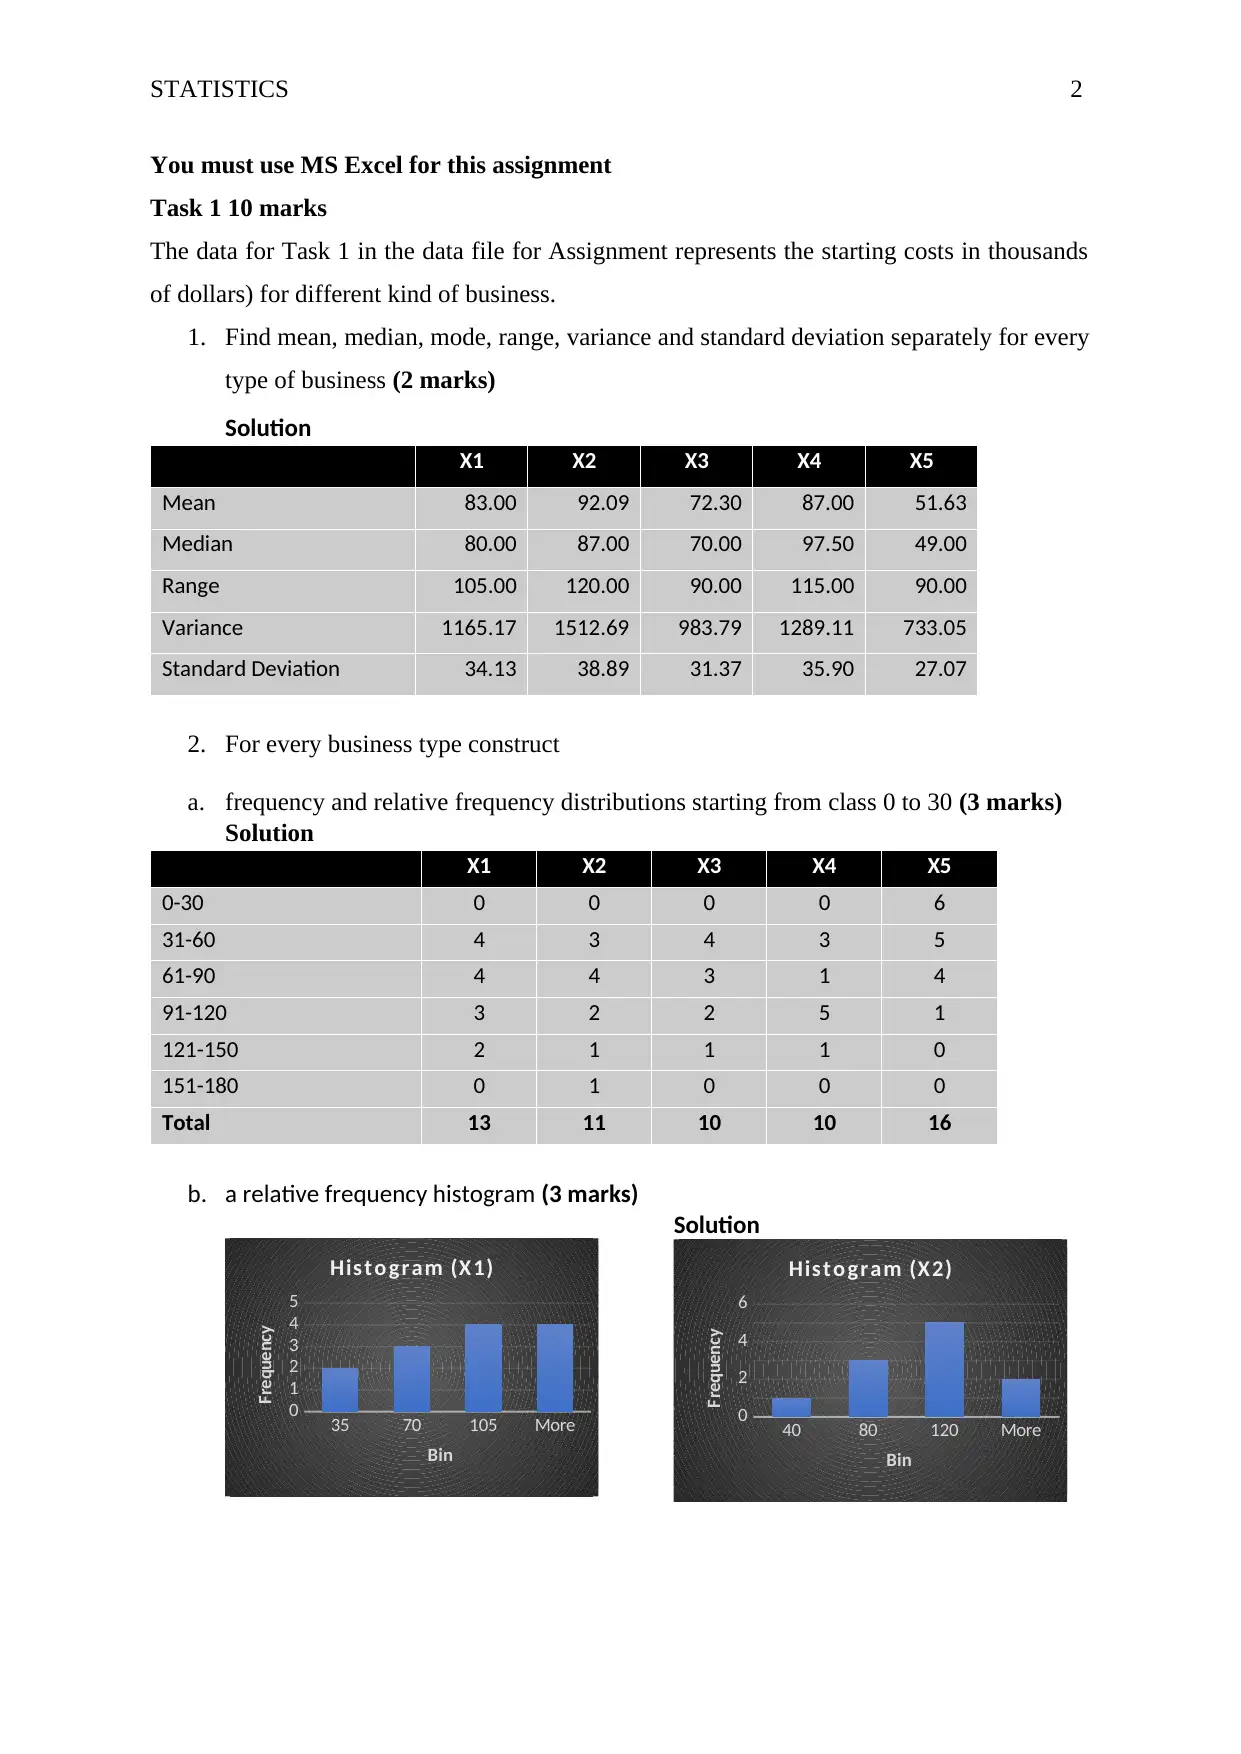
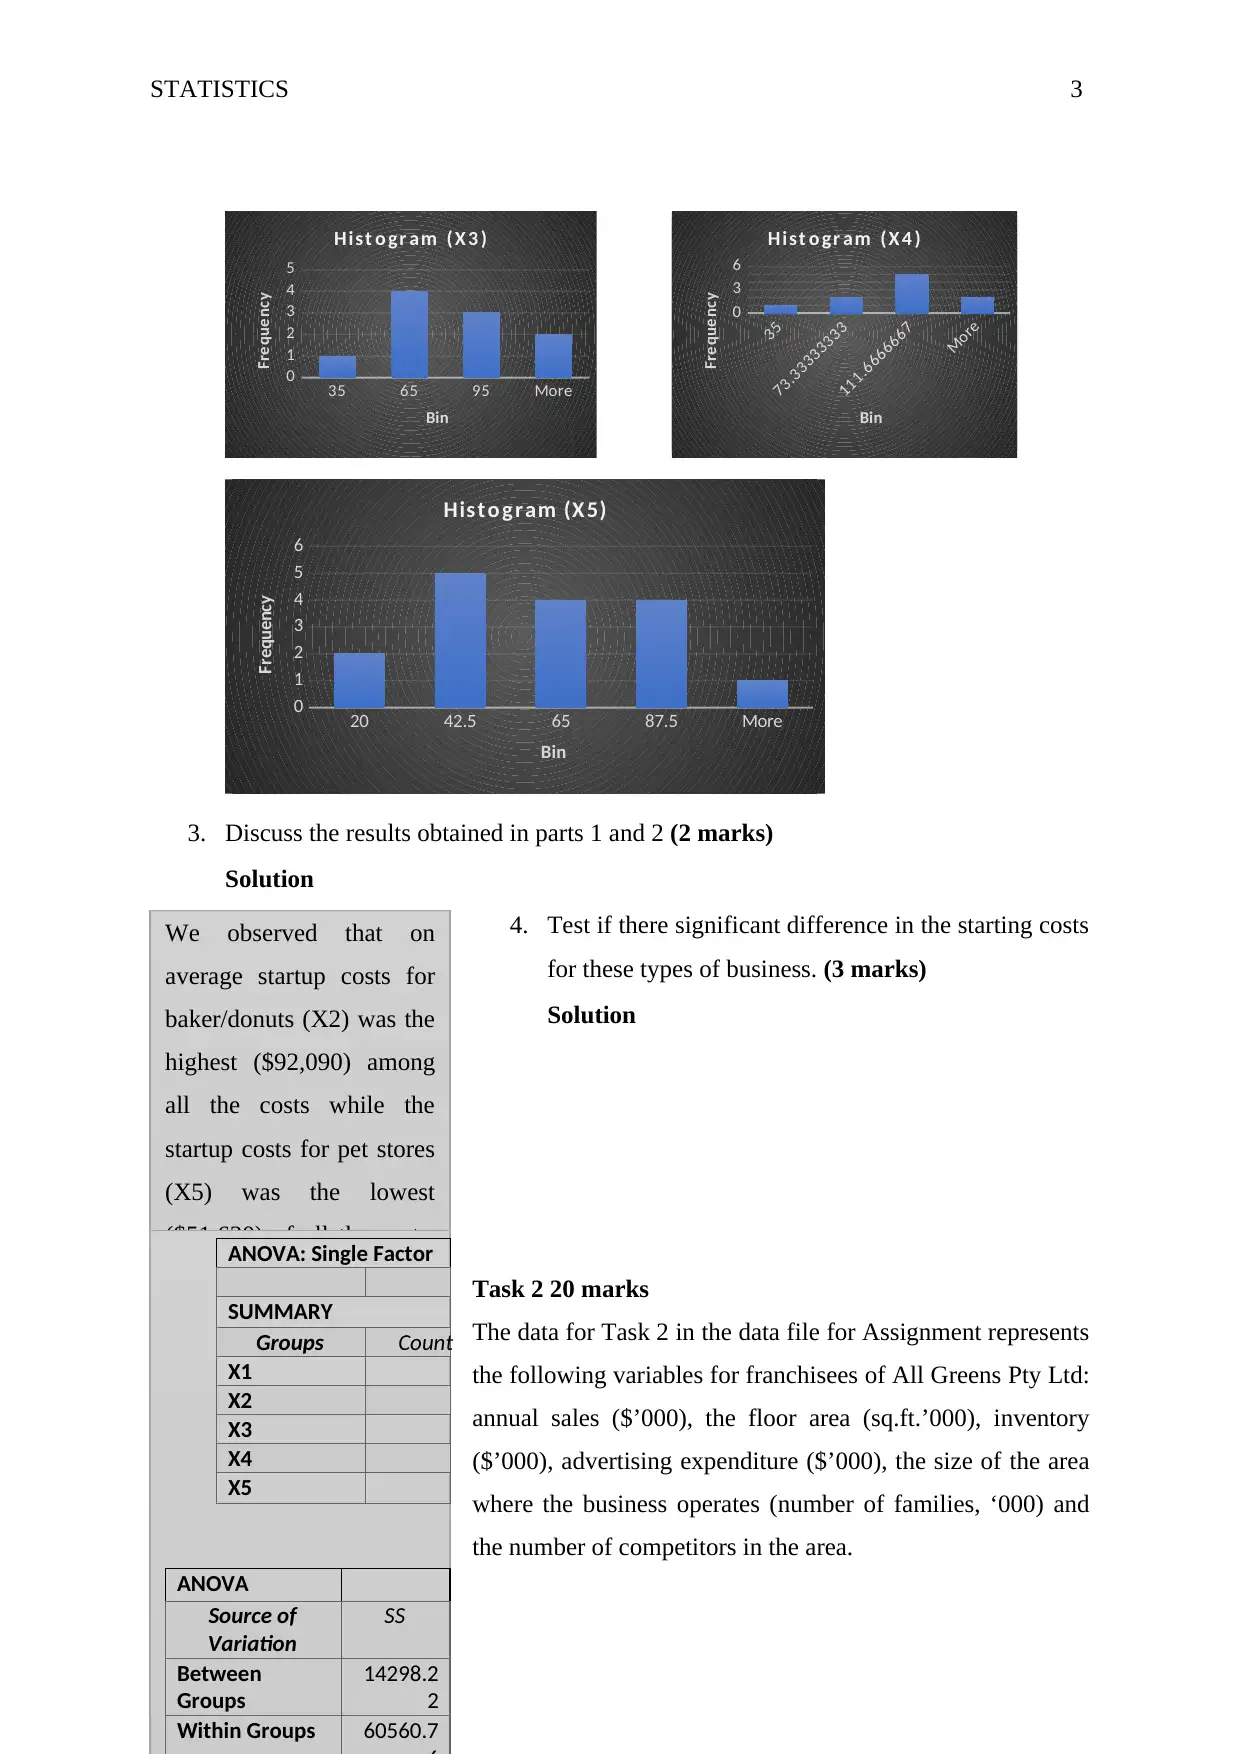
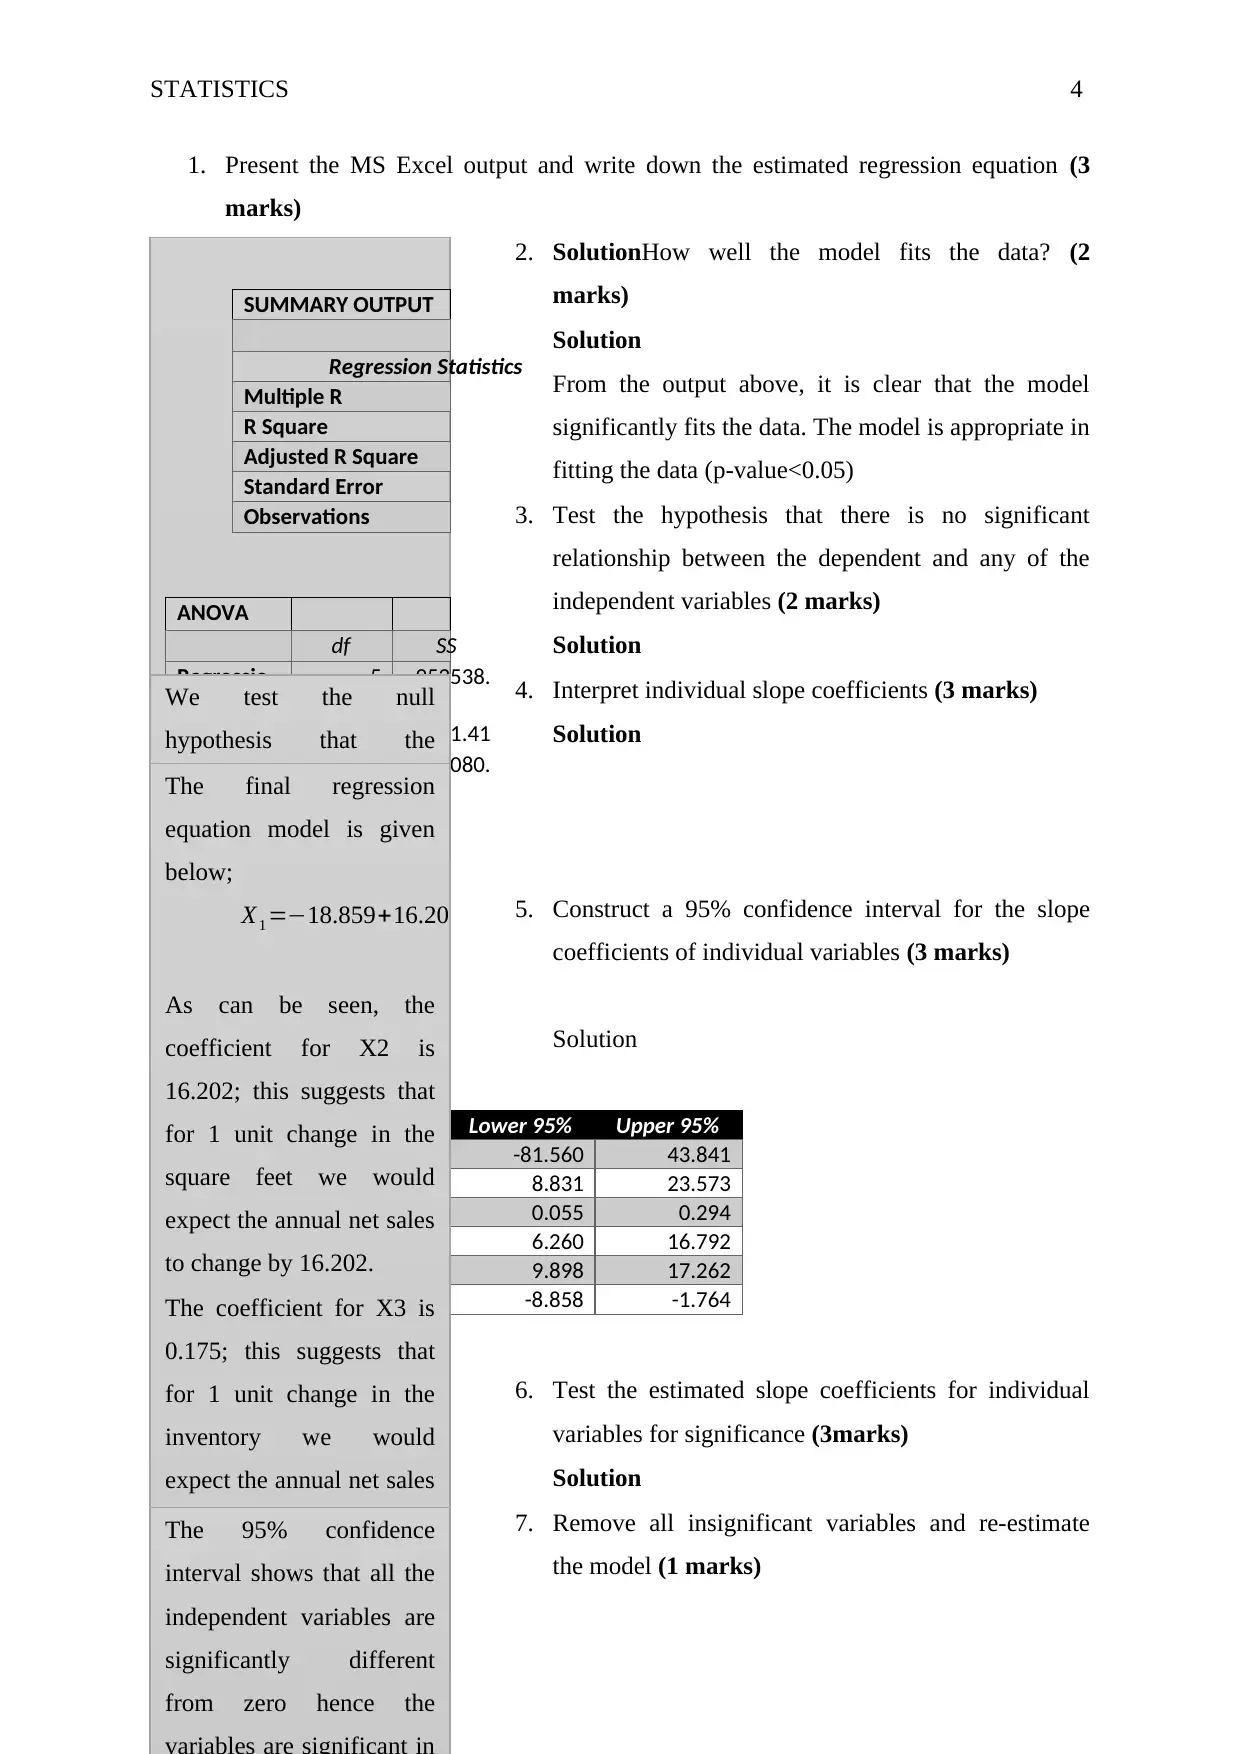
This statistics assignment presents a comprehensive analysis of data using Microsoft Excel. Task 1 focuses on descriptive statistics, including mean, median, mode, range, variance, and standard deviation, applied to different business types. It involves constructing frequency and relative frequency distributions and histograms, followed by a discussion of the results and an ANOVA test to determine significant differences in startup costs. Task 2 delves into multiple regression analysis, using data from All Greens Pty Ltd. The assignment requires the student to present the regression equation, assess model fit, test hypotheses about variable relationships, interpret individual slope coefficients, construct confidence intervals, and test for the significance of slope coefficients. Finally, the student must predict annual sales for a given franchisee scenario using the developed regression model. The assignment provides a practical application of statistical concepts to real-world business scenarios, demonstrating skills in data analysis, interpretation, and statistical modeling.
Document Page
Running Head: STATISTICS 1
Statistics
Name
University
24th September 2017
tabler-icon-diamond-filled.svg

Paraphrase This Document

Need a fresh take? Get an instant paraphrase of this document with our AI Paraphraser
Document Page
STATISTICS 2
You must use MS Excel for this assignment
Task 1 10 marks
The data for Task 1 in the data file for Assignment represents the starting costs in thousands
of dollars) for different kind of business.
1. Find mean, median, mode, range, variance and standard deviation separately for every
type of business (2 marks)
Solution
X1 X2 X3 X4 X5
Mean 83.00 92.09 72.30 87.00 51.63
Median 80.00 87.00 70.00 97.50 49.00
Range 105.00 120.00 90.00 115.00 90.00
Variance 1165.17 1512.69 983.79 1289.11 733.05
Standard Deviation 34.13 38.89 31.37 35.90 27.07
2. For every business type construct
a. frequency and relative frequency distributions starting from class 0 to 30 (3 marks)
Solution
X1 X2 X3 X4 X5
0-30 0 0 0 0 6
31-60 4 3 4 3 5
61-90 4 4 3 1 4
91-120 3 2 2 5 1
121-150 2 1 1 1 0
151-180 0 1 0 0 0
Total 13 11 10 10 16
b. a relative frequency histogram (3 marks)
Solution
40 80 120 More
0
2
4
6
Histo gram (X2)
Bin
Frequency
35 70 105 More
0
1
2
3
4
5
Histo gram (X1)
Bin
Frequency
Document Page
STATISTICS 3
35
73.33333333
111.6666667
More
0
3
6
Hist o gr am ( X 4 )
Bin
Frequency
20 42.5 65 87.5 More
0
1
2
3
4
5
6
Histo gram (X5)
Bin
Frequency
3. Discuss the results obtained in parts 1 and 2 (2 marks)
Solution
4. Test if there significant difference in the starting costs
for these types of business. (3 marks)
Solution
Task 2 20 marks
The data for Task 2 in the data file for Assignment represents
the following variables for franchisees of All Greens Pty Ltd:
annual sales ($’000), the floor area (sq.ft.’000), inventory
($’000), advertising expenditure ($’000), the size of the area
where the business operates (number of families, ‘000) and
the number of competitors in the area.
35 65 95 More
0
1
2
3
4
5
Hist o gr am ( X 3 )
Bin
Frequency
We observed that on
average startup costs for
baker/donuts (X2) was the
highest ($92,090) among
all the costs while the
startup costs for pet stores
(X5) was the lowest
($51,630) of all the costs.
The data are however not
much spread out for all the
five variables though X5
is the least spread out
when compared to all the
other variables and X2 is
the most spread out.
From the frequency
distribution, we can see
that the costs spread out
between 31-150 dollars for
ANOVA: Single Factor
SUMMARY
Groups Count
X1
X2
X3
X4
X5
ANOVA
Source of
Variation
SS
Between
Groups
14298.2
2
Within Groups 60560.7
Document Page
STATISTICS 4
1. Present the MS Excel output and write down the estimated regression equation (3
marks)
2. SolutionHow well the model fits the data? (2
marks)
Solution
From the output above, it is clear that the model
significantly fits the data. The model is appropriate in
fitting the data (p-value<0.05)
3. Test the hypothesis that there is no significant
relationship between the dependent and any of the
independent variables (2 marks)
Solution
4. Interpret individual slope coefficients (3 marks)
Solution
5. Construct a 95% confidence interval for the slope
coefficients of individual variables (3 marks)
Solution
Lower 95% Upper 95%
Intercept -81.560 43.841
X2 8.831 23.573
X3 0.055 0.294
X4 6.260 16.792
X5 9.898 17.262
X6 -8.858 -1.764
6. Test the estimated slope coefficients for individual
variables for significance (3marks)
Solution
7. Remove all insignificant variables and re-estimate
the model (1 marks)
SUMMARY OUTPUT
Regression Statistics
Multiple R
R Square
Adjusted R Square
Standard Error
Observations
ANOVA
df SS
Regressio
n
5 952538.
Residual 21 6541.41
Total 26 959080.
Coefficients
Intercept -18.859
X2 16.202
X3 0.175
X4 11.526
X5 13.580
X6 -5.311
From the above
output, the
estimated
regression equation
is;
X1 =18.859+16.202 X2+0.175 X3+ 11.256 X4 +13.580 X55.311 X6
Where
X1 = annual net
sales/$1000
X2 = number sq.
ft./1000
X3 =
inventory/$1000
X4 = amount spent
We test the null
hypothesis that the
coefficients of the
independent variables are
equal to zero against the
alternative that states that
they are not equal to zero.
That is,
H0 : βi=0
H1 : βi 0
From the above regression
results, it is clear that the
p-values for all the
independent variables are
less than α =0.05. Thus we
reject the null hypothesis
for all the betas of the
independent variables and
conclude that they are not
equal to zero hence there
is significant relationship
between the dependent
variable and all the
independent variables.
The final regression
equation model is given
below;
X1 =18.859+16.202 X2+0.175 X3+ 11.256 X4 +13.580 X55.311 X6
As can be seen, the
coefficient for X2 is
16.202; this suggests that
for 1 unit change in the
square feet we would
expect the annual net sales
to change by 16.202.
The coefficient for X3 is
0.175; this suggests that
for 1 unit change in the
inventory we would
expect the annual net sales
to change by 0.175.
The coefficient for X4 is
11.256; this suggests that
for 1 unit change in the
advertising costs we
would expect the annual
The 95% confidence
interval shows that all the
independent variables are
significantly different
from zero hence the
tabler-icon-diamond-filled.svg

Paraphrase This Document

Need a fresh take? Get an instant paraphrase of this document with our AI Paraphraser
Document Page
STATISTICS 5
Solution
8. Using the model from part (g), predict annual sales
for a franchisee with 1,000 sq ft floor area, $150,000
inventory, $5,000 spent on advertising, 5,000 families
in the area of operation and 2 competitors. (3 marks)
Solution
It is evident that none of
the independent variables
is insignificant in the
model hence none of them
should be removed from
the estimating the model.The regression equation
model is;
X1 =18.859+16.202 X2+0.175 X3+ 11.256 X4 +13.580 X55.311 X6
X1 =18.859+16.202(1)+0.175 (150)+11.256 (5)+13.580 (5)5.311(2)
X1 =$ 138.4484
Thus the predicted annual
sales for the given
franchise is $138,448.4
chevron_up_icon
1 out of 5
circle_padding
hide_on_mobile
zoom_out_icon
[object Object]