Statistics for Management - Data Analysis and Report (Semester 1)
VerifiedAdded on 2020/09/17
|21
|5135
|28
Homework Assignment
AI Summary
This assignment, titled "Statistics for Management," presents a comprehensive analysis of various datasets using statistical techniques. The report begins with an introduction to the application of statistical tools for data analysis, followed by an examination of annual earnings in the public and private sectors, including gender pay gaps and percentage changes over several years. It further delves into analyzing gross annual earnings by industry sector using data from the Office of National Statistics. The assignment then explores hourly payments across different UK regions using mean, median, and quartile calculations. Additionally, it investigates delivery patterns, including the Economic Order Quantity (EOQ), and compares current ordering policies with new policies. The analysis incorporates line and ogive charts to visualize the data, culminating in a conclusion that summarizes the key findings and insights derived from the statistical analysis. The report provides detailed interpretations of the data, tables, and charts, and is supported by a list of references.
STATISTICS FOR
MANAGEMENT
MANAGEMENT
Paraphrase This Document
Need a fresh take? Get an instant paraphrase of this document with our AI Paraphraser
TABLE OF CONTENTS
INTRODUCTION...........................................................................................................................1
ACTIVITY 1....................................................................................................................................1
A Information relevant with annual earnings.........................................................................1
M1...........................................................................................................................................6
D1...........................................................................................................................................6
B. Analysing the gross annual earnings by industry sector on Office of National Statistics
website....................................................................................................................................6
ACTIVITY 2....................................................................................................................................8
M2 1. Ascertaining the hourly payment in UK are various regions.......................................8
ACTIVITY 3..................................................................................................................................11
A. Analysing the deliveries which are currently made in each year....................................11
B. Ascertaining the numbers of bags currently delivered in every delivery........................12
C. Analysing the EOQ..........................................................................................................12
D. Comparison between current ordering policies and new policies...................................12
M3........................................................................................................................................13
D2.........................................................................................................................................14
ACTIVITY 4..................................................................................................................................14
M4 A. Producing the line chart as per Activity 1.................................................................14
B. Producing the ogive chart as per Activity 2.....................................................................16
D3.........................................................................................................................................16
CONCLUSION..............................................................................................................................16
REFERENCES..............................................................................................................................18
INTRODUCTION
To implicate the use of statistical techniques and tool for analysing the huge data series
which will be helpful in terms of bringing the adequate analysis over the proposed data set. In the
present report there will be use of various statistical measurement methods to analyse appropriate
outcomes. Thus, such results will be helpful in managing the operations of the work in such
sectors. It will be a beneficial tool in terms of analysing the requirements as well as proposed
new ideas to implicate changes in such activities. The use of statistical measurement techniques
such as mean, mode, median, standard deviation will be helpful in ascertaining the data set of
sales personnel. The EOQ measurements on analysing the rice bags orders and deliveries made
in a year. Moreover, this study will be helpful in enhancing the appropriate knowledge regarding
statistical measurements which will bring accurate solutions.
ACTIVITY 1
A Information relevant with annual earnings
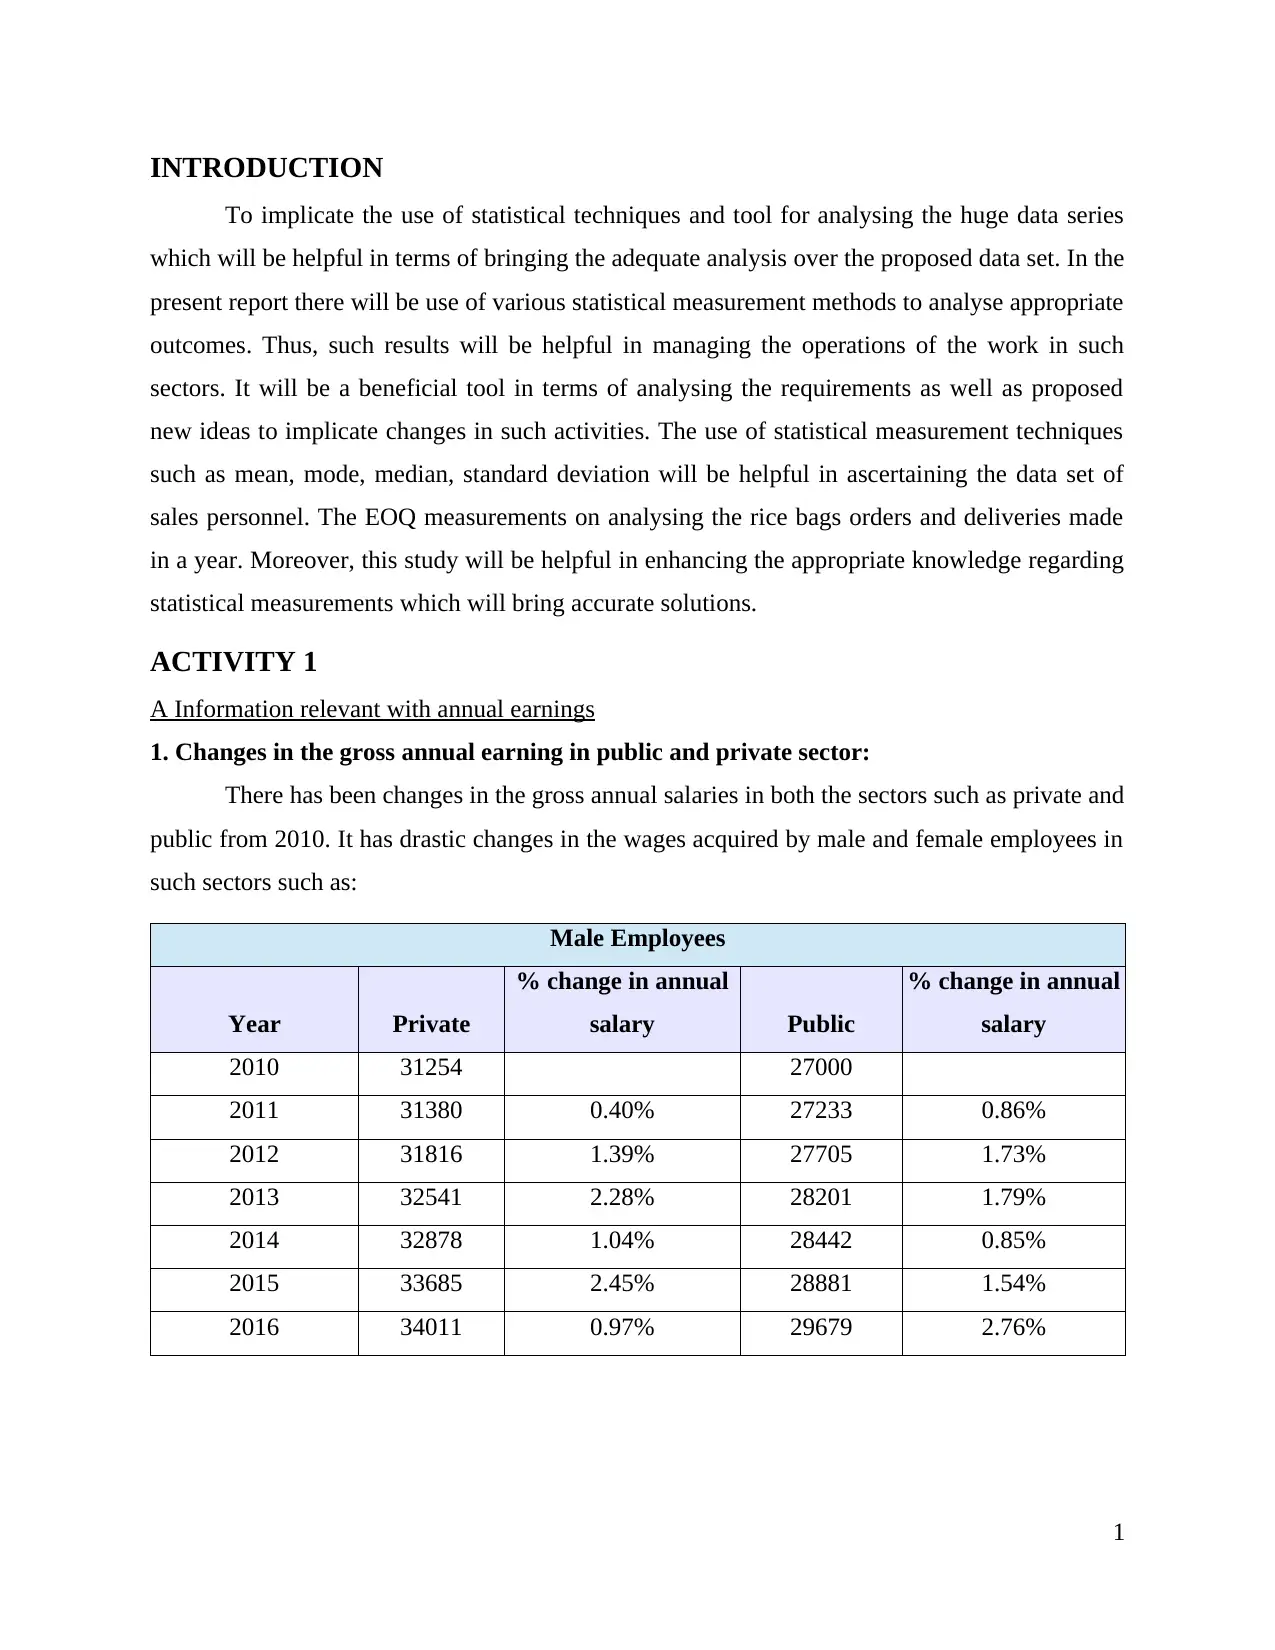
1. Changes in the gross annual earning in public and private sector:
There has been changes in the gross annual salaries in both the sectors such as private and
public from 2010. It has drastic changes in the wages acquired by male and female employees in
such sectors such as:
Male Employees
Year Private
% change in annual
salary Public
% change in annual
salary
2010 31254 27000
2011 31380 0.40% 27233 0.86%
2012 31816 1.39% 27705 1.73%
2013 32541 2.28% 28201 1.79%
2014 32878 1.04% 28442 0.85%
2015 33685 2.45% 28881 1.54%
2016 34011 0.97% 29679 2.76%
1
To implicate the use of statistical techniques and tool for analysing the huge data series
which will be helpful in terms of bringing the adequate analysis over the proposed data set. In the
present report there will be use of various statistical measurement methods to analyse appropriate
outcomes. Thus, such results will be helpful in managing the operations of the work in such
sectors. It will be a beneficial tool in terms of analysing the requirements as well as proposed
new ideas to implicate changes in such activities. The use of statistical measurement techniques
such as mean, mode, median, standard deviation will be helpful in ascertaining the data set of
sales personnel. The EOQ measurements on analysing the rice bags orders and deliveries made
in a year. Moreover, this study will be helpful in enhancing the appropriate knowledge regarding
statistical measurements which will bring accurate solutions.
ACTIVITY 1
A Information relevant with annual earnings
1. Changes in the gross annual earning in public and private sector:
There has been changes in the gross annual salaries in both the sectors such as private and
public from 2010. It has drastic changes in the wages acquired by male and female employees in
such sectors such as:
Male Employees
Year Private
% change in annual
salary Public
% change in annual
salary
2010 31254 27000
2011 31380 0.40% 27233 0.86%
2012 31816 1.39% 27705 1.73%
2013 32541 2.28% 28201 1.79%
2014 32878 1.04% 28442 0.85%
2015 33685 2.45% 28881 1.54%
2016 34011 0.97% 29679 2.76%
1
⊘ This is a preview!⊘
Do you want full access?
Subscribe today to unlock all pages.
Trusted by 1+ million students worldwide
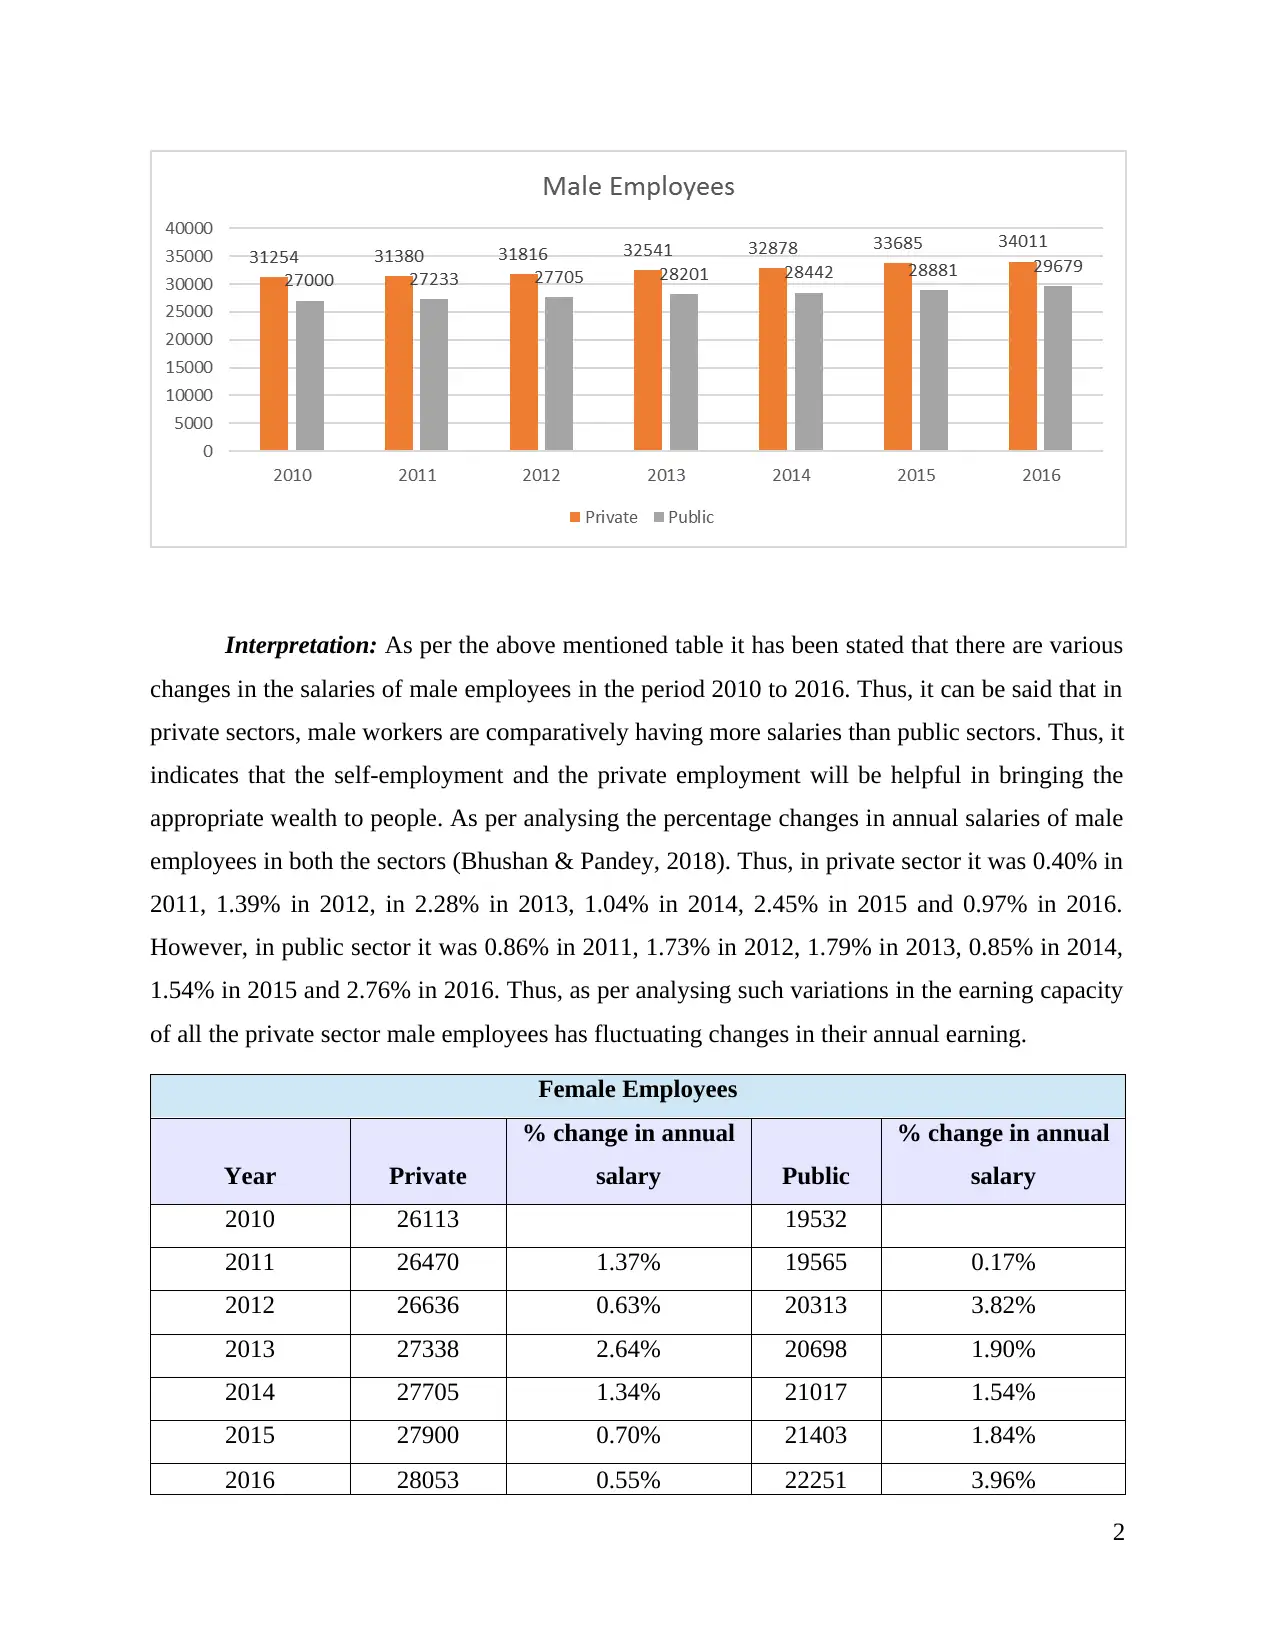
Interpretation: As per the above mentioned table it has been stated that there are various
changes in the salaries of male employees in the period 2010 to 2016. Thus, it can be said that in
private sectors, male workers are comparatively having more salaries than public sectors. Thus, it
indicates that the self-employment and the private employment will be helpful in bringing the
appropriate wealth to people. As per analysing the percentage changes in annual salaries of male
employees in both the sectors (Bhushan & Pandey, 2018). Thus, in private sector it was 0.40% in
2011, 1.39% in 2012, in 2.28% in 2013, 1.04% in 2014, 2.45% in 2015 and 0.97% in 2016.
However, in public sector it was 0.86% in 2011, 1.73% in 2012, 1.79% in 2013, 0.85% in 2014,
1.54% in 2015 and 2.76% in 2016. Thus, as per analysing such variations in the earning capacity
of all the private sector male employees has fluctuating changes in their annual earning.
Female Employees
Year Private
% change in annual
salary Public
% change in annual
salary
2010 26113 19532
2011 26470 1.37% 19565 0.17%
2012 26636 0.63% 20313 3.82%
2013 27338 2.64% 20698 1.90%
2014 27705 1.34% 21017 1.54%
2015 27900 0.70% 21403 1.84%
2016 28053 0.55% 22251 3.96%
2
Paraphrase This Document
Need a fresh take? Get an instant paraphrase of this document with our AI Paraphraser
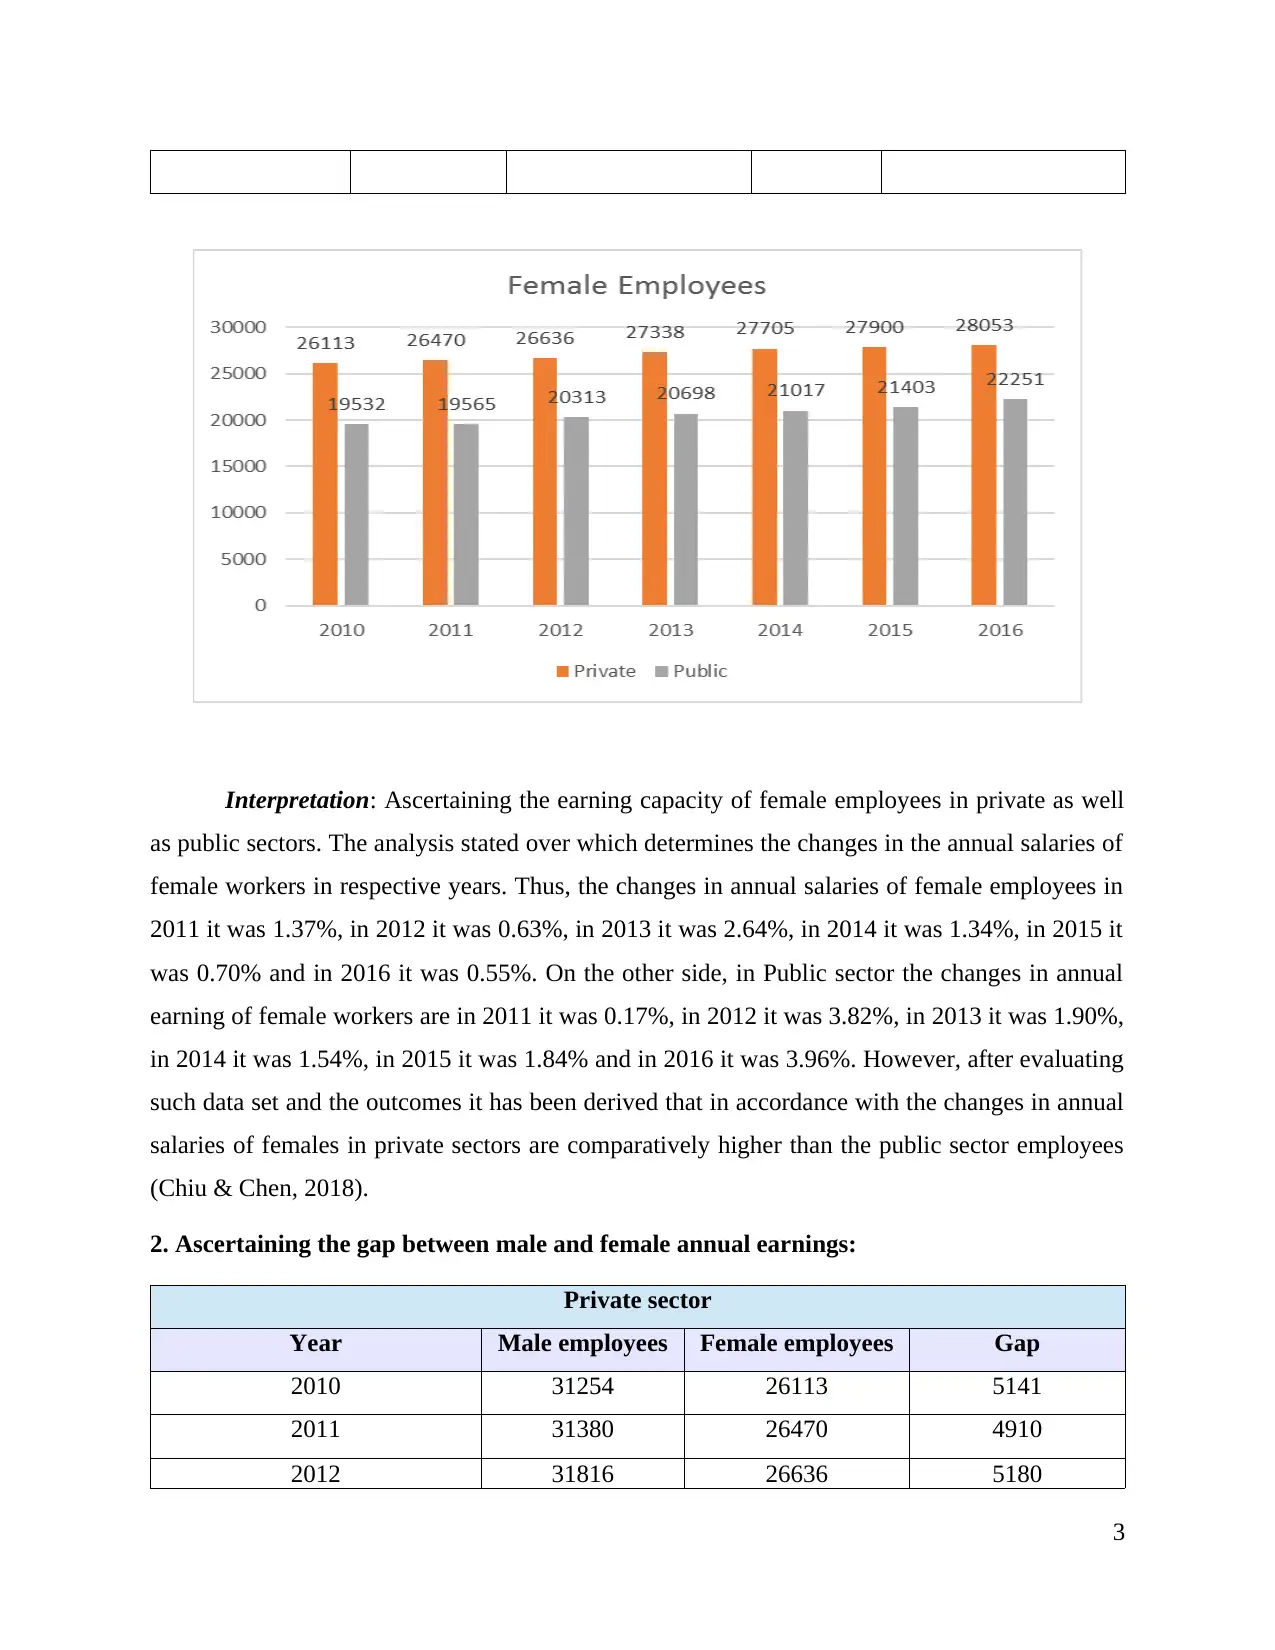
Interpretation: Ascertaining the earning capacity of female employees in private as well
as public sectors. The analysis stated over which determines the changes in the annual salaries of
female workers in respective years. Thus, the changes in annual salaries of female employees in
2011 it was 1.37%, in 2012 it was 0.63%, in 2013 it was 2.64%, in 2014 it was 1.34%, in 2015 it
was 0.70% and in 2016 it was 0.55%. On the other side, in Public sector the changes in annual
earning of female workers are in 2011 it was 0.17%, in 2012 it was 3.82%, in 2013 it was 1.90%,
in 2014 it was 1.54%, in 2015 it was 1.84% and in 2016 it was 3.96%. However, after evaluating
such data set and the outcomes it has been derived that in accordance with the changes in annual
salaries of females in private sectors are comparatively higher than the public sector employees
(Chiu & Chen, 2018).
2. Ascertaining the gap between male and female annual earnings:
Private sector
Year Male employees Female employees Gap
2010 31254 26113 5141
2011 31380 26470 4910
2012 31816 26636 5180
3
2013 32541 27338 5203
2014 32878 27705 5173
2015 33685 27900 5785
2016 34011 28053 5958
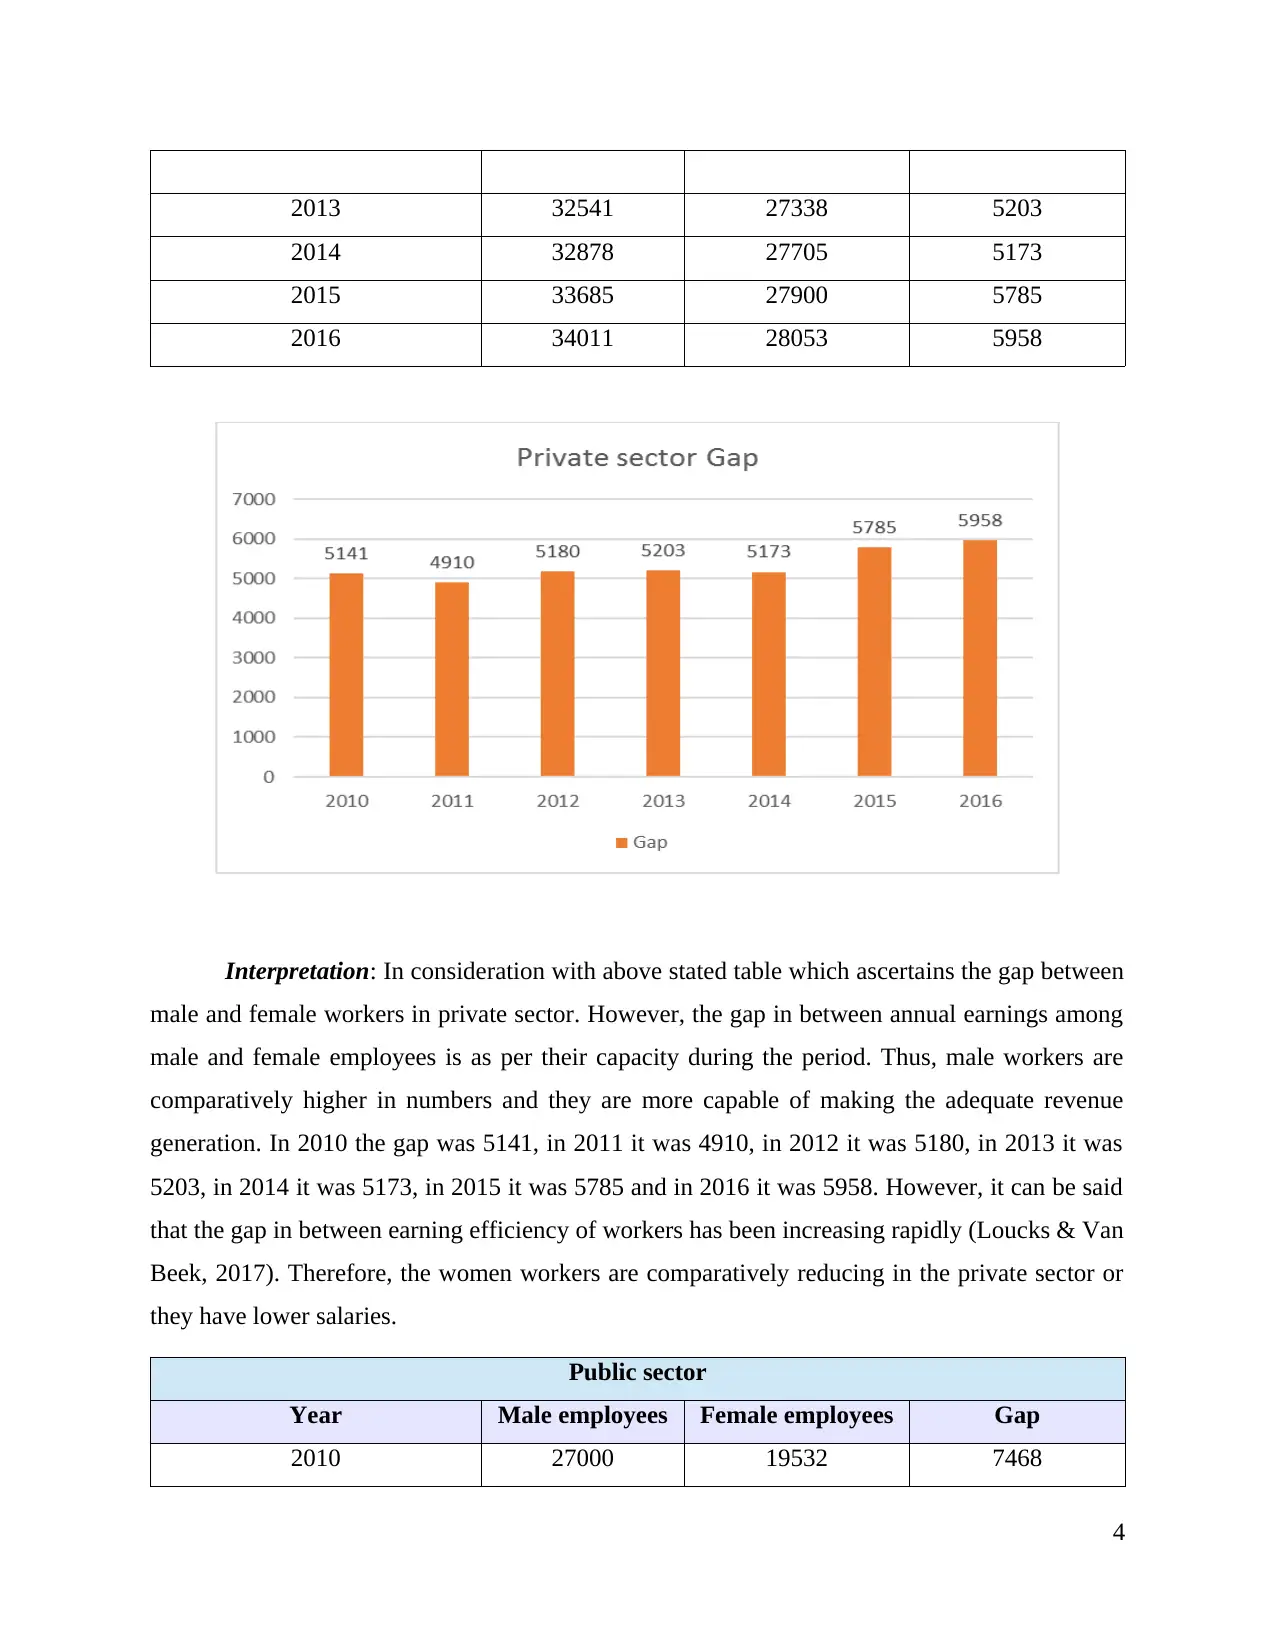
Interpretation: In consideration with above stated table which ascertains the gap between
male and female workers in private sector. However, the gap in between annual earnings among
male and female employees is as per their capacity during the period. Thus, male workers are
comparatively higher in numbers and they are more capable of making the adequate revenue
generation. In 2010 the gap was 5141, in 2011 it was 4910, in 2012 it was 5180, in 2013 it was
5203, in 2014 it was 5173, in 2015 it was 5785 and in 2016 it was 5958. However, it can be said
that the gap in between earning efficiency of workers has been increasing rapidly (Loucks & Van
Beek, 2017). Therefore, the women workers are comparatively reducing in the private sector or
they have lower salaries.
Public sector
Year Male employees Female employees Gap
2010 27000 19532 7468
4
2014 32878 27705 5173
2015 33685 27900 5785
2016 34011 28053 5958
Interpretation: In consideration with above stated table which ascertains the gap between
male and female workers in private sector. However, the gap in between annual earnings among
male and female employees is as per their capacity during the period. Thus, male workers are
comparatively higher in numbers and they are more capable of making the adequate revenue
generation. In 2010 the gap was 5141, in 2011 it was 4910, in 2012 it was 5180, in 2013 it was
5203, in 2014 it was 5173, in 2015 it was 5785 and in 2016 it was 5958. However, it can be said
that the gap in between earning efficiency of workers has been increasing rapidly (Loucks & Van
Beek, 2017). Therefore, the women workers are comparatively reducing in the private sector or
they have lower salaries.
Public sector
Year Male employees Female employees Gap
2010 27000 19532 7468
4
⊘ This is a preview!⊘
Do you want full access?
Subscribe today to unlock all pages.
Trusted by 1+ million students worldwide
2011 27233 19565 7668
2012 27705 20313 7392
2013 28201 20698 7503
2014 28442 21017 7425
2015 28881 21403 7478
2016 29679 22251 7428
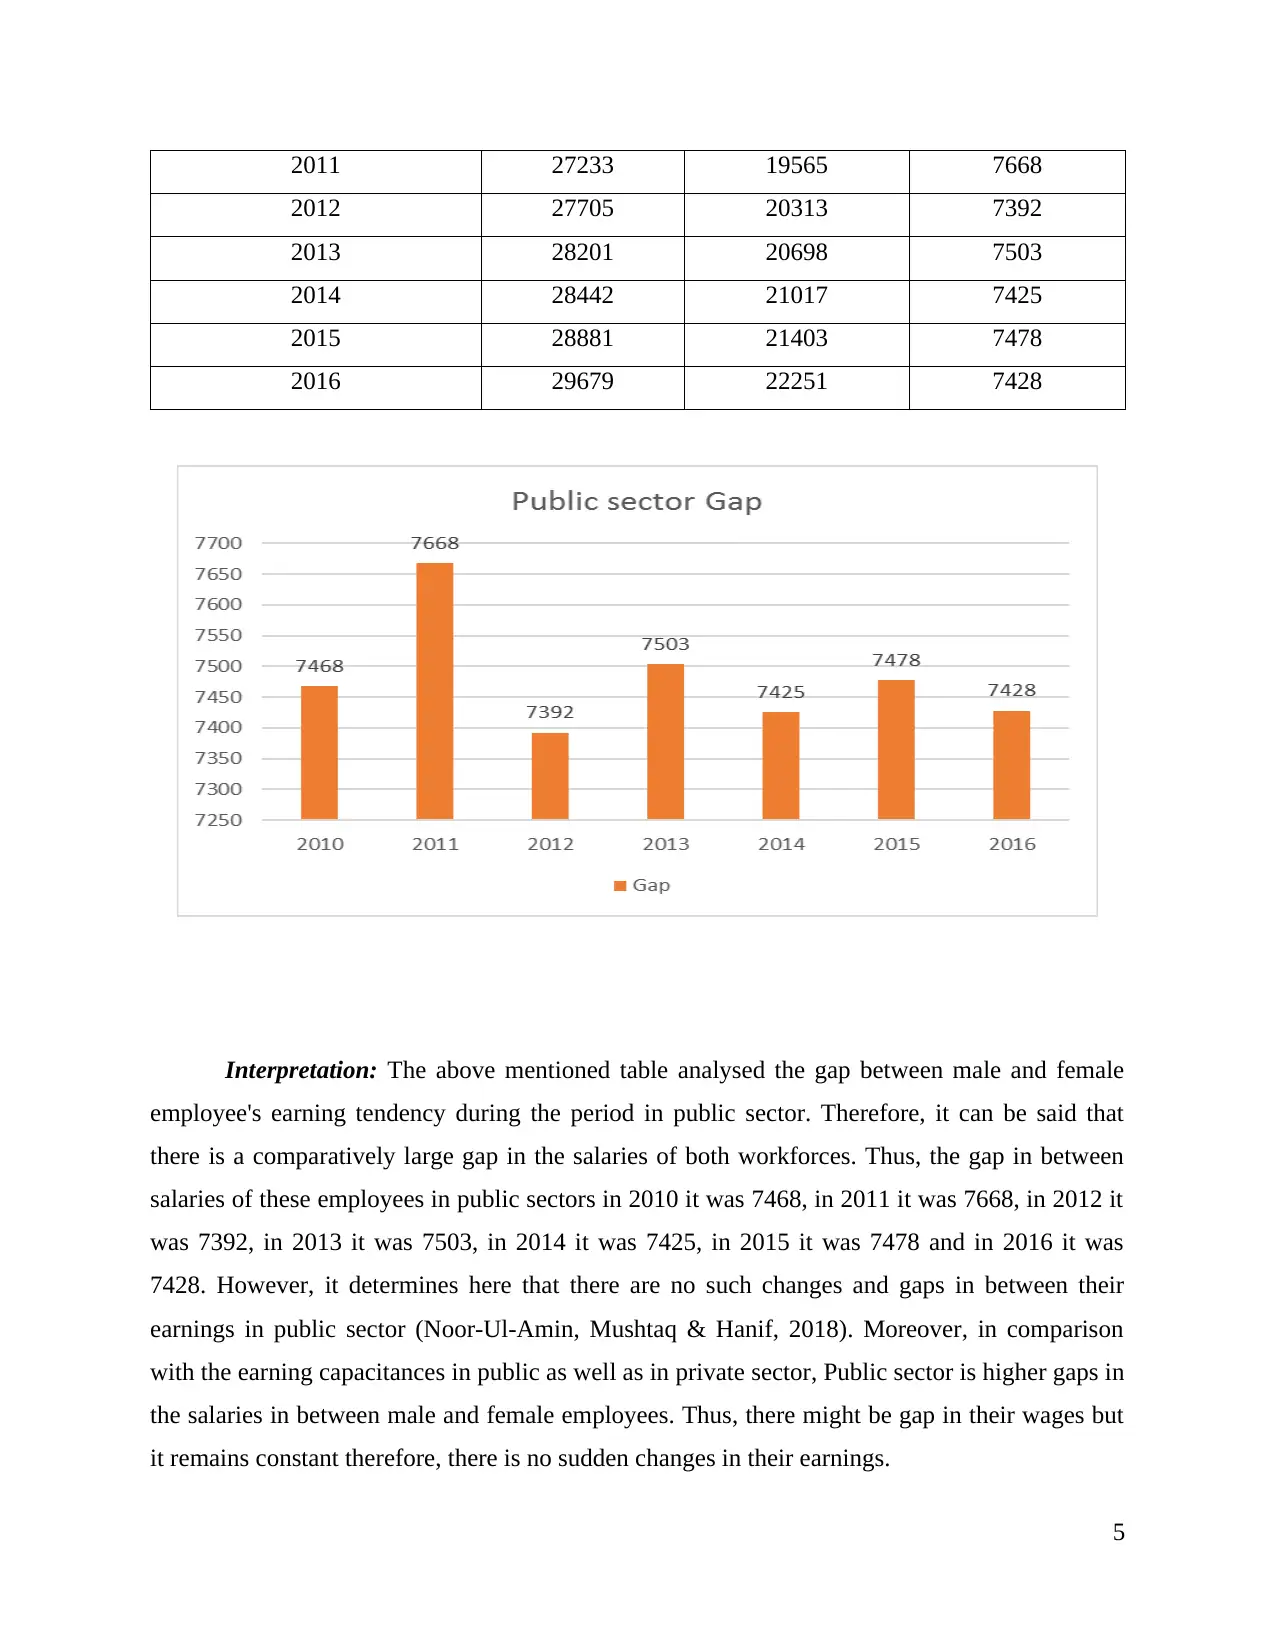
Interpretation: The above mentioned table analysed the gap between male and female
employee's earning tendency during the period in public sector. Therefore, it can be said that
there is a comparatively large gap in the salaries of both workforces. Thus, the gap in between
salaries of these employees in public sectors in 2010 it was 7468, in 2011 it was 7668, in 2012 it
was 7392, in 2013 it was 7503, in 2014 it was 7425, in 2015 it was 7478 and in 2016 it was
7428. However, it determines here that there are no such changes and gaps in between their
earnings in public sector (Noor-Ul-Amin, Mushtaq & Hanif, 2018). Moreover, in comparison
with the earning capacitances in public as well as in private sector, Public sector is higher gaps in
the salaries in between male and female employees. Thus, there might be gap in their wages but
it remains constant therefore, there is no sudden changes in their earnings.
5
2012 27705 20313 7392
2013 28201 20698 7503
2014 28442 21017 7425
2015 28881 21403 7478
2016 29679 22251 7428
Interpretation: The above mentioned table analysed the gap between male and female
employee's earning tendency during the period in public sector. Therefore, it can be said that
there is a comparatively large gap in the salaries of both workforces. Thus, the gap in between
salaries of these employees in public sectors in 2010 it was 7468, in 2011 it was 7668, in 2012 it
was 7392, in 2013 it was 7503, in 2014 it was 7425, in 2015 it was 7478 and in 2016 it was
7428. However, it determines here that there are no such changes and gaps in between their
earnings in public sector (Noor-Ul-Amin, Mushtaq & Hanif, 2018). Moreover, in comparison
with the earning capacitances in public as well as in private sector, Public sector is higher gaps in
the salaries in between male and female employees. Thus, there might be gap in their wages but
it remains constant therefore, there is no sudden changes in their earnings.
5
Paraphrase This Document
Need a fresh take? Get an instant paraphrase of this document with our AI Paraphraser
M1
The gender pay gap is the average difference between the remuneration for men and
women who are working. Women are generally paid less than men. There are various the
important sources which provide information about gender gap such as National magazine,
various media sources and journals of researchers. These major sources will provide information
on the basis of their research and also provides secondary analysis which is used by scholar for
completion of study. Currently as per analysing the outcomes of office of national statistics
which insists that there have been impact of variations in the operational efforts of employees
stated in the environment. However, as per recent results and outcomes which insists that the
full- employment rate which is stand at 9.1% for male employees. However, there are
comparatively higher efficient and wealthy as compared with the women workers stated in the
society.
D1
Descriptive Exploratory Confirmation
Descriptive rescission is
analysed as research that
explore and explain an
individual, group or situation
It means research means a
research conducted for
formulating problems for more
clear investigation.
It is considered an effective
research which can be used by
scholar for conducting
research. In these researchers
have a pretty good idea of
what's going on. That is,
researcher has theory and
objective to find out the gender
gap if theory is supported by
the facts.
B. Analysing the gross annual earnings by industry sector on Office of National Statistics
website
1. Determining the gap between education and finance:
6
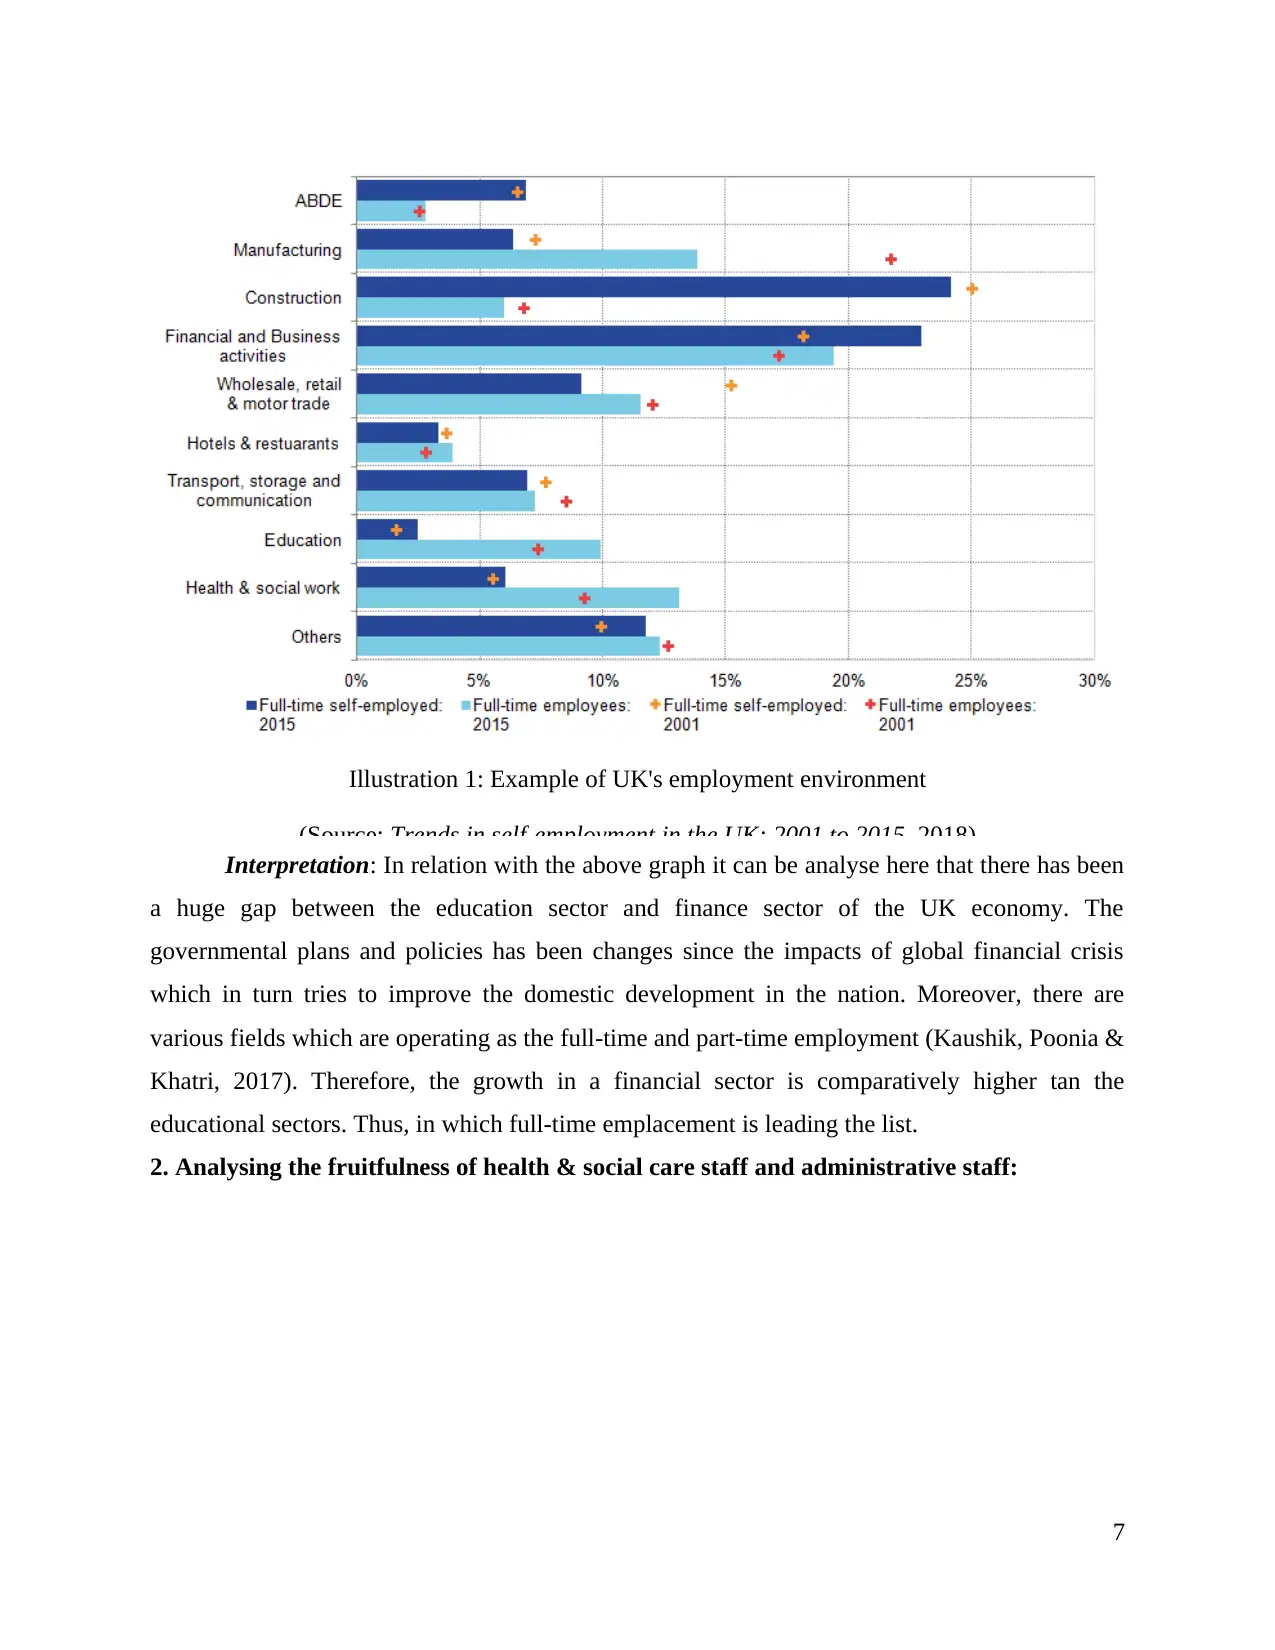
Illustration 1: Example of UK's employment environment
(Source: Trends in self-employment in the UK: 2001 to 2015, 2018)
Interpretation: In relation with the above graph it can be analyse here that there has been
a huge gap between the education sector and finance sector of the UK economy. The
governmental plans and policies has been changes since the impacts of global financial crisis
which in turn tries to improve the domestic development in the nation. Moreover, there are
various fields which are operating as the full-time and part-time employment (Kaushik, Poonia &
Khatri, 2017). Therefore, the growth in a financial sector is comparatively higher tan the
educational sectors. Thus, in which full-time emplacement is leading the list.
2. Analysing the fruitfulness of health & social care staff and administrative staff:
7
⊘ This is a preview!⊘
Do you want full access?
Subscribe today to unlock all pages.
Trusted by 1+ million students worldwide
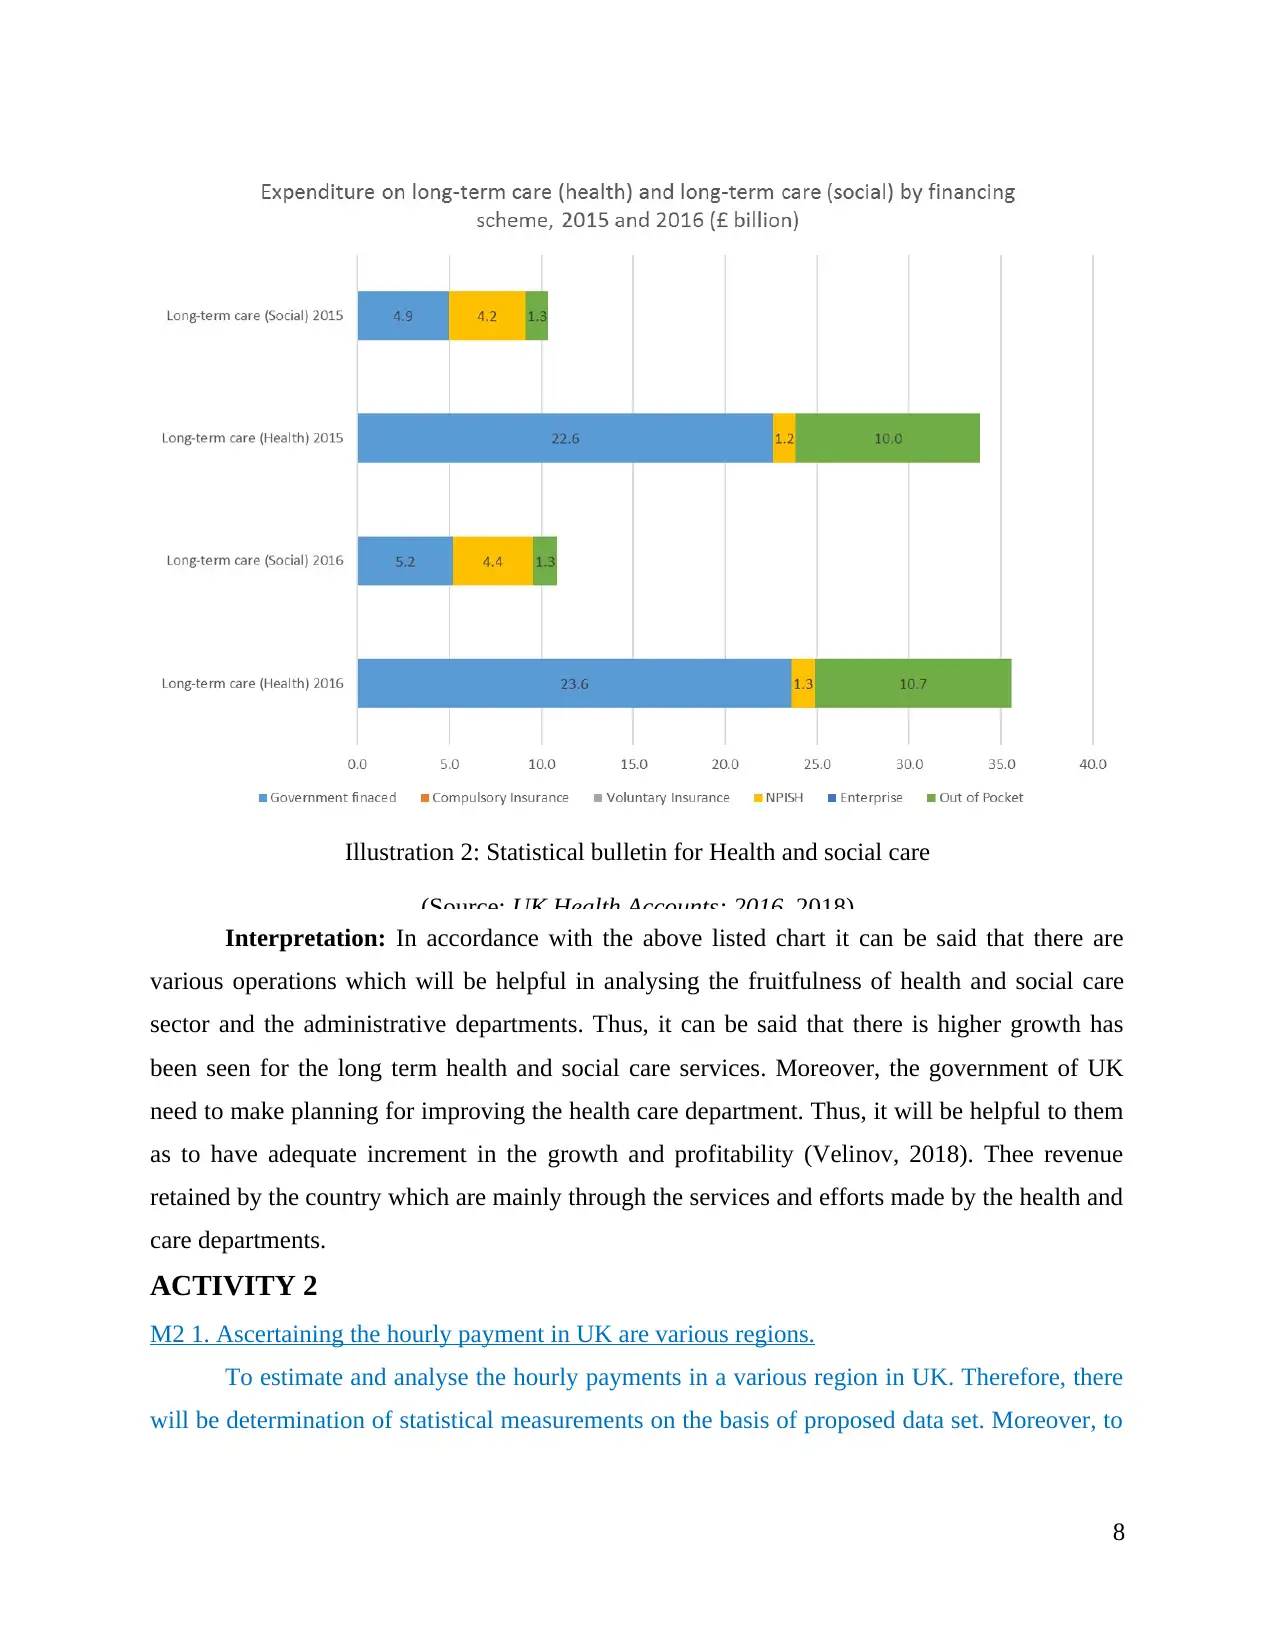
Illustration 2: Statistical bulletin for Health and social care
(Source: UK Health Accounts: 2016, 2018)
Interpretation: In accordance with the above listed chart it can be said that there are
various operations which will be helpful in analysing the fruitfulness of health and social care
sector and the administrative departments. Thus, it can be said that there is higher growth has
been seen for the long term health and social care services. Moreover, the government of UK
need to make planning for improving the health care department. Thus, it will be helpful to them
as to have adequate increment in the growth and profitability (Velinov, 2018). Thee revenue
retained by the country which are mainly through the services and efforts made by the health and
care departments.
ACTIVITY 2
M2 1. Ascertaining the hourly payment in UK are various regions.
To estimate and analyse the hourly payments in a various region in UK. Therefore, there
will be determination of statistical measurements on the basis of proposed data set. Moreover, to
8
Paraphrase This Document
Need a fresh take? Get an instant paraphrase of this document with our AI Paraphraser
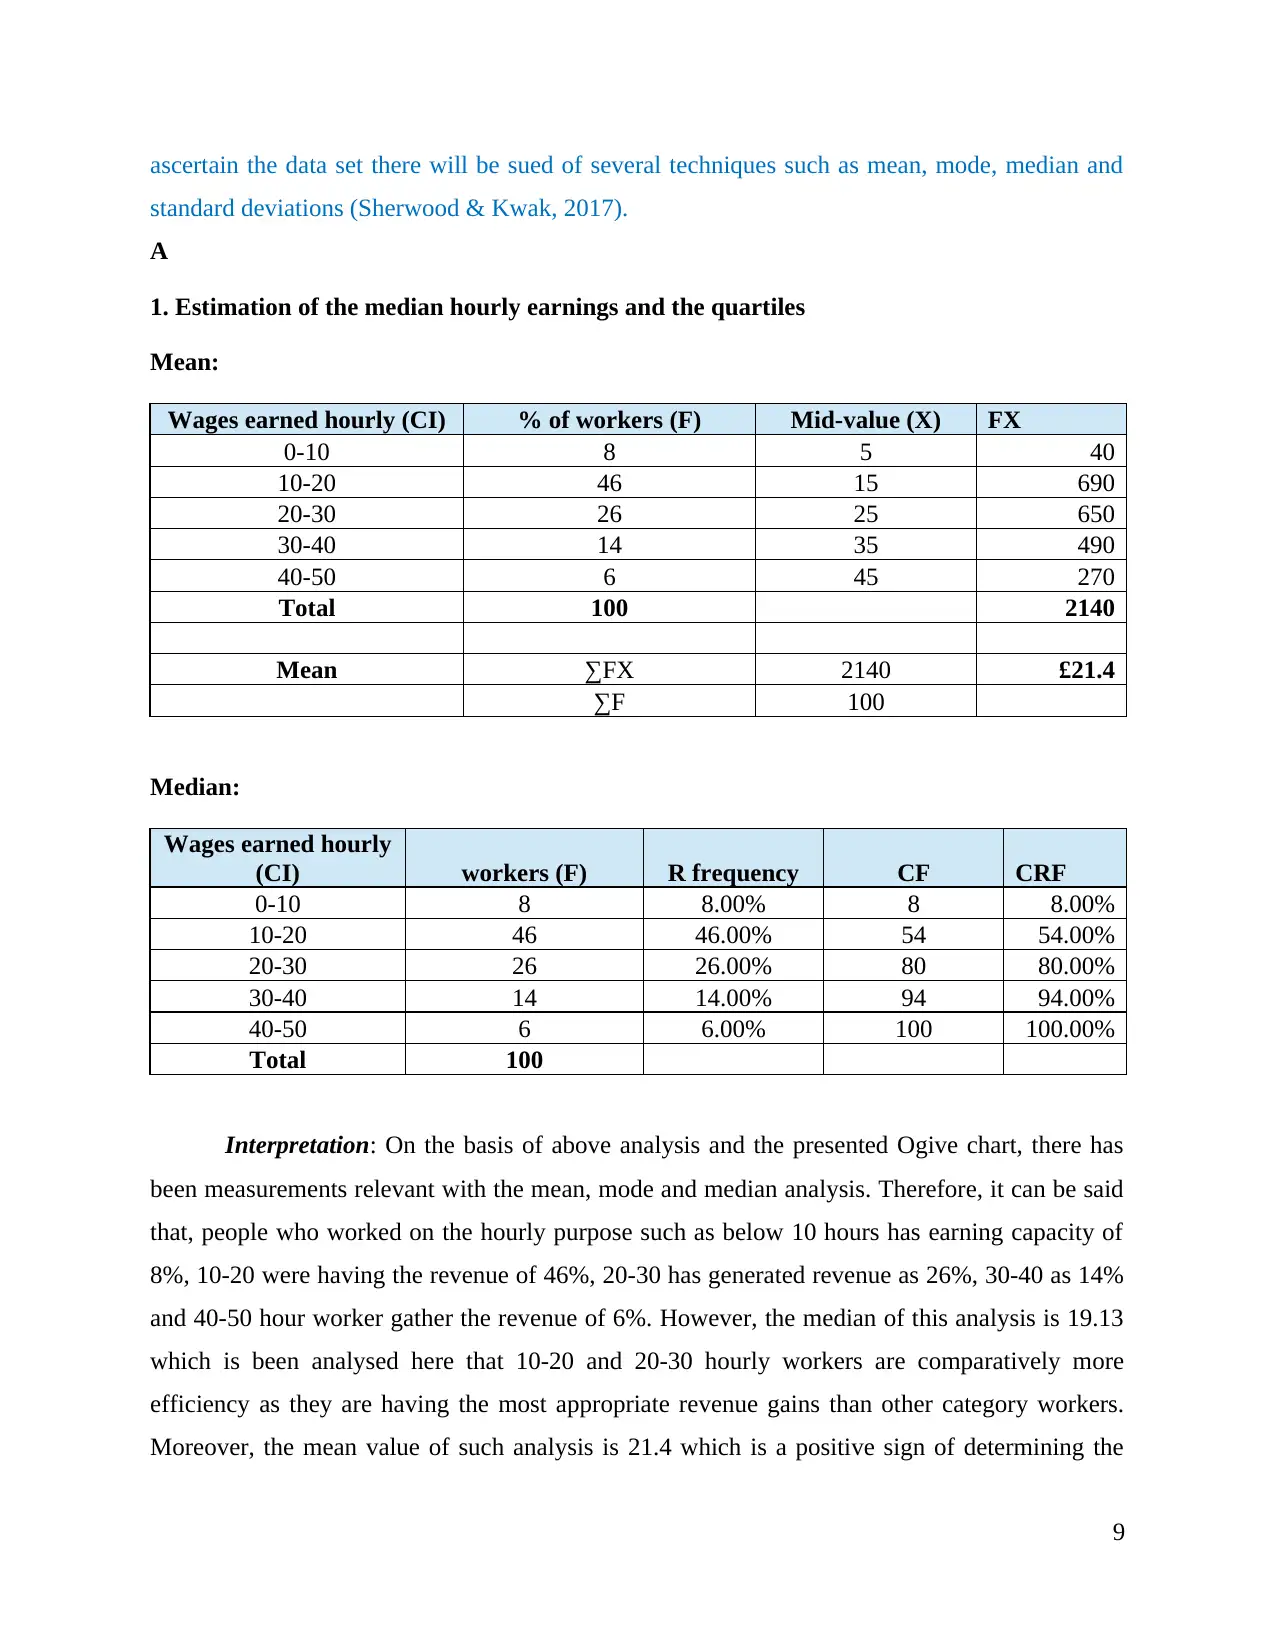
ascertain the data set there will be sued of several techniques such as mean, mode, median and
standard deviations (Sherwood & Kwak, 2017).
A
1. Estimation of the median hourly earnings and the quartiles
Mean:
Wages earned hourly (CI) % of workers (F) Mid-value (X) FX
0-10 8 5 40
10-20 46 15 690
20-30 26 25 650
30-40 14 35 490
40-50 6 45 270
Total 100 2140
Mean ∑FX 2140 £21.4
∑F 100
Median:
Wages earned hourly
(CI) workers (F) R frequency CF CRF
0-10 8 8.00% 8 8.00%
10-20 46 46.00% 54 54.00%
20-30 26 26.00% 80 80.00%
30-40 14 14.00% 94 94.00%
40-50 6 6.00% 100 100.00%
Total 100
Interpretation: On the basis of above analysis and the presented Ogive chart, there has
been measurements relevant with the mean, mode and median analysis. Therefore, it can be said
that, people who worked on the hourly purpose such as below 10 hours has earning capacity of
8%, 10-20 were having the revenue of 46%, 20-30 has generated revenue as 26%, 30-40 as 14%
and 40-50 hour worker gather the revenue of 6%. However, the median of this analysis is 19.13
which is been analysed here that 10-20 and 20-30 hourly workers are comparatively more
efficiency as they are having the most appropriate revenue gains than other category workers.
Moreover, the mean value of such analysis is 21.4 which is a positive sign of determining the
9
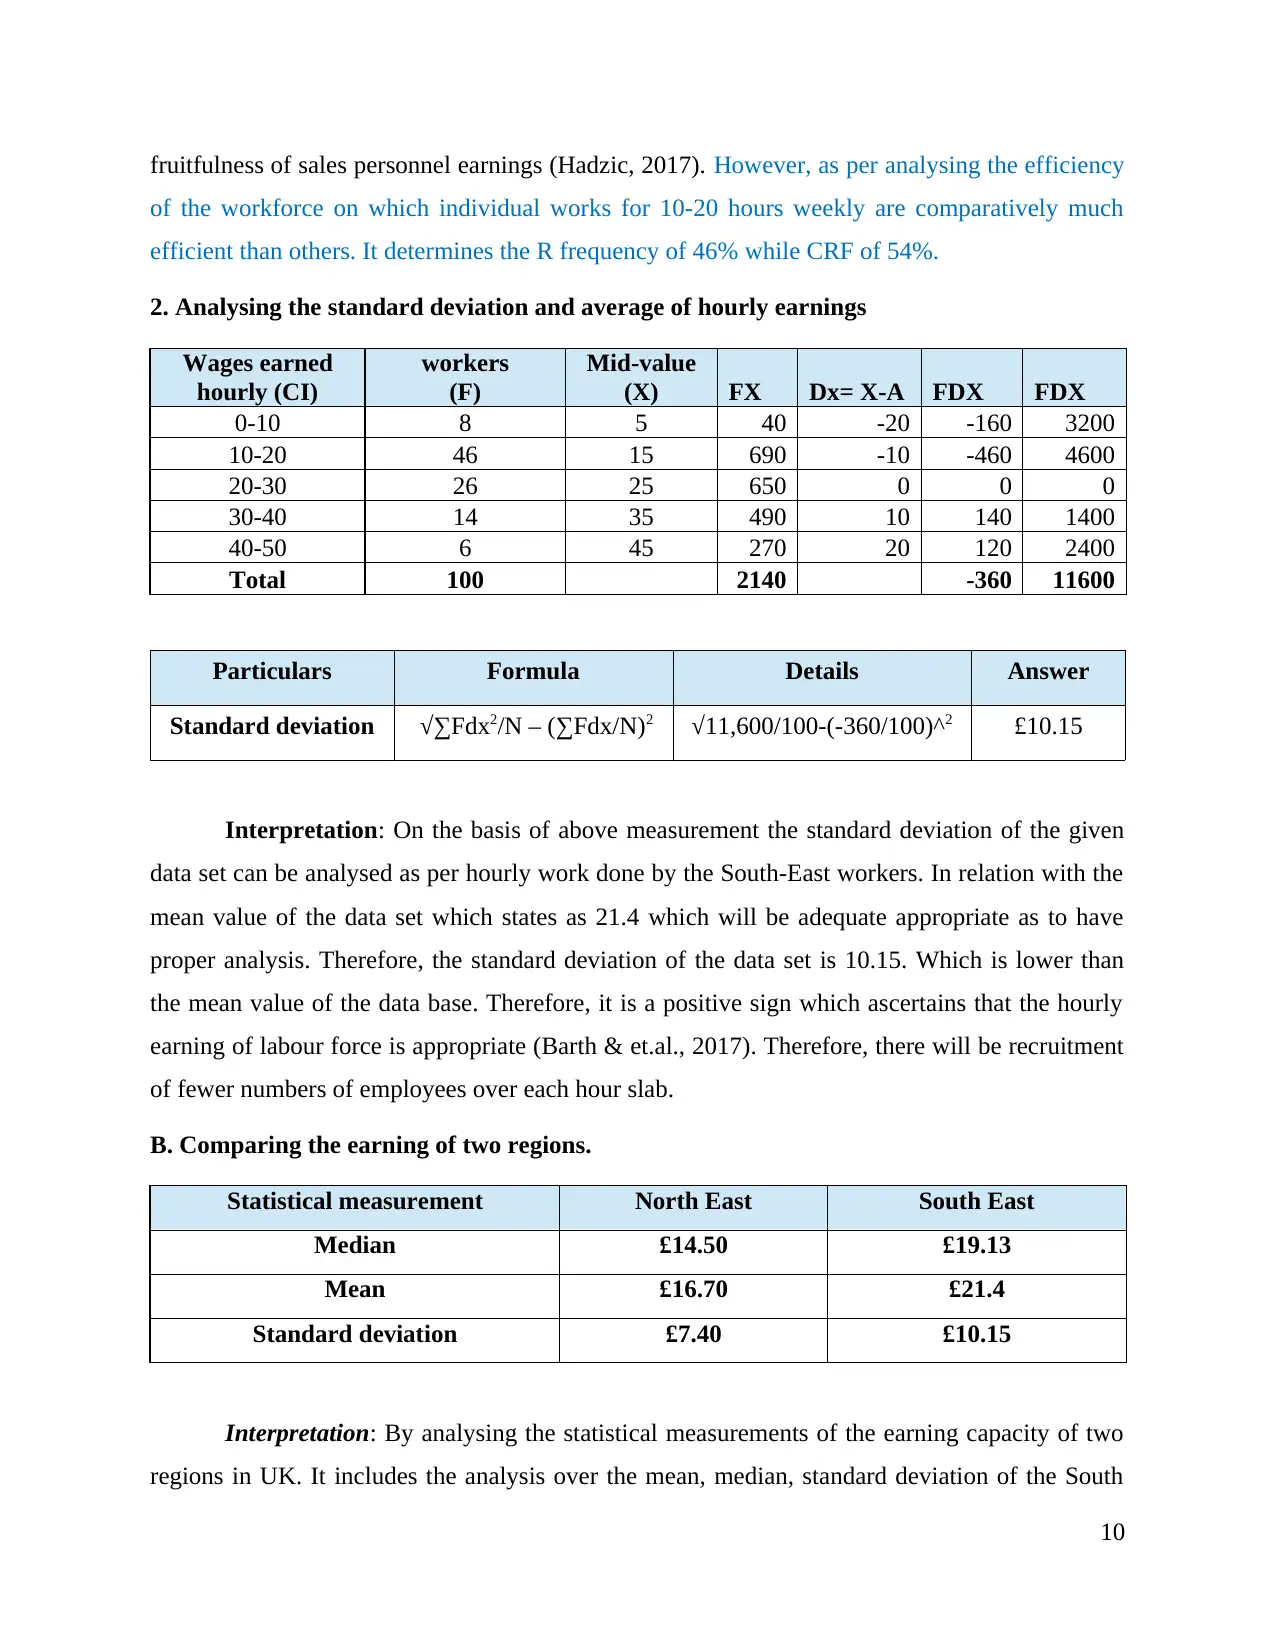
fruitfulness of sales personnel earnings (Hadzic, 2017). However, as per analysing the efficiency
of the workforce on which individual works for 10-20 hours weekly are comparatively much
efficient than others. It determines the R frequency of 46% while CRF of 54%.
2. Analysing the standard deviation and average of hourly earnings
Wages earned
hourly (CI)
workers
(F)
Mid-value
(X) FX Dx= X-A FDX FDX
0-10 8 5 40 -20 -160 3200
10-20 46 15 690 -10 -460 4600
20-30 26 25 650 0 0 0
30-40 14 35 490 10 140 1400
40-50 6 45 270 20 120 2400
Total 100 2140 -360 11600
Particulars Formula Details Answer
Standard deviation √∑Fdx2/N – (∑Fdx/N)2 √11,600/100-(-360/100)^2 £10.15
Interpretation: On the basis of above measurement the standard deviation of the given
data set can be analysed as per hourly work done by the South-East workers. In relation with the
mean value of the data set which states as 21.4 which will be adequate appropriate as to have
proper analysis. Therefore, the standard deviation of the data set is 10.15. Which is lower than
the mean value of the data base. Therefore, it is a positive sign which ascertains that the hourly
earning of labour force is appropriate (Barth & et.al., 2017). Therefore, there will be recruitment
of fewer numbers of employees over each hour slab.
B. Comparing the earning of two regions.
Statistical measurement North East South East
Median £14.50 £19.13
Mean £16.70 £21.4
Standard deviation £7.40 £10.15
Interpretation: By analysing the statistical measurements of the earning capacity of two
regions in UK. It includes the analysis over the mean, median, standard deviation of the South
10
⊘ This is a preview!⊘
Do you want full access?
Subscribe today to unlock all pages.
Trusted by 1+ million students worldwide
1 out of 21
Related Documents


Your All-in-One AI-Powered Toolkit for Academic Success.
+13062052269
info@desklib.com
Available 24*7 on WhatsApp / Email
![[object Object]](/_next/static/media/star-bottom.7253800d.svg)
Unlock your academic potential
Copyright © 2020–2026 A2Z Services. All Rights Reserved. Developed and managed by ZUCOL.