Statistics for Management: Data Analysis, Interpretation and Examples
VerifiedAdded on 2023/01/19
|23
|2067
|55
Report
AI Summary
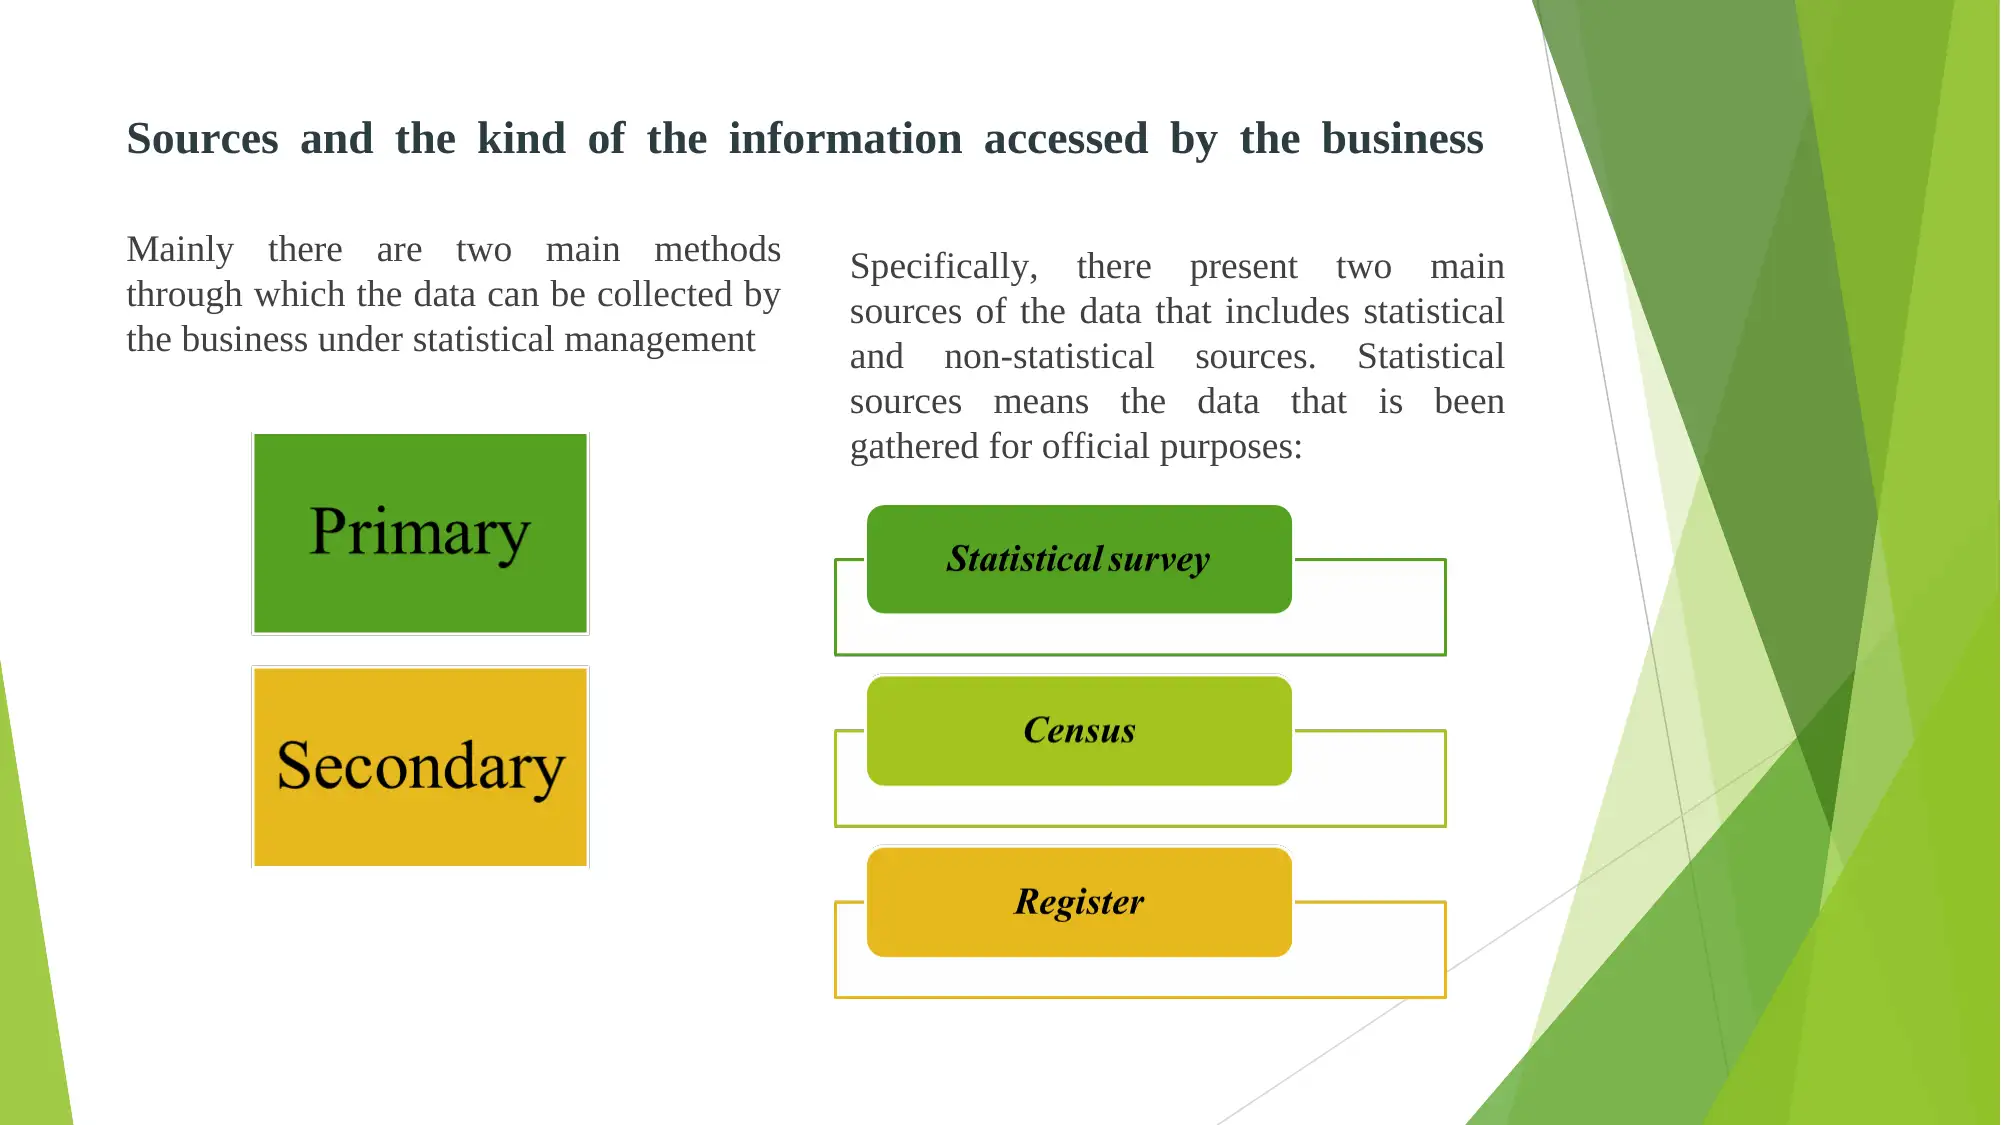
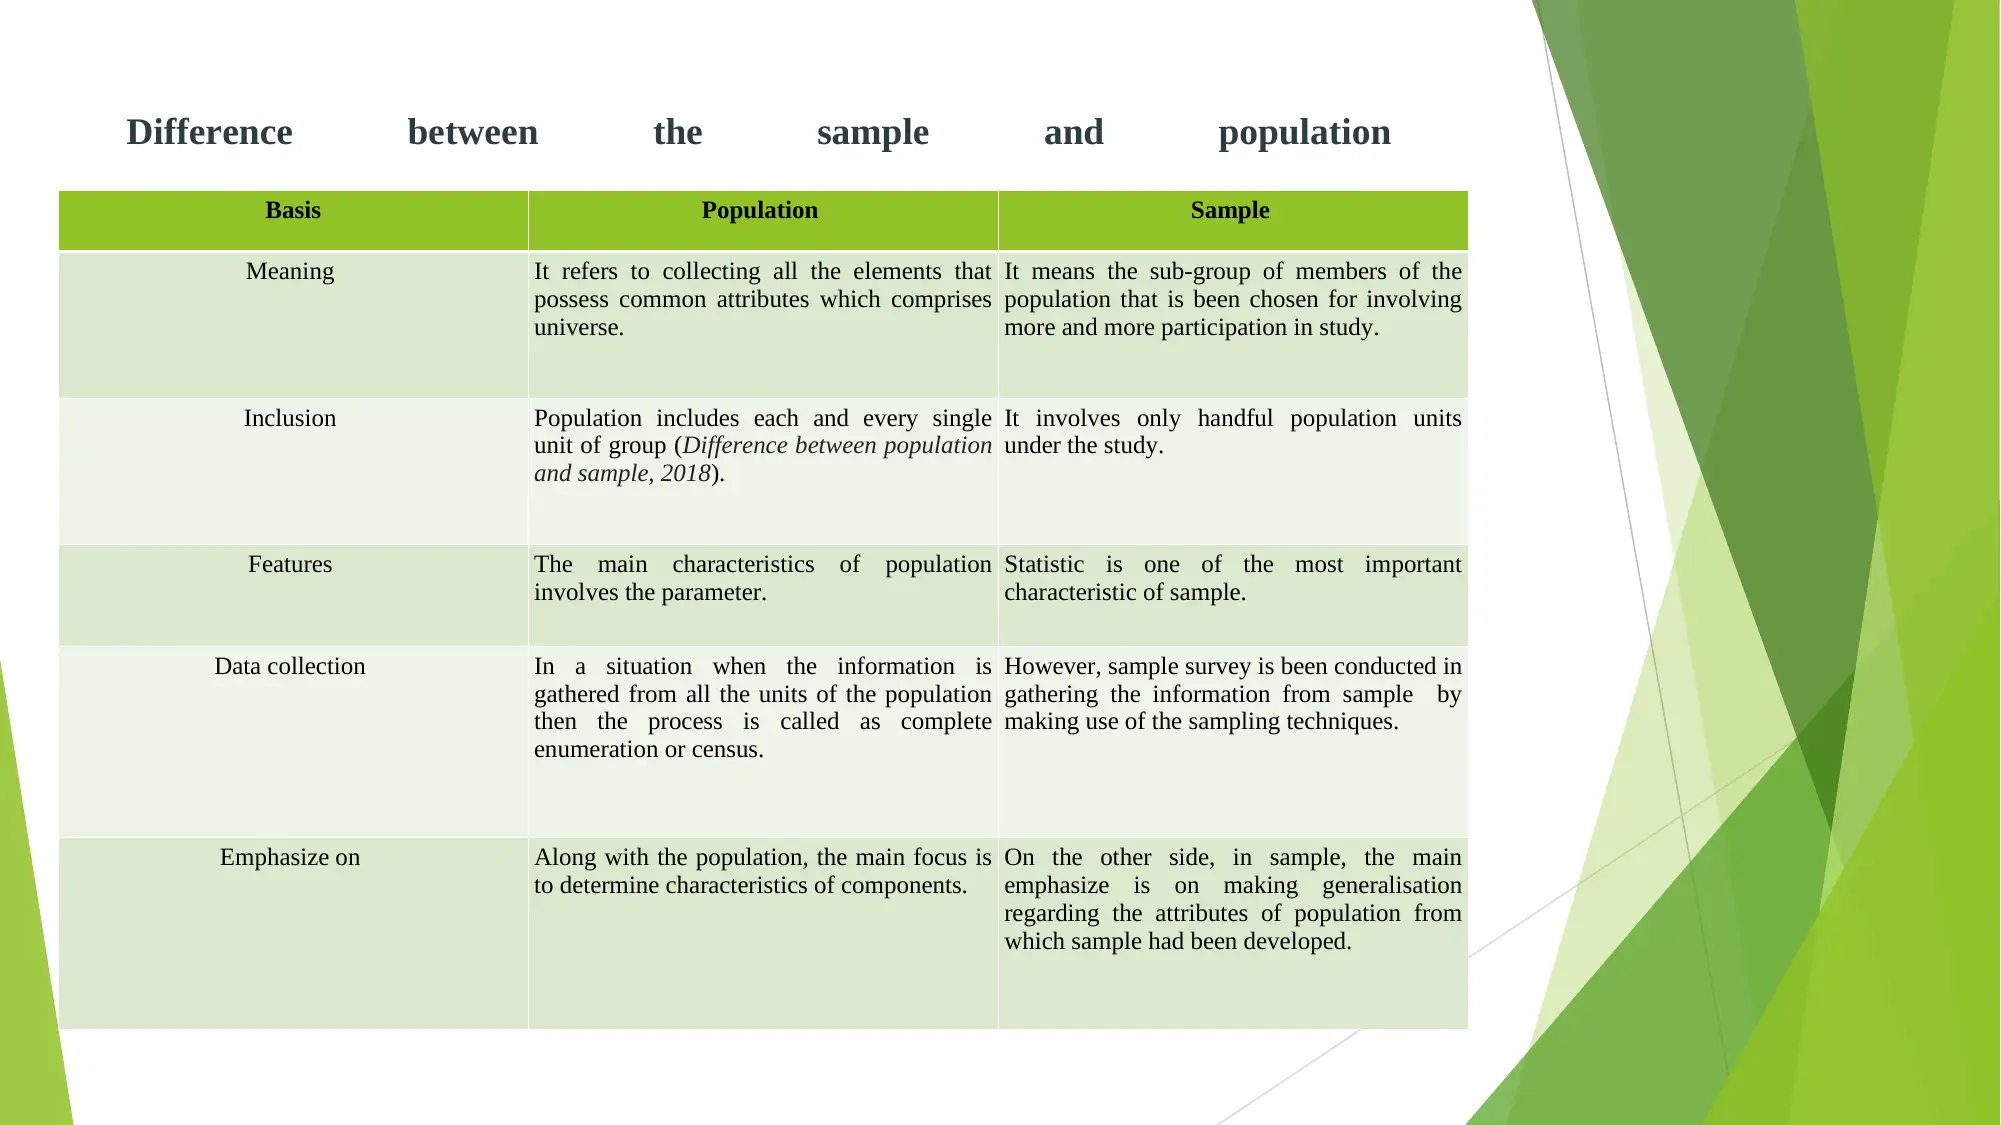
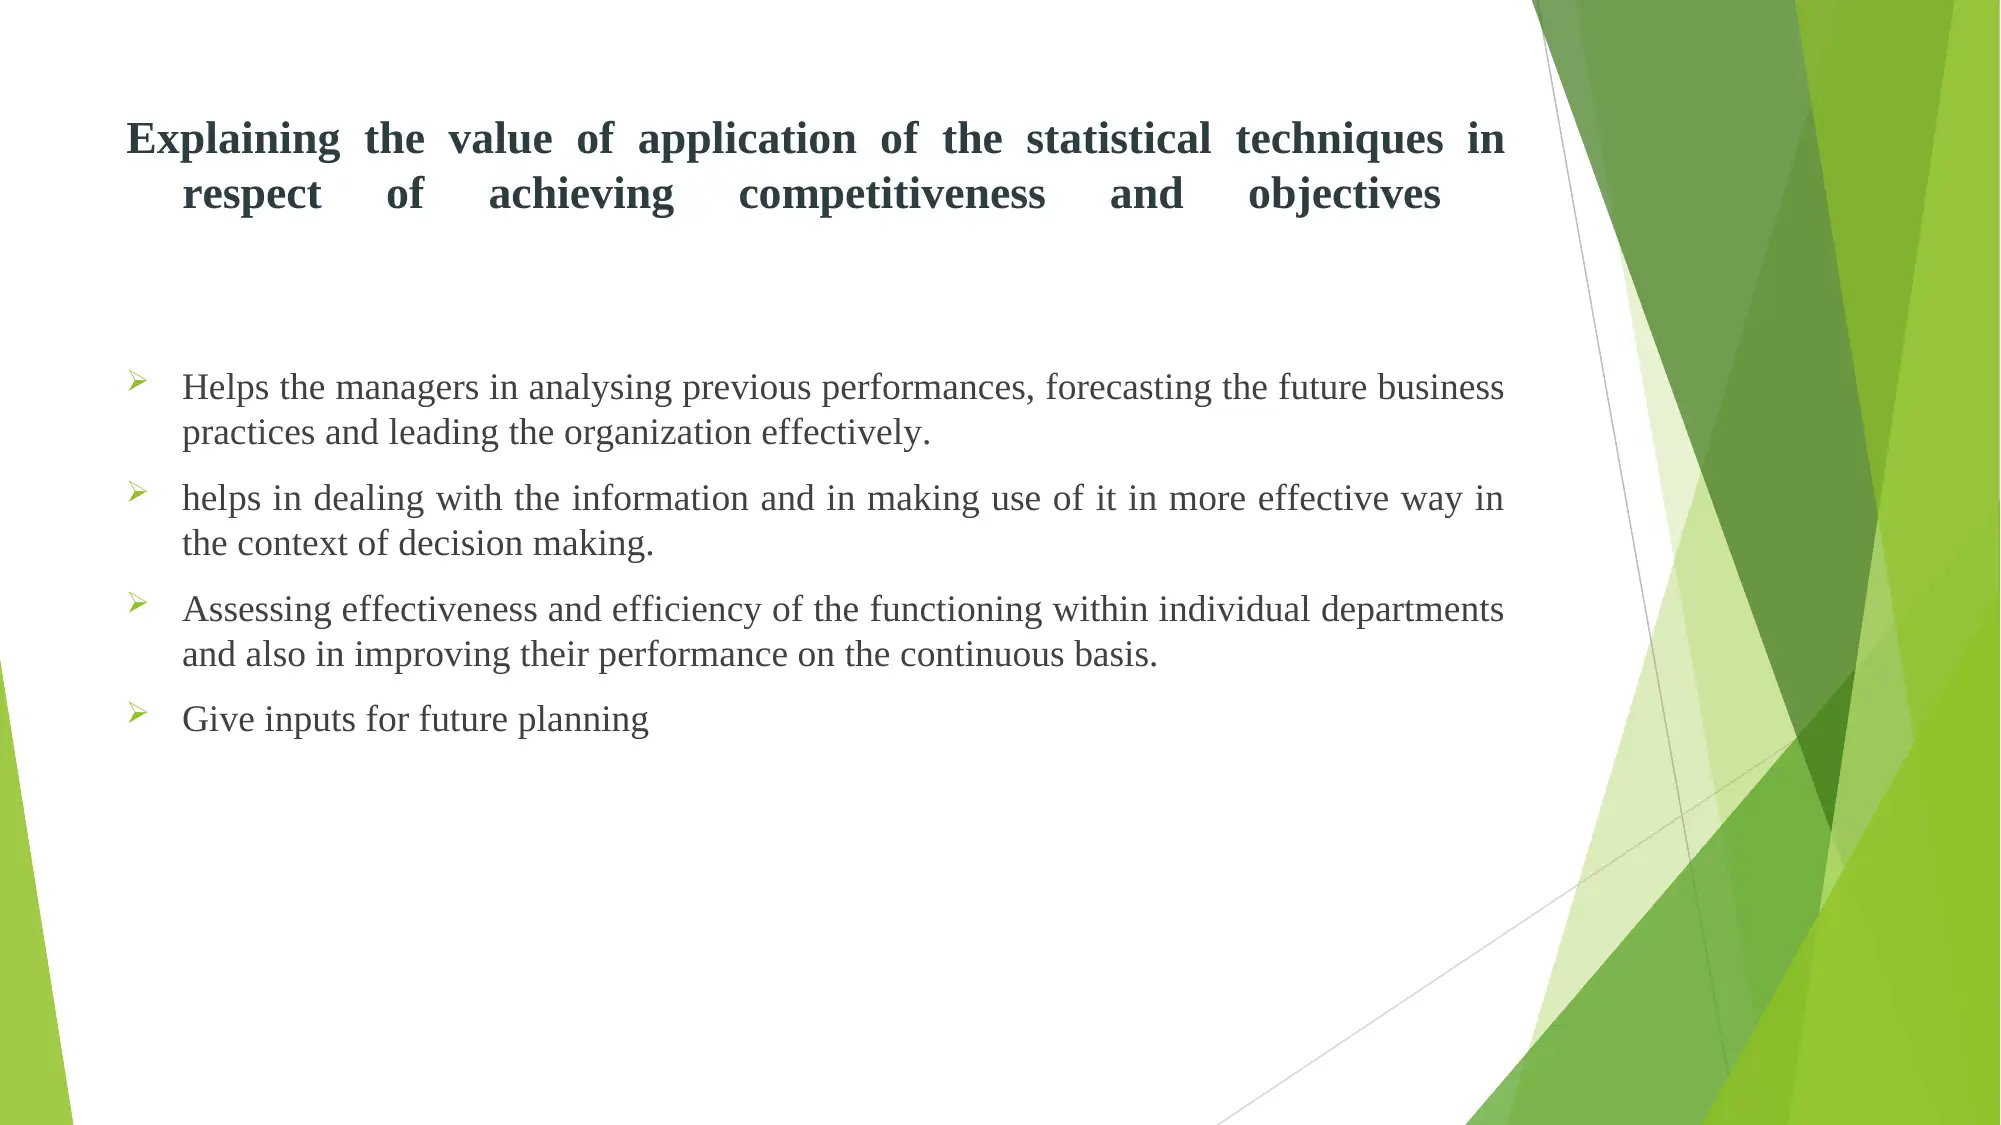
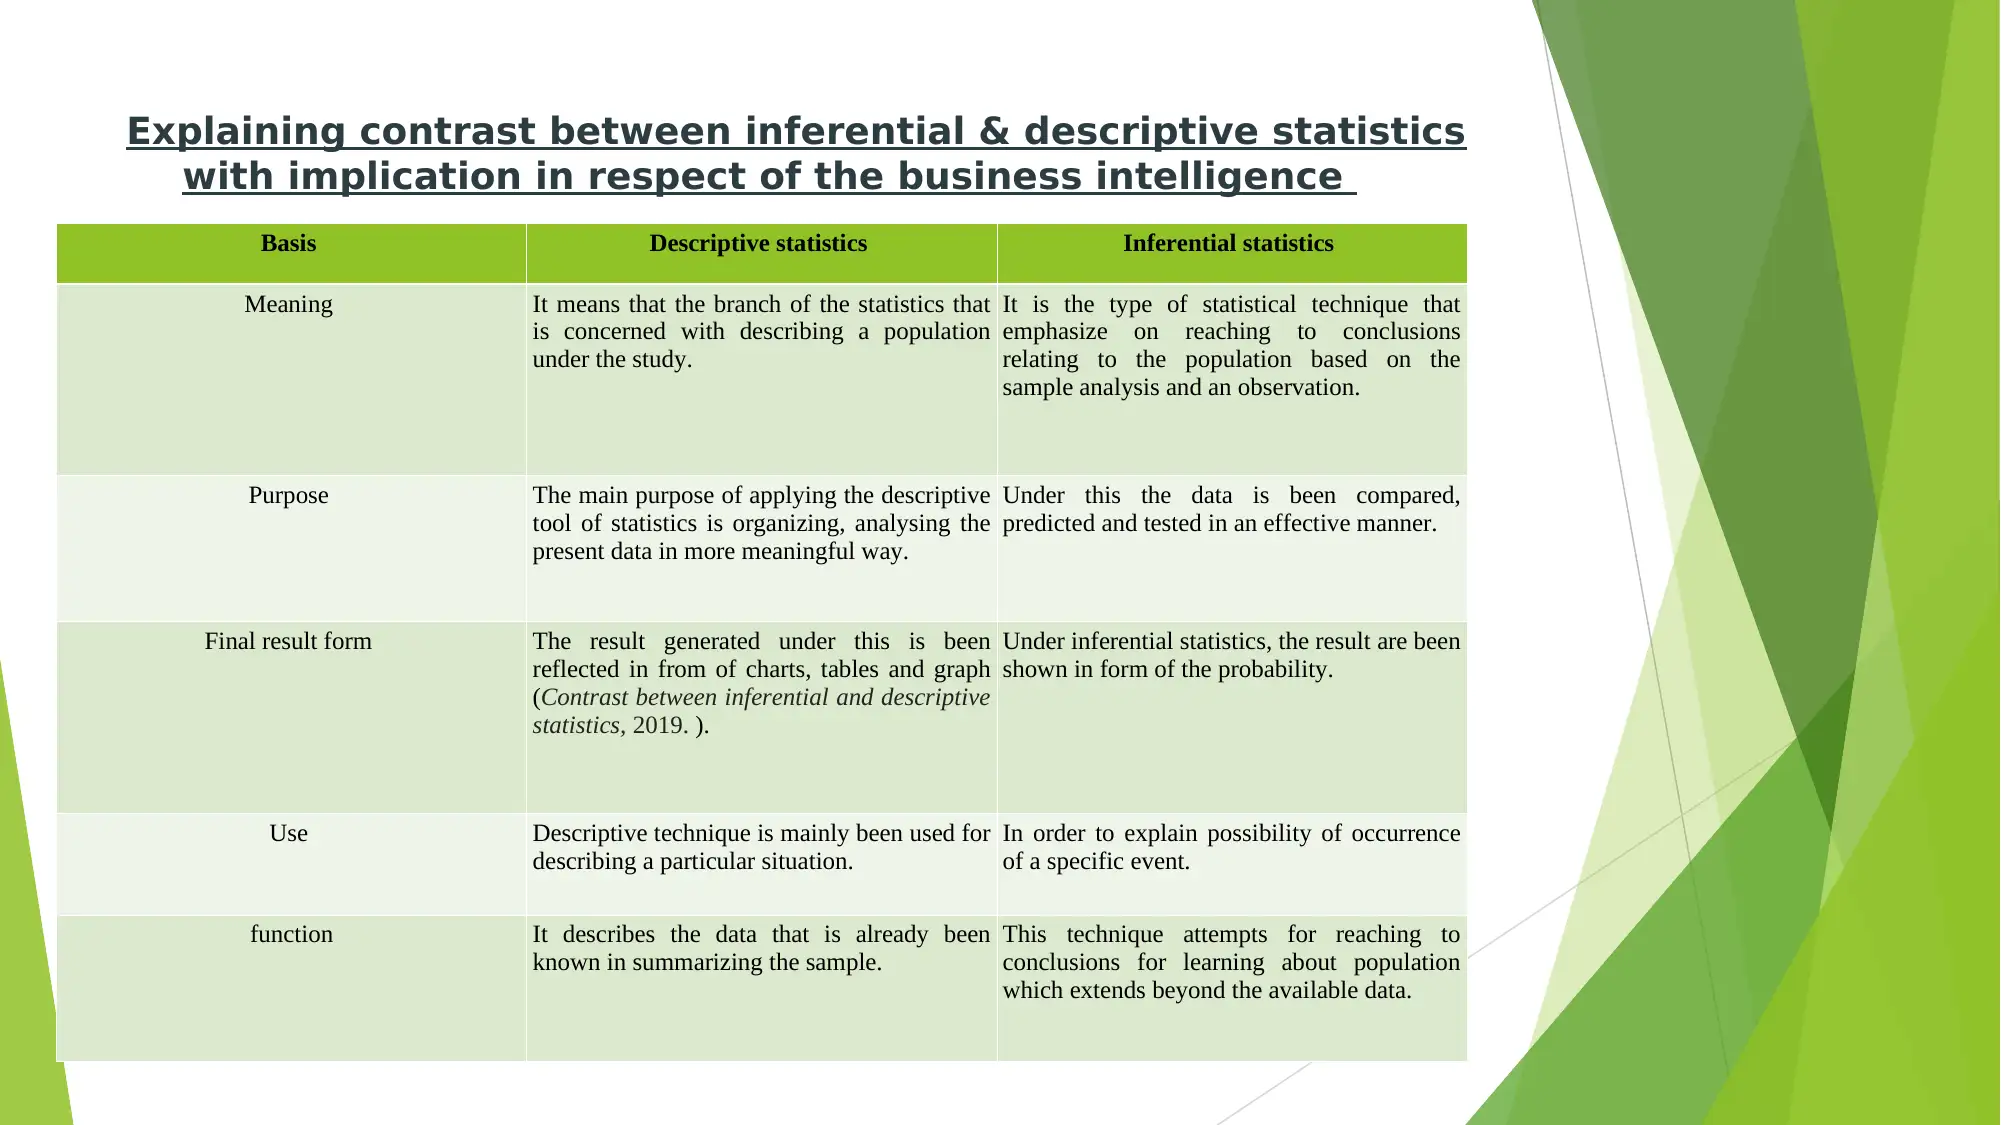
This report provides a comprehensive overview of statistics for management, encompassing various statistical measures and their applications in business decision-making. The report begins with an introduction to statistics, differentiating between descriptive and inferential statistics, and highlighting the significance of statistical techniques in achieving competitiveness and organizational objectives. It explores the sources of business information and contrasts samples with populations. Part 2 of the report evaluates the differences between descriptive and inferential data and the application of a range of different statistical methods. The report includes examples of dataset analysis, including Qbic Hotel, Netflix and Amazon data, and concludes with a summary of the findings and relevant references. The report also includes descriptive and regression analysis for Netflix and Amazon. The report aims to provide managers with tools that are important in making sense of the large quantities of the data and making the most suitable business decisions on the basis of the inferences drawn from the data.

STATISTICS FOR MANAGEMENT
Paraphrase This Document
Need a fresh take? Get an instant paraphrase of this document with our AI Paraphraser

TABLE OF CONTENTS
INTRODUCTION
Part 1
Overview of statistics
Sources and the kind of the information accessed by the business
Difference between the sample and population
Explaining the value of application of the statistical techniques in respect of achieving competitiveness and objectives
Explaining contrast between inferential & descriptive statistics with implication in respect of the business intelligence
Providing appropriate examples of given dataset
PART-2
Evaluating contrast between an inferential and descriptive data
Application of the range of different statistical methods
Presenting the finding in an appropriate format
CONCLUSION
REFERENCES

INTRODUCTION
Statistics management provides the managers with tools that are important in making
sense of the large quantities of the data and making the most suitable business decisions
on the basis of the inferences drawn from the data.
Collecting a numerical history of the occurrence factors on the optional repairs or the
processes which helps in determining requirement for the accurate quantities of the
material for smoothing delay at the time of production fluctuations.
The present report is based on statistical management within which various statistical
measures are been highlighted that helps the firm in evaluating its performance.
⊘ This is a preview!⊘
Do you want full access?
Subscribe today to unlock all pages.

Trusted by 1+ million students worldwide

Part 1: Overview of statistics
Statistics is the form of the mathematical analysis
It is counted as the aggregate of the facts that are been expressed in the numerical form.
statistic is stated as the discipline which is concerned with collection, displaying,
interpreting, organizing and presenting the data.
Helps in analysing trend and thereby gives input for taking corrective measures for
improvement
Paraphrase This Document
Need a fresh take? Get an instant paraphrase of this document with our AI Paraphraser

Sources and the kind of the information accessed by the business
Mainly there are two main methods
through which the data can be collected by
the business under statistical management
Specifically, there present two main
sources of the data that includes statistical
and non-statistical sources. Statistical
sources means the data that is been
gathered for official purposes:

Difference between the sample and population
Basis Population Sample
Meaning It refers to collecting all the elements that
possess common attributes which comprises
universe.
It means the sub-group of members of the
population that is been chosen for involving
more and more participation in study.
Inclusion Population includes each and every single
unit of group (Difference between population
and sample, 2018).
It involves only handful population units
under the study.
Features The main characteristics of population
involves the parameter.
Statistic is one of the most important
characteristic of sample.
Data collection In a situation when the information is
gathered from all the units of the population
then the process is called as complete
enumeration or census.
However, sample survey is been conducted in
gathering the information from sample by
making use of the sampling techniques.
Emphasize on Along with the population, the main focus is
to determine characteristics of components.
On the other side, in sample, the main
emphasize is on making generalisation
regarding the attributes of population from
which sample had been developed.
⊘ This is a preview!⊘
Do you want full access?
Subscribe today to unlock all pages.

Trusted by 1+ million students worldwide

Explaining the value of application of the statistical techniques in
respect of achieving competitiveness and objectives
Helps the managers in analysing previous performances, forecasting the future business
practices and leading the organization effectively.
helps in dealing with the information and in making use of it in more effective way in
the context of decision making.
Assessing effectiveness and efficiency of the functioning within individual departments
and also in improving their performance on the continuous basis.
Give inputs for future planning
Paraphrase This Document
Need a fresh take? Get an instant paraphrase of this document with our AI Paraphraser

Explaining contrast between inferential & descriptive statistics
with implication in respect of the business intelligence
Basis Descriptive statistics Inferential statistics
Meaning It means that the branch of the statistics that
is concerned with describing a population
under the study.
It is the type of statistical technique that
emphasize on reaching to conclusions
relating to the population based on the
sample analysis and an observation.
Purpose The main purpose of applying the descriptive
tool of statistics is organizing, analysing the
present data in more meaningful way.
Under this the data is been compared,
predicted and tested in an effective manner.
Final result form The result generated under this is been
reflected in from of charts, tables and graph
(Contrast between inferential and descriptive
statistics, 2019. ).
Under inferential statistics, the result are been
shown in form of the probability.
Use Descriptive technique is mainly been used for
describing a particular situation.
In order to explain possibility of occurrence
of a specific event.
function It describes the data that is already been
known in summarizing the sample.
This technique attempts for reaching to
conclusions for learning about population
which extends beyond the available data.

Providing appropriate examples of given dataset
Qbic Hotel
Years Revenue Profits
2014 150000 50000
2015 200000 70000
2016 220000 110000
2017 250000 130000
2018 270000 160000
Mean 218000 104000
Qbic Hotel
Years Revenue Profits
2014 150000 50000
2015 200000 70000
2016 220000 110000
2017 250000 130000
2018 270000 160000
Mean 218000 104000
⊘ This is a preview!⊘
Do you want full access?
Subscribe today to unlock all pages.

Trusted by 1+ million students worldwide

PART-2: Evaluating contrast between an inferential and descriptive
data
Descriptive data- It means numbers that are been used for summarizing and describing the
data. under this the data is been used for providing description about population either
through the numerical computations or by the tables and the graphs.
Advantages Disadvantages
It is stated as the sensitive measure as it reflects values of all
data in final calculations.
Descriptive statistics is the not been affected by the extreme
results.
This tool is most useful at the time when data is expressed in
categories.
It is counted as the precise measure of the dispersion where
all exact values are been taken into consideration.
Through this technique calculation of variance is not been
seen as difficult.
It makes easy computation of the range within the dataset.
This method cannot be used in the situation where the data
is nominal.
This method requires the interpolation for the group
aggregate data in form of cumulative frequency curve.
It might not be characterize when the items in data are few
and is distributed irregularly.
Under this very limited use of the statistics has been made
and cannot determine exact value in the group data.
It opts for very limited use of the statistics which results in
inaccurate findings.
Paraphrase This Document
Need a fresh take? Get an instant paraphrase of this document with our AI Paraphraser

Contd..
Inferential data- Under this inferences and the predictions regarding population is based
on sample of the data that is been taken from population.
Advantages Disadvantages
Large predictions are been made from the small
sets of data under inferential statistics.
It provides for inferring conclusions from the
adequate sample in relation to the population.
Under this data are been used from the small
group fro making generalisations about the larger
group of the people within the population.
This method provides an estimate of the unknown
parameters that could be used fro making
predictions on the distributions which are been
known in a better way.
Inferential statistics majorly applied on the basis
of utilizing the values that is measured in sample
fro anticipating or inferring the values that would
measure in the population. In order to be more
and more concrete, problem is the degree of the
uncertainty present while providing the data
about the population.
It needs for making estimations on part of the
user on the theory to run it so again there present
some sort of uncertainty within this process that
will be having any repercussions on certainty of
results under the study.

Application of the range of different statistical methods
Descriptive statistics: Netflix
Total
Revenue
Cost of
Revenue
Gross
Profit
Researc
h
Develop
ment
Selling
General
and
Administ
rative
Total
Operatin
g
Expenses
Operatin
g Profit
or Loss
Interest
Expense
Profit
Tax
Expense
Net
Profit
Mean 10774 7212 3562 902 1878 9992 782 235 45 520
Standard
Error 1953 1156 817 123 397 1661 299 66 16 250
Median 10262 7145 3116 867 1640 9652 609 194 46 373
Mode #N/A #N/A #N/A #N/A #N/A #N/A #N/A #N/A #N/A #N/A
Standard
Deviation 3906 2313 1633 247 794 3322 597 132 33 499
Range 9015 5376 3639 571 1768 7715 1299 288 59 1089
Minimu
m 6780 4591 2188 651 1231 6474 306 133 15 123
Maximu
m 15794 9968 5827 1222 3000 14189 1605 420 74 1211
⊘ This is a preview!⊘
Do you want full access?
Subscribe today to unlock all pages.

Trusted by 1+ million students worldwide
1 out of 23
Related Documents

Your All-in-One AI-Powered Toolkit for Academic Success.
+13062052269
info@desklib.com
Available 24*7 on WhatsApp / Email
Unlock your academic potential
Copyright © 2020–2025 A2Z Services. All Rights Reserved. Developed and managed by ZUCOL.