Statistics for Management: Data Analysis, Interpretation, and Report
VerifiedAdded on 2023/03/22
|15
|3255
|55
Report
AI Summary
This report provides a comprehensive analysis of statistical concepts and their application in a management context. It begins with an introduction to statistics and explores various data analysis techniques, including the calculation of gross annual earnings for both public and private sectors, as well as the gap between male and female earnings. The report covers data representation using tables and charts, including line charts and scatter diagrams to determine relationships between variables such as age and weight. It delves into measures of central tendency (mean, median, mode) and dispersion (standard deviation, range, interquartile range), evaluating their strengths and weaknesses. The report also discusses the application of statistical tools like chi-square tests and regression analysis for decision-making in business, using examples such as calculating the number of deliveries and bottle requirements. Overall, the report aims to equip management students with the necessary statistical knowledge for effective data interpretation and decision-making.
Statistics for Management
Contents
INTRODUCTION...............................................................................................................................................................3
1
Contents
INTRODUCTION...............................................................................................................................................................3
1
Paraphrase This Document
Need a fresh take? Get an instant paraphrase of this document with our AI Paraphraser
TASK 1.............................................................................................................................................................................3
A):................................................................................................................................................................................3
ii): The gap among male and female gross annual earning.........................................................................................5
2..................................................................................................................................................................................5
TASK 2.............................................................................................................................................................................6
2.1:Representation of data .........................................................................................................................................6
2.2 Strength and weakness of using measure:............................................................................................................8
2.2 (II): Measure of dispersion.....................................................................................................................................8
2.3 Preparation of report.............................................................................................................................................9
Section B......................................................................................................................................................................9
2.4 Line charts to determine relationship among age and weight..............................................................................9
TASK 3............................................................................................................................................................................ 10
TASK 4............................................................................................................................................................................ 11
4.1: (I) Bar chart.........................................................................................................................................................11
ii: Pie-chart................................................................................................................................................................12
4.2: Evaluation about two average prices of bedroom houses..................................................................................12
CONCLUSION.................................................................................................................................................................12
REFERENCES..................................................................................................................................................................13
2
INTRODUCTION
Statistics is one of the most crucial subject which helps to simplify the complex data as this is known
as the science of gathering, presentation and evaluation of the statistical data. This is important to interpret
the data in an effective manner so that analyzing of data can be done. The crucial aspects of statistical data is
to come to the conclusion that could help out to attain the certain pre-set objectives (Kuo and et. al., 2014).
Under this report, this can be said that the primary and secondary data sources are discussed under this
report.
TASK 1
A):
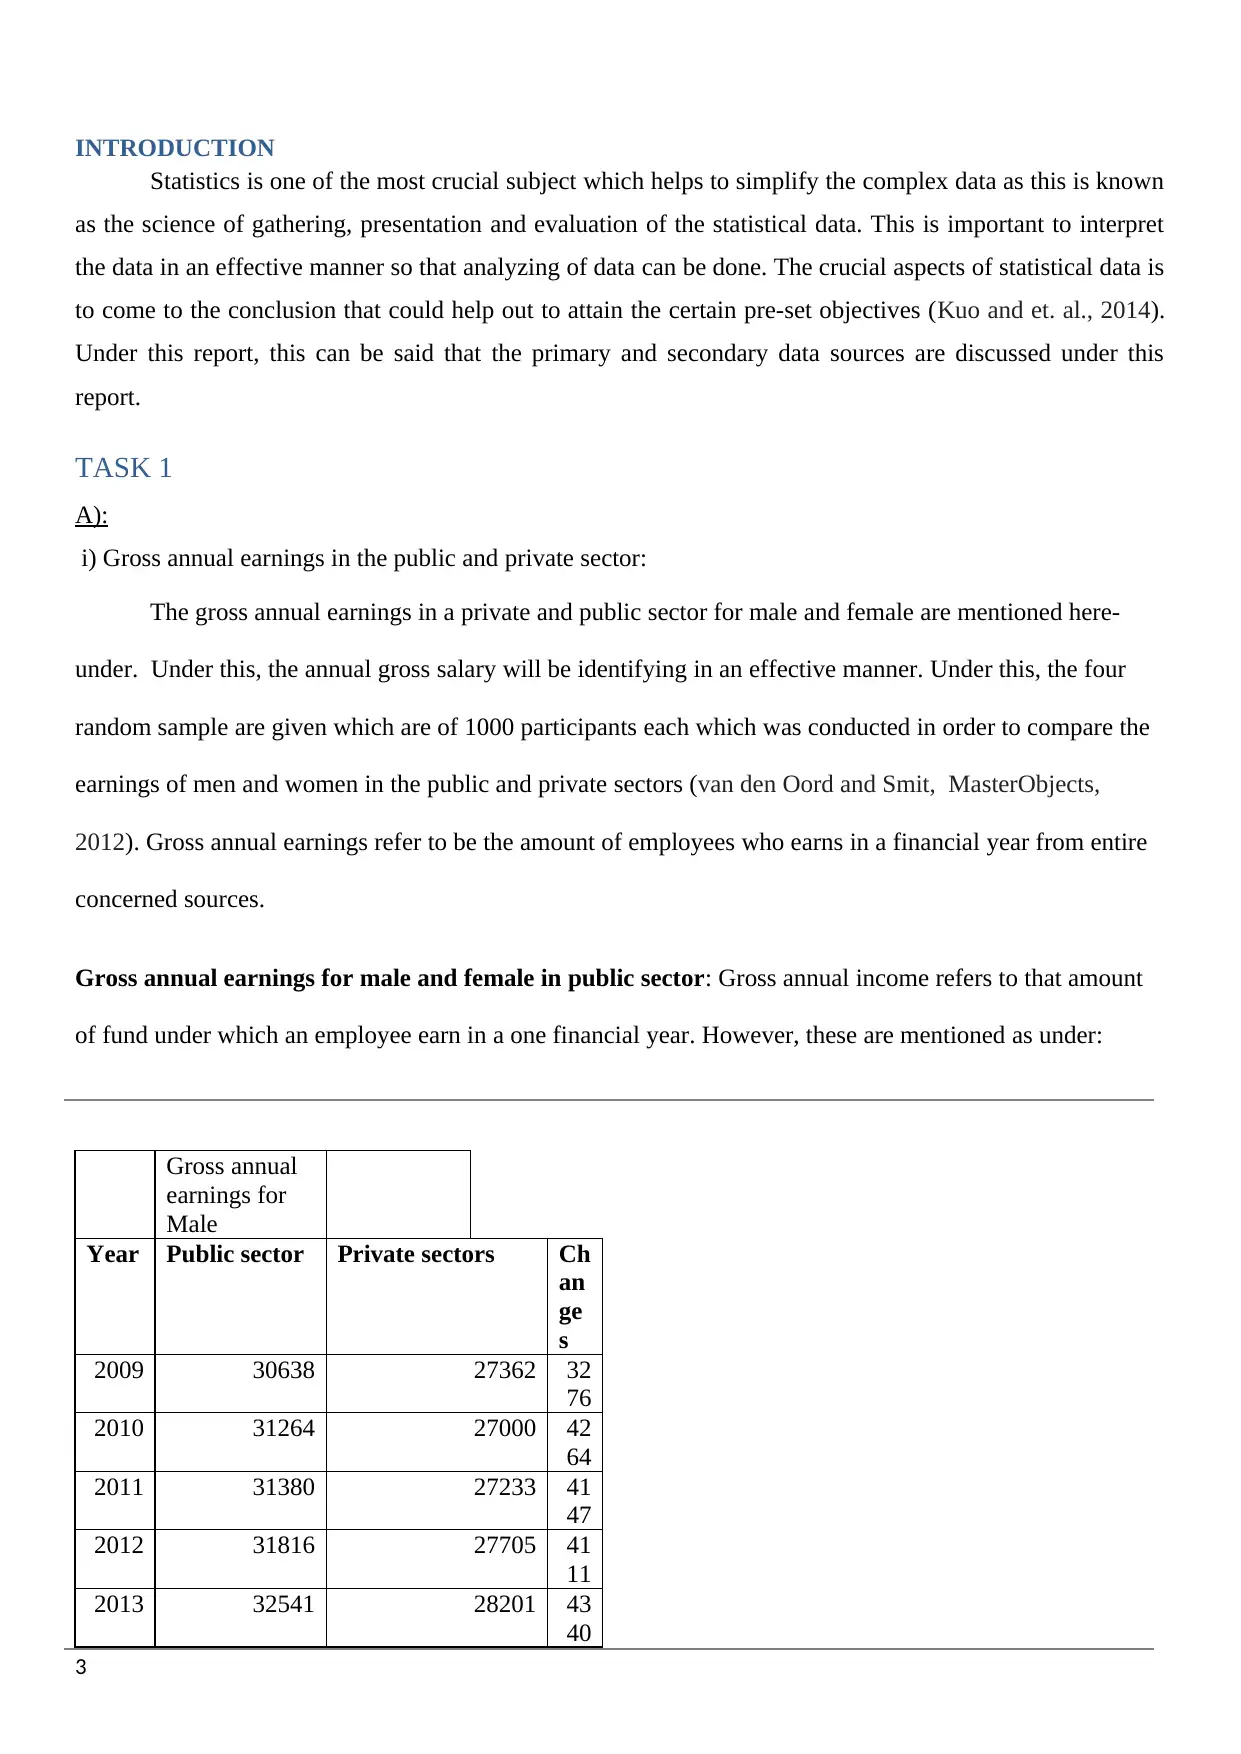
i) Gross annual earnings in the public and private sector:
The gross annual earnings in a private and public sector for male and female are mentioned here-
under. Under this, the annual gross salary will be identifying in an effective manner. Under this, the four
random sample are given which are of 1000 participants each which was conducted in order to compare the
earnings of men and women in the public and private sectors (van den Oord and Smit, MasterObjects,
2012). Gross annual earnings refer to be the amount of employees who earns in a financial year from entire
concerned sources.
Gross annual earnings for male and female in public sector: Gross annual income refers to that amount
of fund under which an employee earn in a one financial year. However, these are mentioned as under:
Gross annual
earnings for
Male
Year Public sector Private sectors Ch
an
ge
s
2009 30638 27362 32
76
2010 31264 27000 42
64
2011 31380 27233 41
47
2012 31816 27705 41
11
2013 32541 28201 43
40
3
Statistics is one of the most crucial subject which helps to simplify the complex data as this is known
as the science of gathering, presentation and evaluation of the statistical data. This is important to interpret
the data in an effective manner so that analyzing of data can be done. The crucial aspects of statistical data is
to come to the conclusion that could help out to attain the certain pre-set objectives (Kuo and et. al., 2014).
Under this report, this can be said that the primary and secondary data sources are discussed under this
report.
TASK 1
A):
i) Gross annual earnings in the public and private sector:
The gross annual earnings in a private and public sector for male and female are mentioned here-
under. Under this, the annual gross salary will be identifying in an effective manner. Under this, the four
random sample are given which are of 1000 participants each which was conducted in order to compare the
earnings of men and women in the public and private sectors (van den Oord and Smit, MasterObjects,
2012). Gross annual earnings refer to be the amount of employees who earns in a financial year from entire
concerned sources.
Gross annual earnings for male and female in public sector: Gross annual income refers to that amount
of fund under which an employee earn in a one financial year. However, these are mentioned as under:
Gross annual
earnings for
Male
Year Public sector Private sectors Ch
an
ge
s
2009 30638 27362 32
76
2010 31264 27000 42
64
2011 31380 27233 41
47
2012 31816 27705 41
11
2013 32541 28201 43
40
3
⊘ This is a preview!⊘
Do you want full access?
Subscribe today to unlock all pages.
Trusted by 1+ million students worldwide
2014 32878 28442 44
36
2015 33685 28881 48
04
2016 34011 29679 43
32
Gross Annual
earnings of Female
Year Public sector Private sectors Changes
2009 25224 19551 5673
2010 26113 19532 6581
2011 26470 19565 6905
2012 26636 20313 6323
2013 27338 20698 6640
2014 27705 21017 6688
2015 27900 21403 6497
2016 28053 22251 5802
4
Paraphrase This Document
Need a fresh take? Get an instant paraphrase of this document with our AI Paraphraser
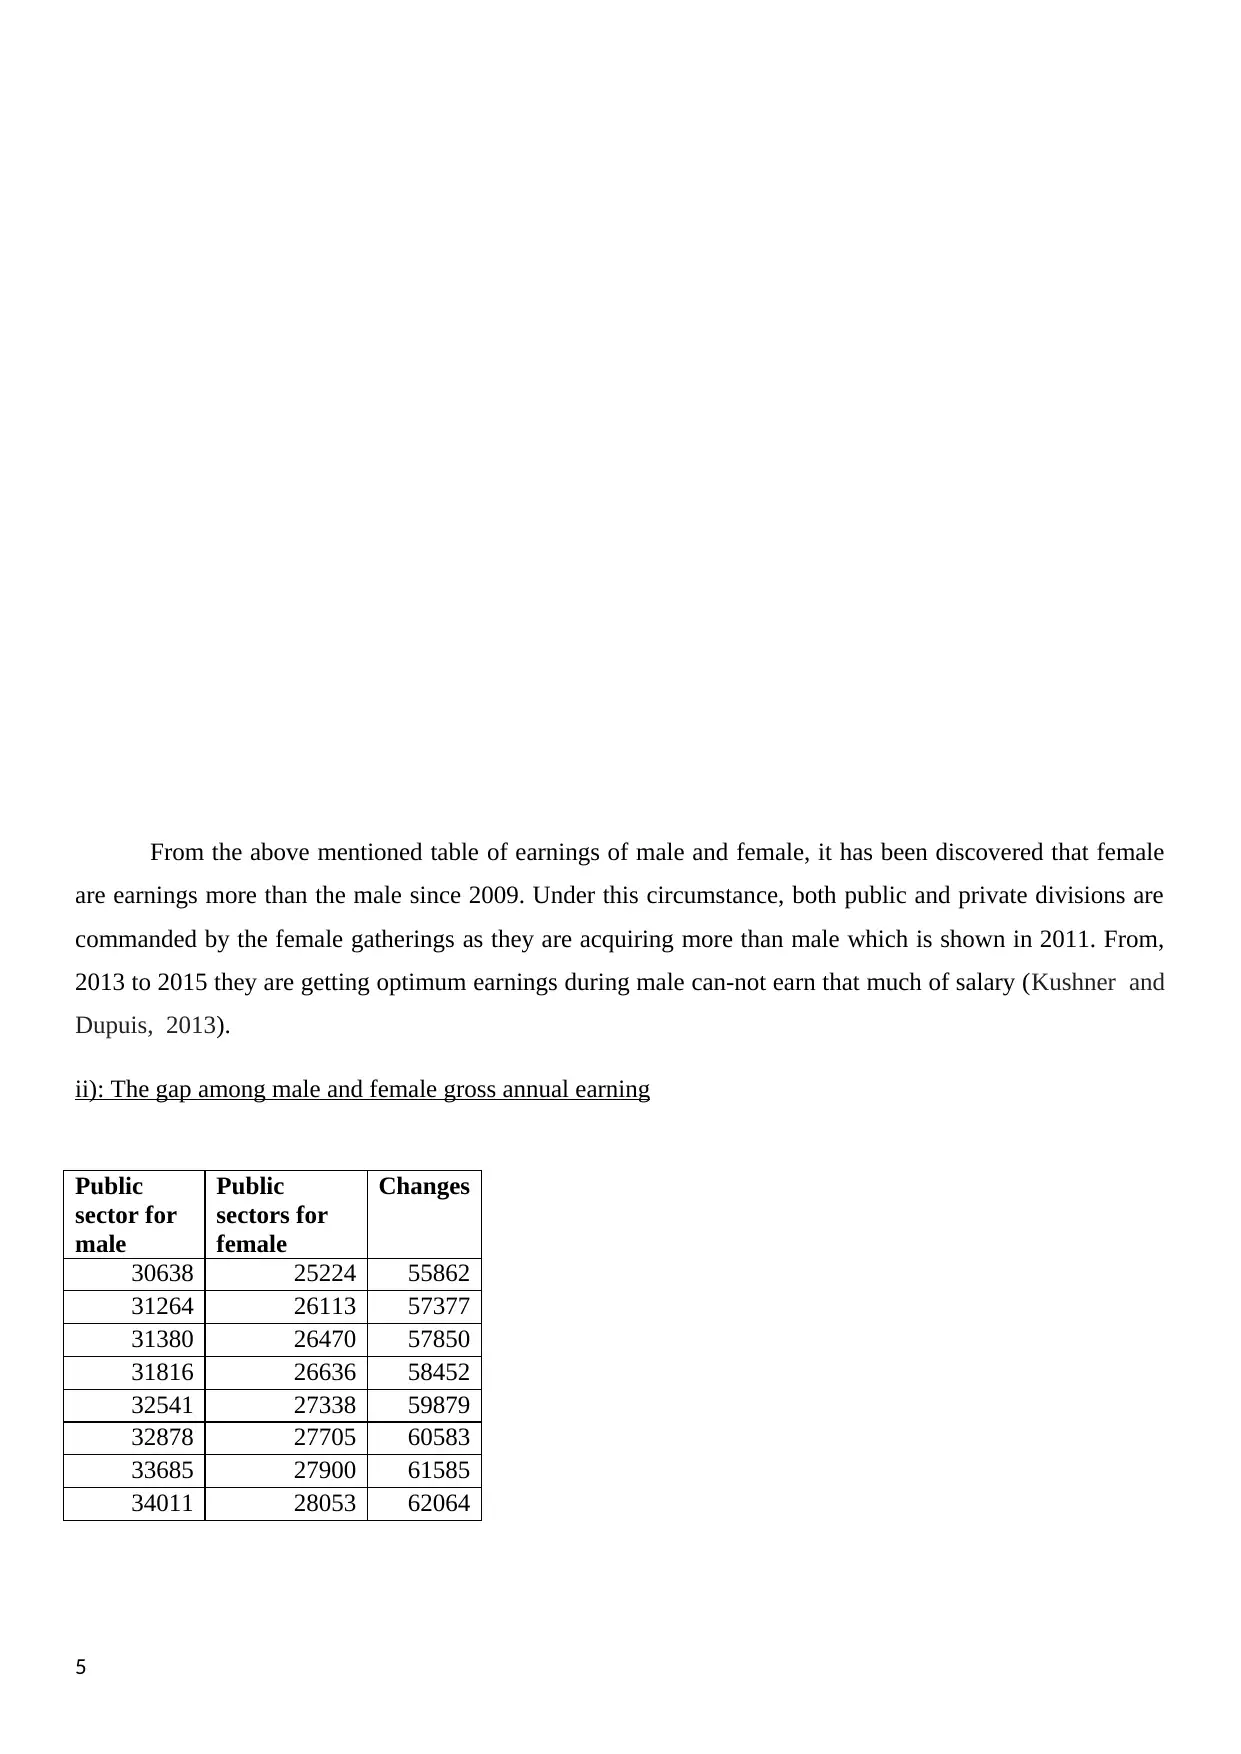
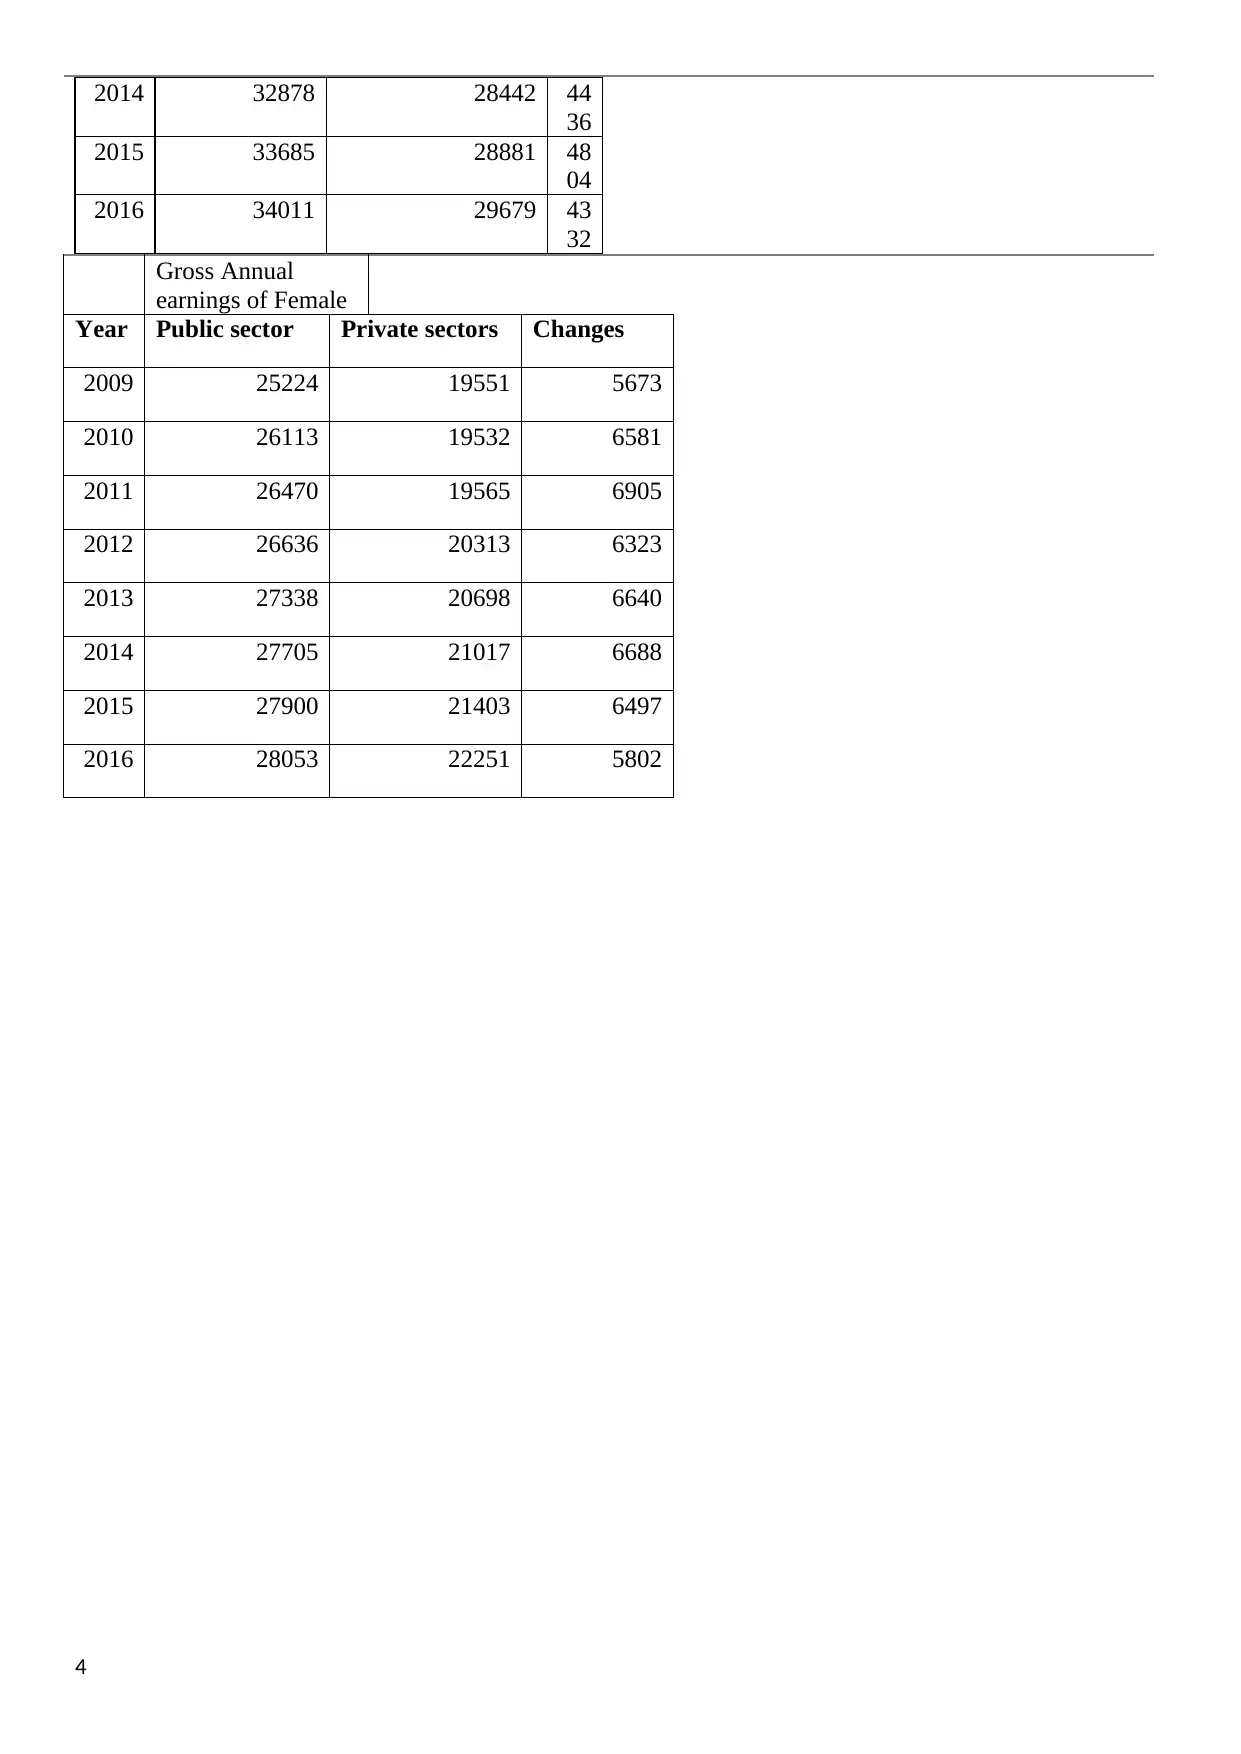
From the above mentioned table of earnings of male and female, it has been discovered that female
are earnings more than the male since 2009. Under this circumstance, both public and private divisions are
commanded by the female gatherings as they are acquiring more than male which is shown in 2011. From,
2013 to 2015 they are getting optimum earnings during male can-not earn that much of salary (Kushner and
Dupuis, 2013).
ii): The gap among male and female gross annual earning
Public
sector for
male
Public
sectors for
female
Changes
30638 25224 55862
31264 26113 57377
31380 26470 57850
31816 26636 58452
32541 27338 59879
32878 27705 60583
33685 27900 61585
34011 28053 62064
5
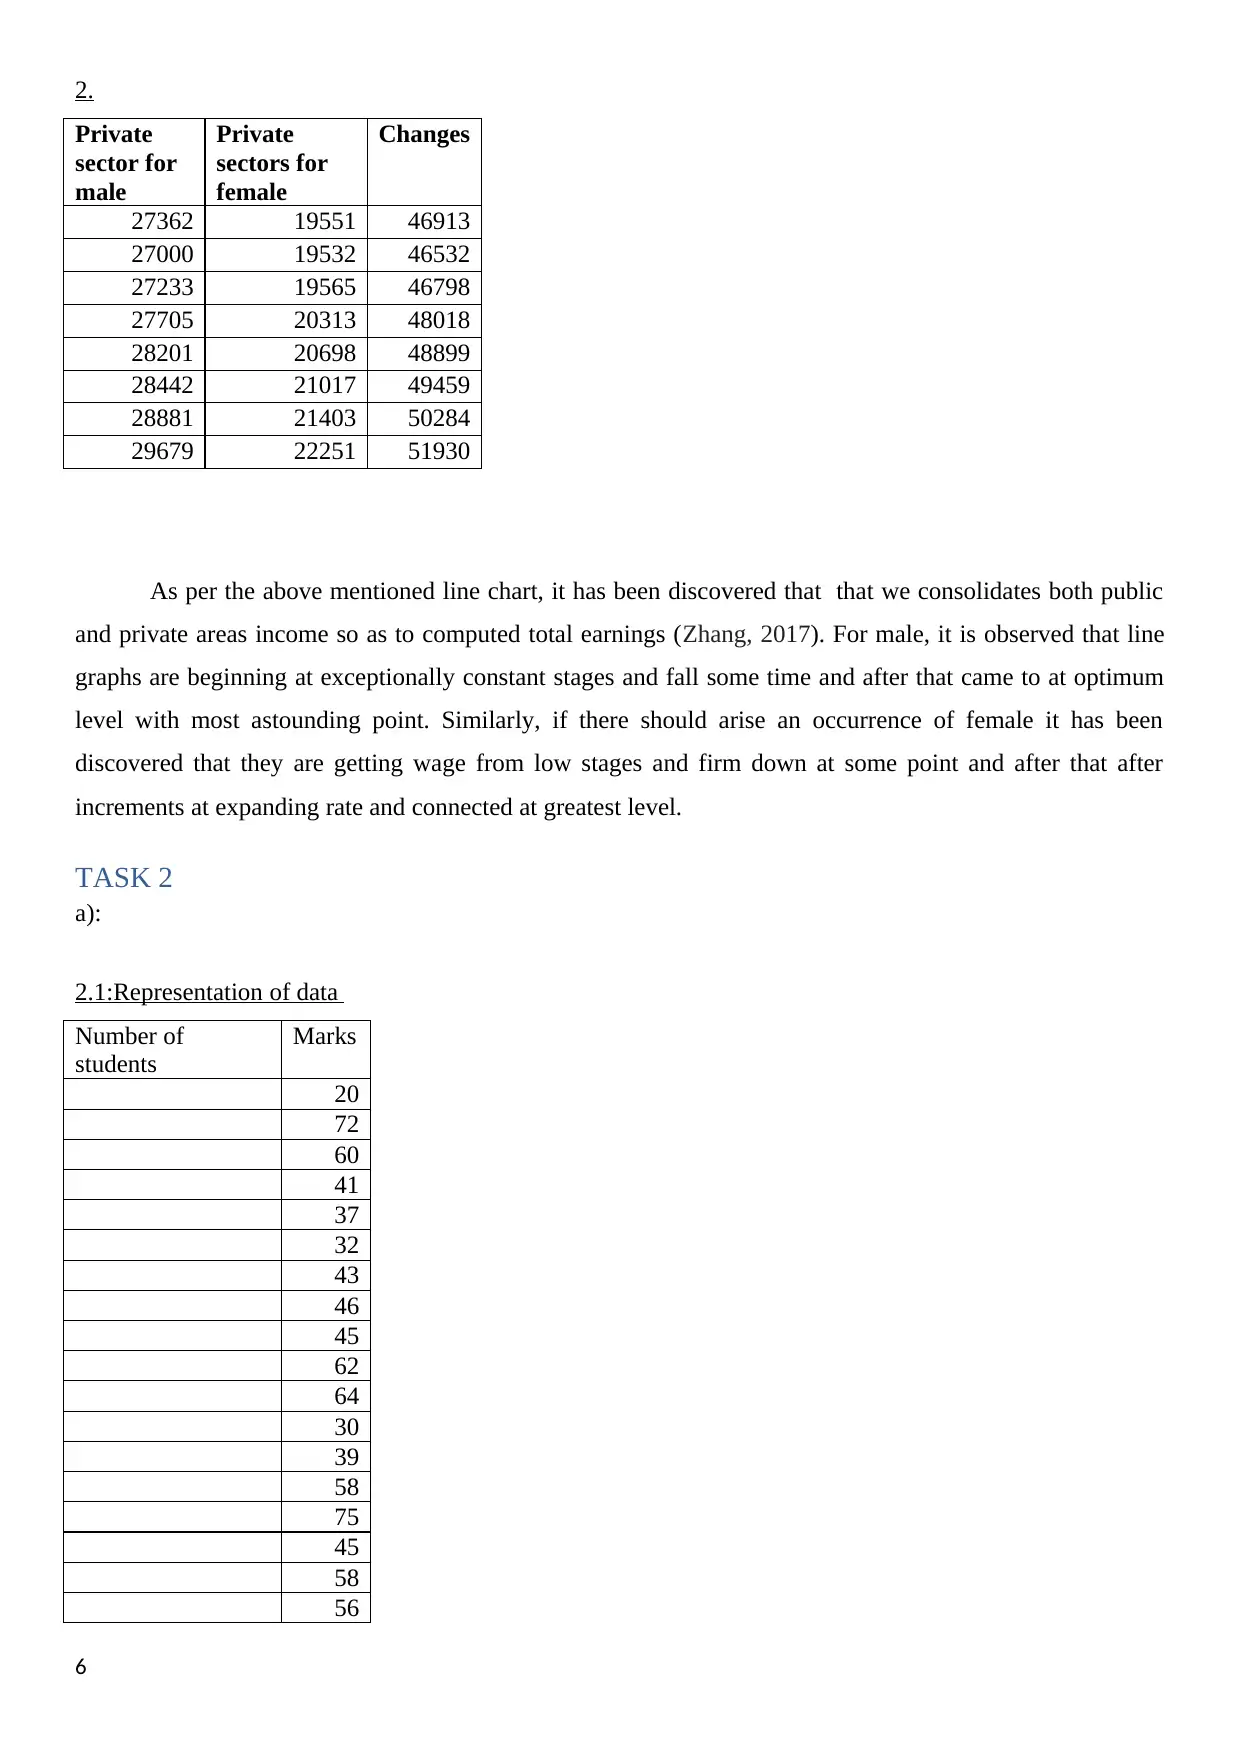
2.
Private
sector for
male
Private
sectors for
female
Changes
27362 19551 46913
27000 19532 46532
27233 19565 46798
27705 20313 48018
28201 20698 48899
28442 21017 49459
28881 21403 50284
29679 22251 51930
As per the above mentioned line chart, it has been discovered that that we consolidates both public
and private areas income so as to computed total earnings (Zhang, 2017). For male, it is observed that line
graphs are beginning at exceptionally constant stages and fall some time and after that came to at optimum
level with most astounding point. Similarly, if there should arise an occurrence of female it has been
discovered that they are getting wage from low stages and firm down at some point and after that after
increments at expanding rate and connected at greatest level.
TASK 2
a):
2.1:Representation of data
Number of
students
Marks
20
72
60
41
37
32
43
46
45
62
64
30
39
58
75
45
58
56
6
Private
sector for
male
Private
sectors for
female
Changes
27362 19551 46913
27000 19532 46532
27233 19565 46798
27705 20313 48018
28201 20698 48899
28442 21017 49459
28881 21403 50284
29679 22251 51930
As per the above mentioned line chart, it has been discovered that that we consolidates both public
and private areas income so as to computed total earnings (Zhang, 2017). For male, it is observed that line
graphs are beginning at exceptionally constant stages and fall some time and after that came to at optimum
level with most astounding point. Similarly, if there should arise an occurrence of female it has been
discovered that they are getting wage from low stages and firm down at some point and after that after
increments at expanding rate and connected at greatest level.
TASK 2
a):
2.1:Representation of data
Number of
students
Marks
20
72
60
41
37
32
43
46
45
62
64
30
39
58
75
45
58
56
6
⊘ This is a preview!⊘
Do you want full access?
Subscribe today to unlock all pages.
Trusted by 1+ million students worldwide
39
40
21
29
68
59
54
42
37
30
70
45
46
36
43
33
48
39
41
48
44
57
52
55
32
46
40
48
68
40
48
56
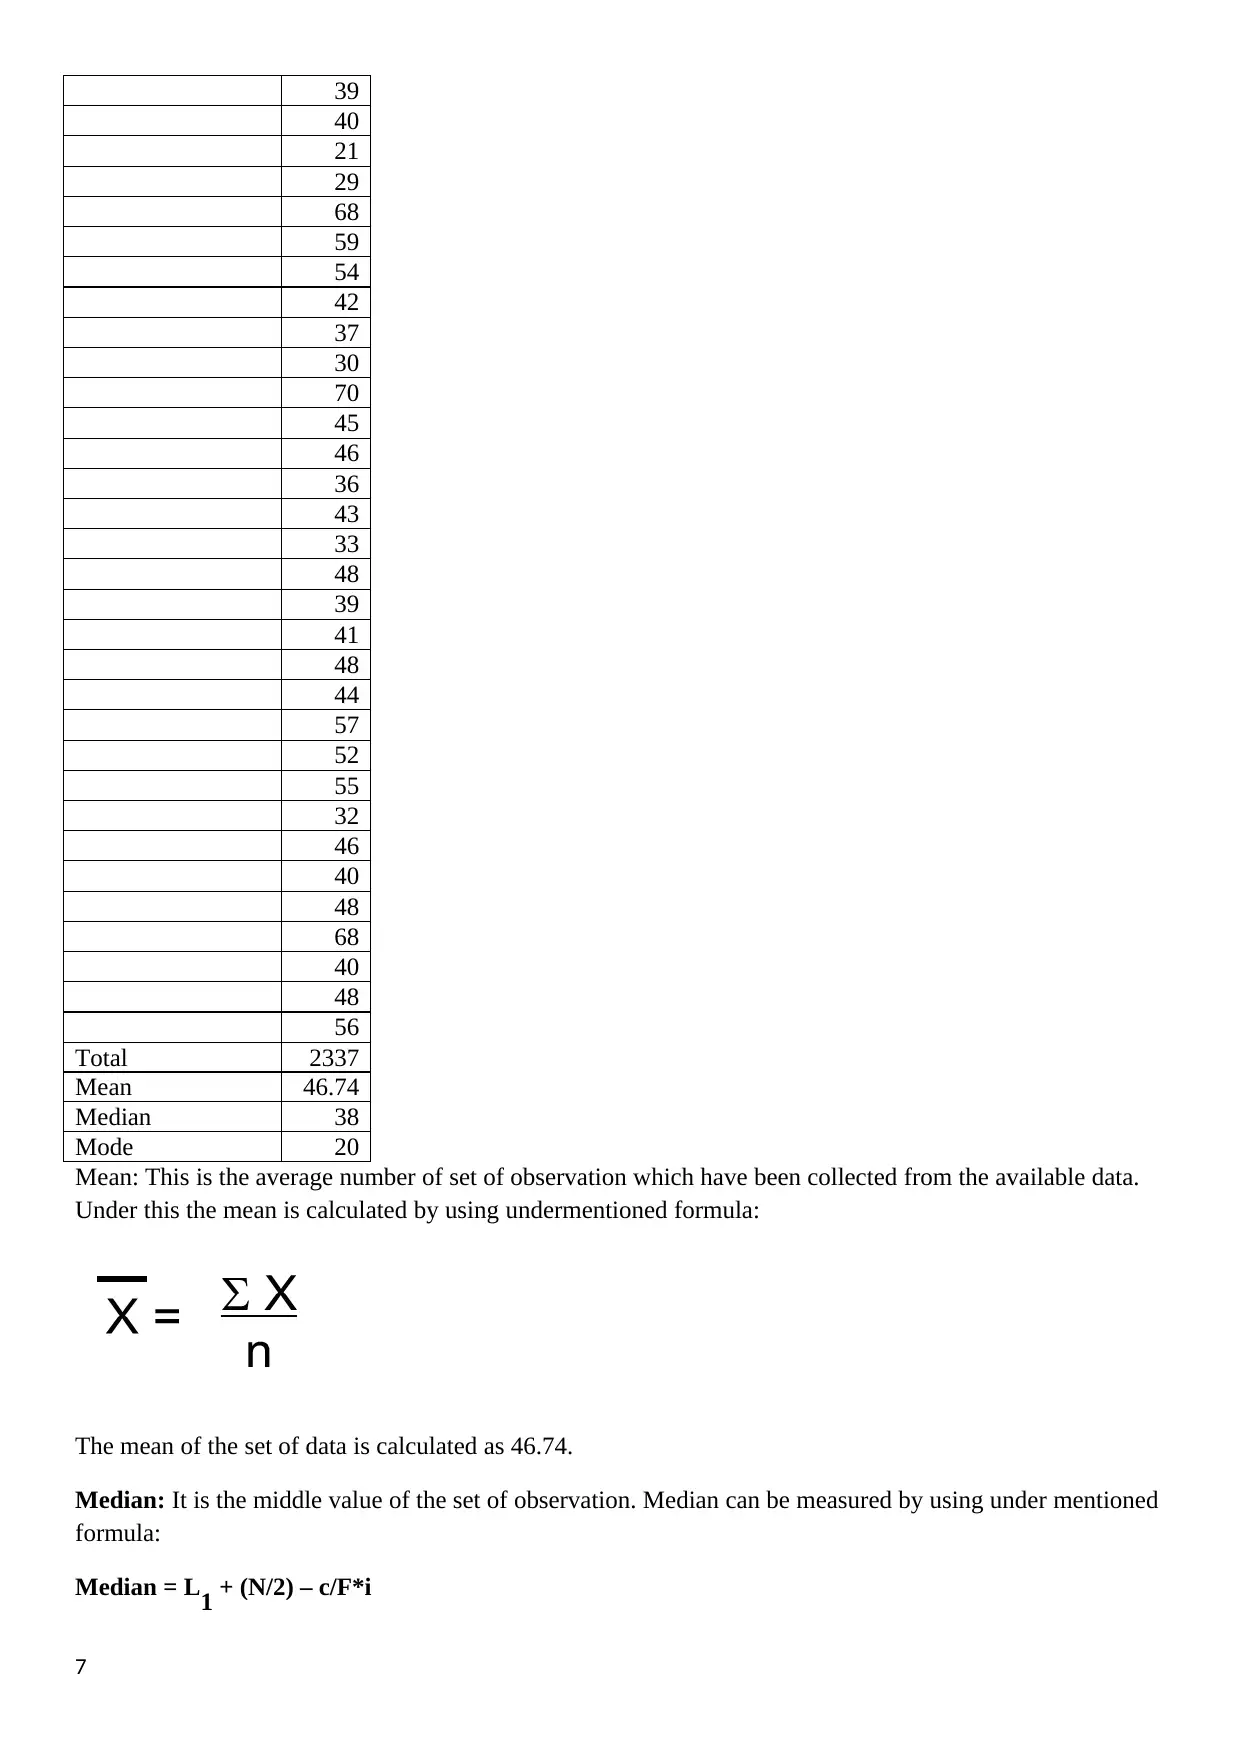
Total 2337
Mean 46.74
Median 38
Mode 20
Mean: This is the average number of set of observation which have been collected from the available data.
Under this the mean is calculated by using undermentioned formula:
The mean of the set of data is calculated as 46.74.
Median: It is the middle value of the set of observation. Median can be measured by using under mentioned
formula:
Median = L1 + (N/2) – c/F*i
7
40
21
29
68
59
54
42
37
30
70
45
46
36
43
33
48
39
41
48
44
57
52
55
32
46
40
48
68
40
48
56
Total 2337
Mean 46.74
Median 38
Mode 20
Mean: This is the average number of set of observation which have been collected from the available data.
Under this the mean is calculated by using undermentioned formula:
The mean of the set of data is calculated as 46.74.
Median: It is the middle value of the set of observation. Median can be measured by using under mentioned
formula:
Median = L1 + (N/2) – c/F*i
7
Paraphrase This Document
Need a fresh take? Get an instant paraphrase of this document with our AI Paraphraser
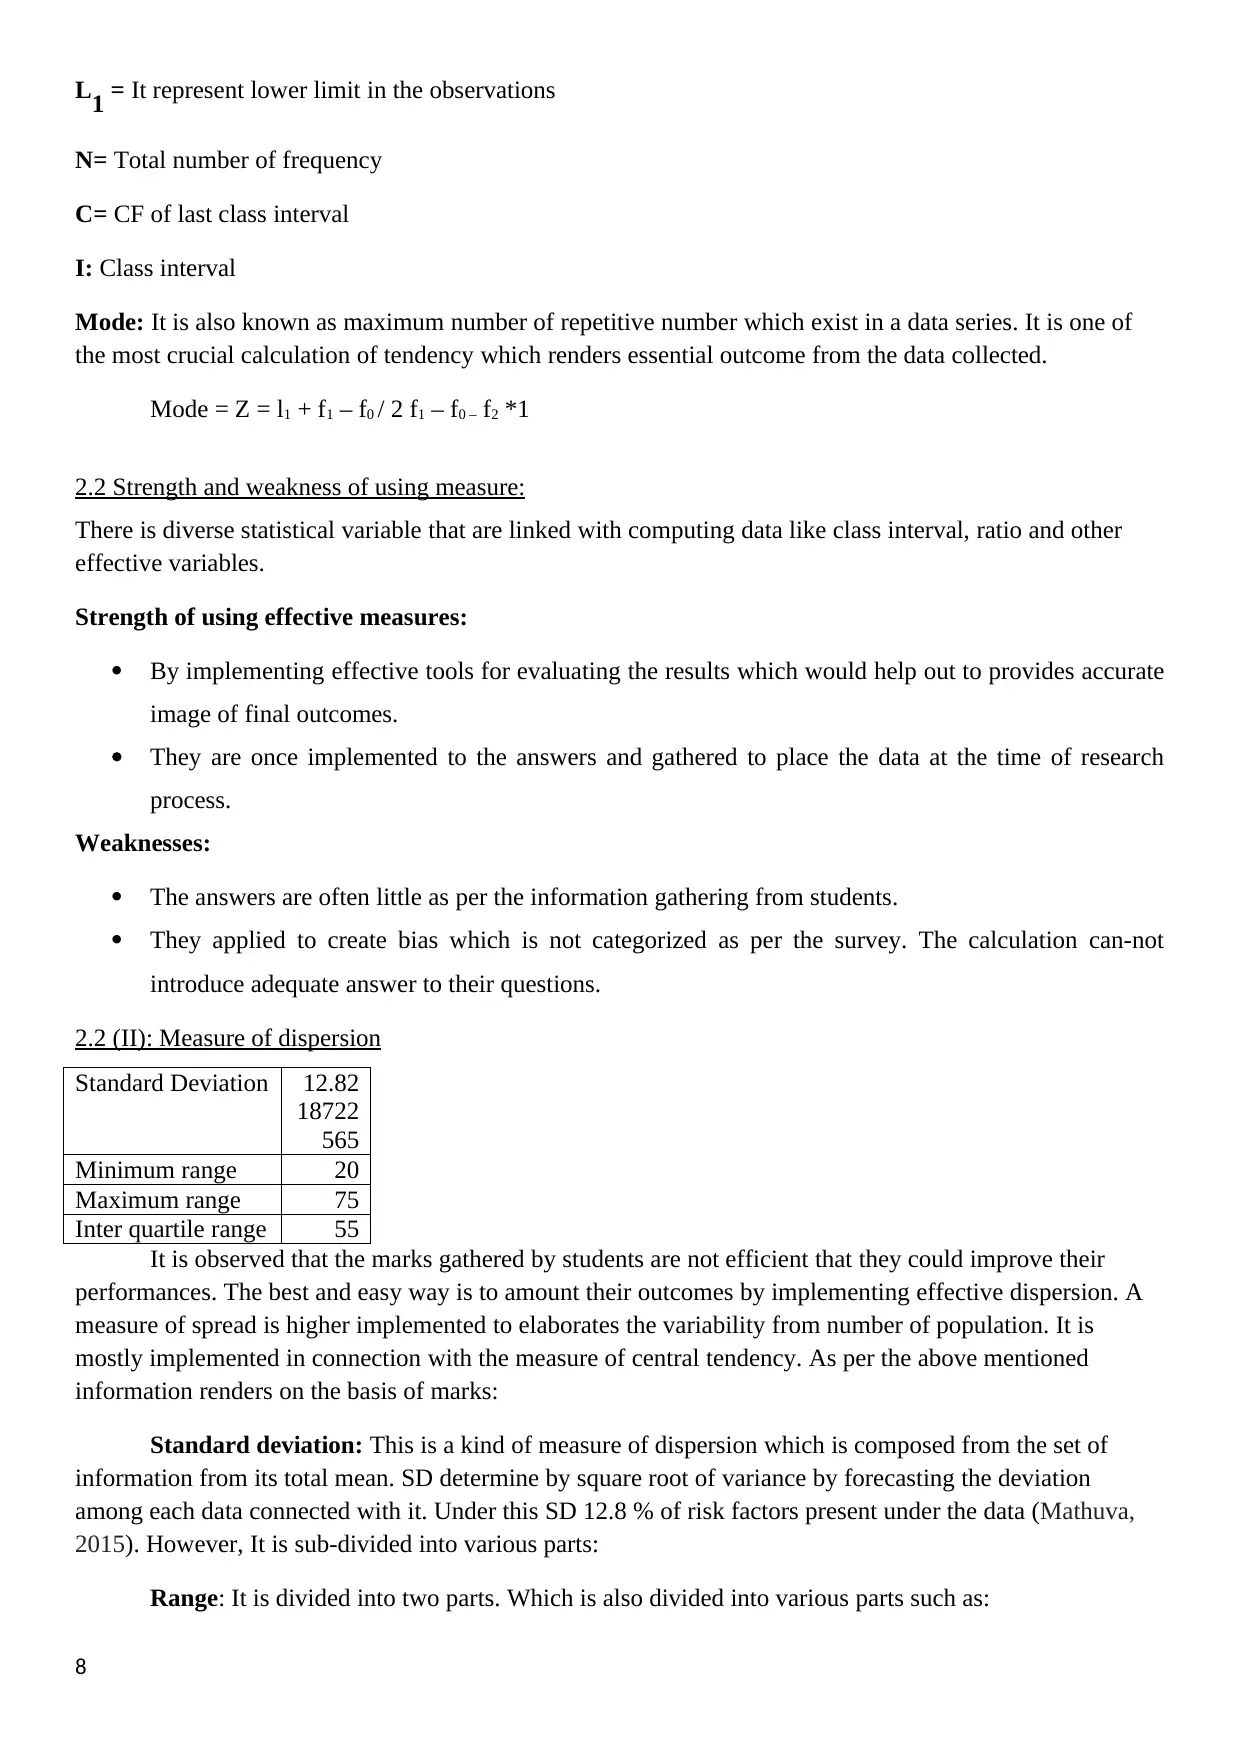
L1 = It represent lower limit in the observations
N= Total number of frequency
C= CF of last class interval
I: Class interval
Mode: It is also known as maximum number of repetitive number which exist in a data series. It is one of
the most crucial calculation of tendency which renders essential outcome from the data collected.
Mode = Z = l1 + f1 – f0 / 2 f1 – f0 – f2 *1
2.2 Strength and weakness of using measure:
There is diverse statistical variable that are linked with computing data like class interval, ratio and other
effective variables.
Strength of using effective measures:
By implementing effective tools for evaluating the results which would help out to provides accurate
image of final outcomes.
They are once implemented to the answers and gathered to place the data at the time of research
process.
Weaknesses:
The answers are often little as per the information gathering from students.
They applied to create bias which is not categorized as per the survey. The calculation can-not
introduce adequate answer to their questions.
2.2 (II): Measure of dispersion
Standard Deviation 12.82
18722
565
Minimum range 20
Maximum range 75
Inter quartile range 55
It is observed that the marks gathered by students are not efficient that they could improve their
performances. The best and easy way is to amount their outcomes by implementing effective dispersion. A
measure of spread is higher implemented to elaborates the variability from number of population. It is
mostly implemented in connection with the measure of central tendency. As per the above mentioned
information renders on the basis of marks:
Standard deviation: This is a kind of measure of dispersion which is composed from the set of
information from its total mean. SD determine by square root of variance by forecasting the deviation
among each data connected with it. Under this SD 12.8 % of risk factors present under the data (Mathuva,
2015). However, It is sub-divided into various parts:
Range: It is divided into two parts. Which is also divided into various parts such as:
8
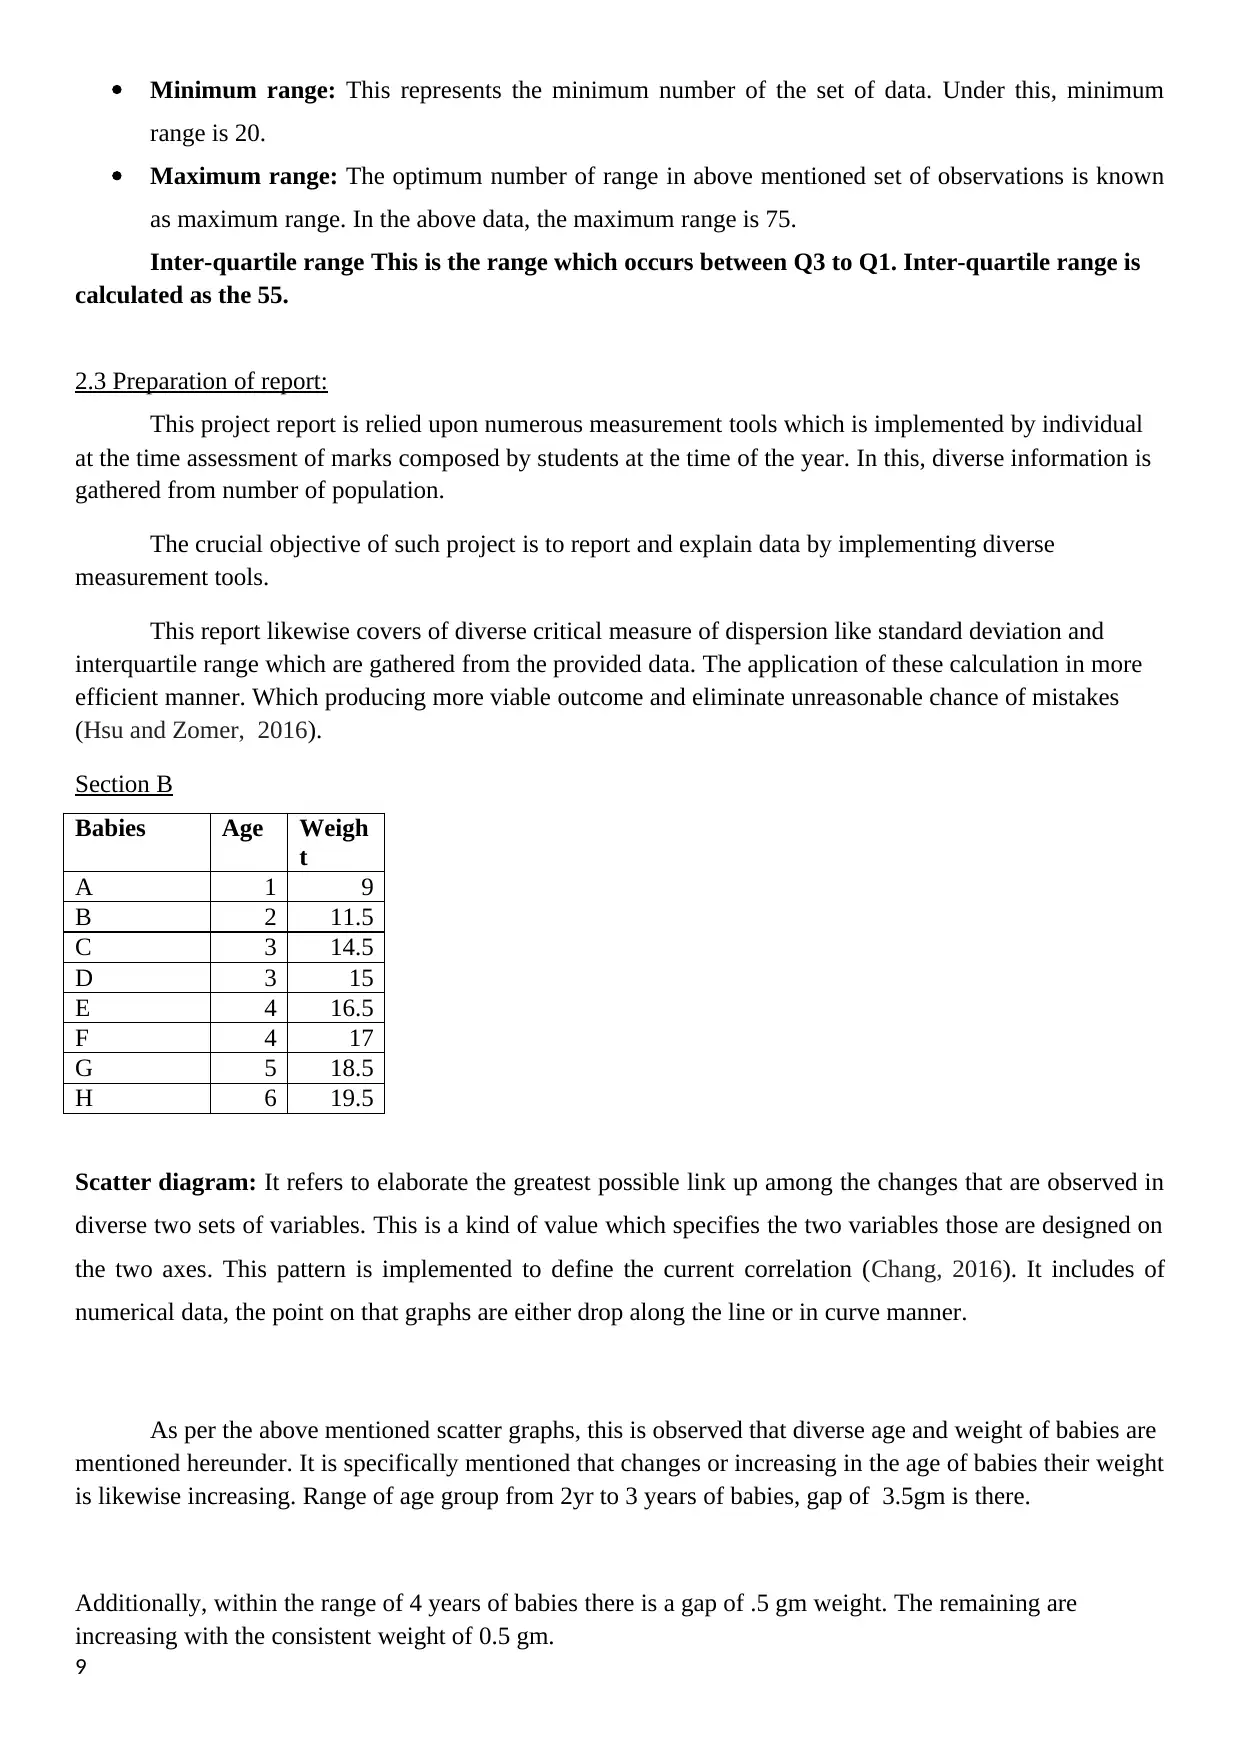
Minimum range: This represents the minimum number of the set of data. Under this, minimum
range is 20.
Maximum range: The optimum number of range in above mentioned set of observations is known
as maximum range. In the above data, the maximum range is 75.
Inter-quartile range This is the range which occurs between Q3 to Q1. Inter-quartile range is
calculated as the 55.
2.3 Preparation of report:
This project report is relied upon numerous measurement tools which is implemented by individual
at the time assessment of marks composed by students at the time of the year. In this, diverse information is
gathered from number of population.
The crucial objective of such project is to report and explain data by implementing diverse
measurement tools.
This report likewise covers of diverse critical measure of dispersion like standard deviation and
interquartile range which are gathered from the provided data. The application of these calculation in more
efficient manner. Which producing more viable outcome and eliminate unreasonable chance of mistakes
(Hsu and Zomer, 2016).
Section B
Babies Age Weigh
t
A 1 9
B 2 11.5
C 3 14.5
D 3 15
E 4 16.5
F 4 17
G 5 18.5
H 6 19.5
Scatter diagram: It refers to elaborate the greatest possible link up among the changes that are observed in
diverse two sets of variables. This is a kind of value which specifies the two variables those are designed on
the two axes. This pattern is implemented to define the current correlation (Chang, 2016). It includes of
numerical data, the point on that graphs are either drop along the line or in curve manner.
As per the above mentioned scatter graphs, this is observed that diverse age and weight of babies are
mentioned hereunder. It is specifically mentioned that changes or increasing in the age of babies their weight
is likewise increasing. Range of age group from 2yr to 3 years of babies, gap of 3.5gm is there.
Additionally, within the range of 4 years of babies there is a gap of .5 gm weight. The remaining are
increasing with the consistent weight of 0.5 gm.
9
⊘ This is a preview!⊘
Do you want full access?
Subscribe today to unlock all pages.
Trusted by 1+ million students worldwide
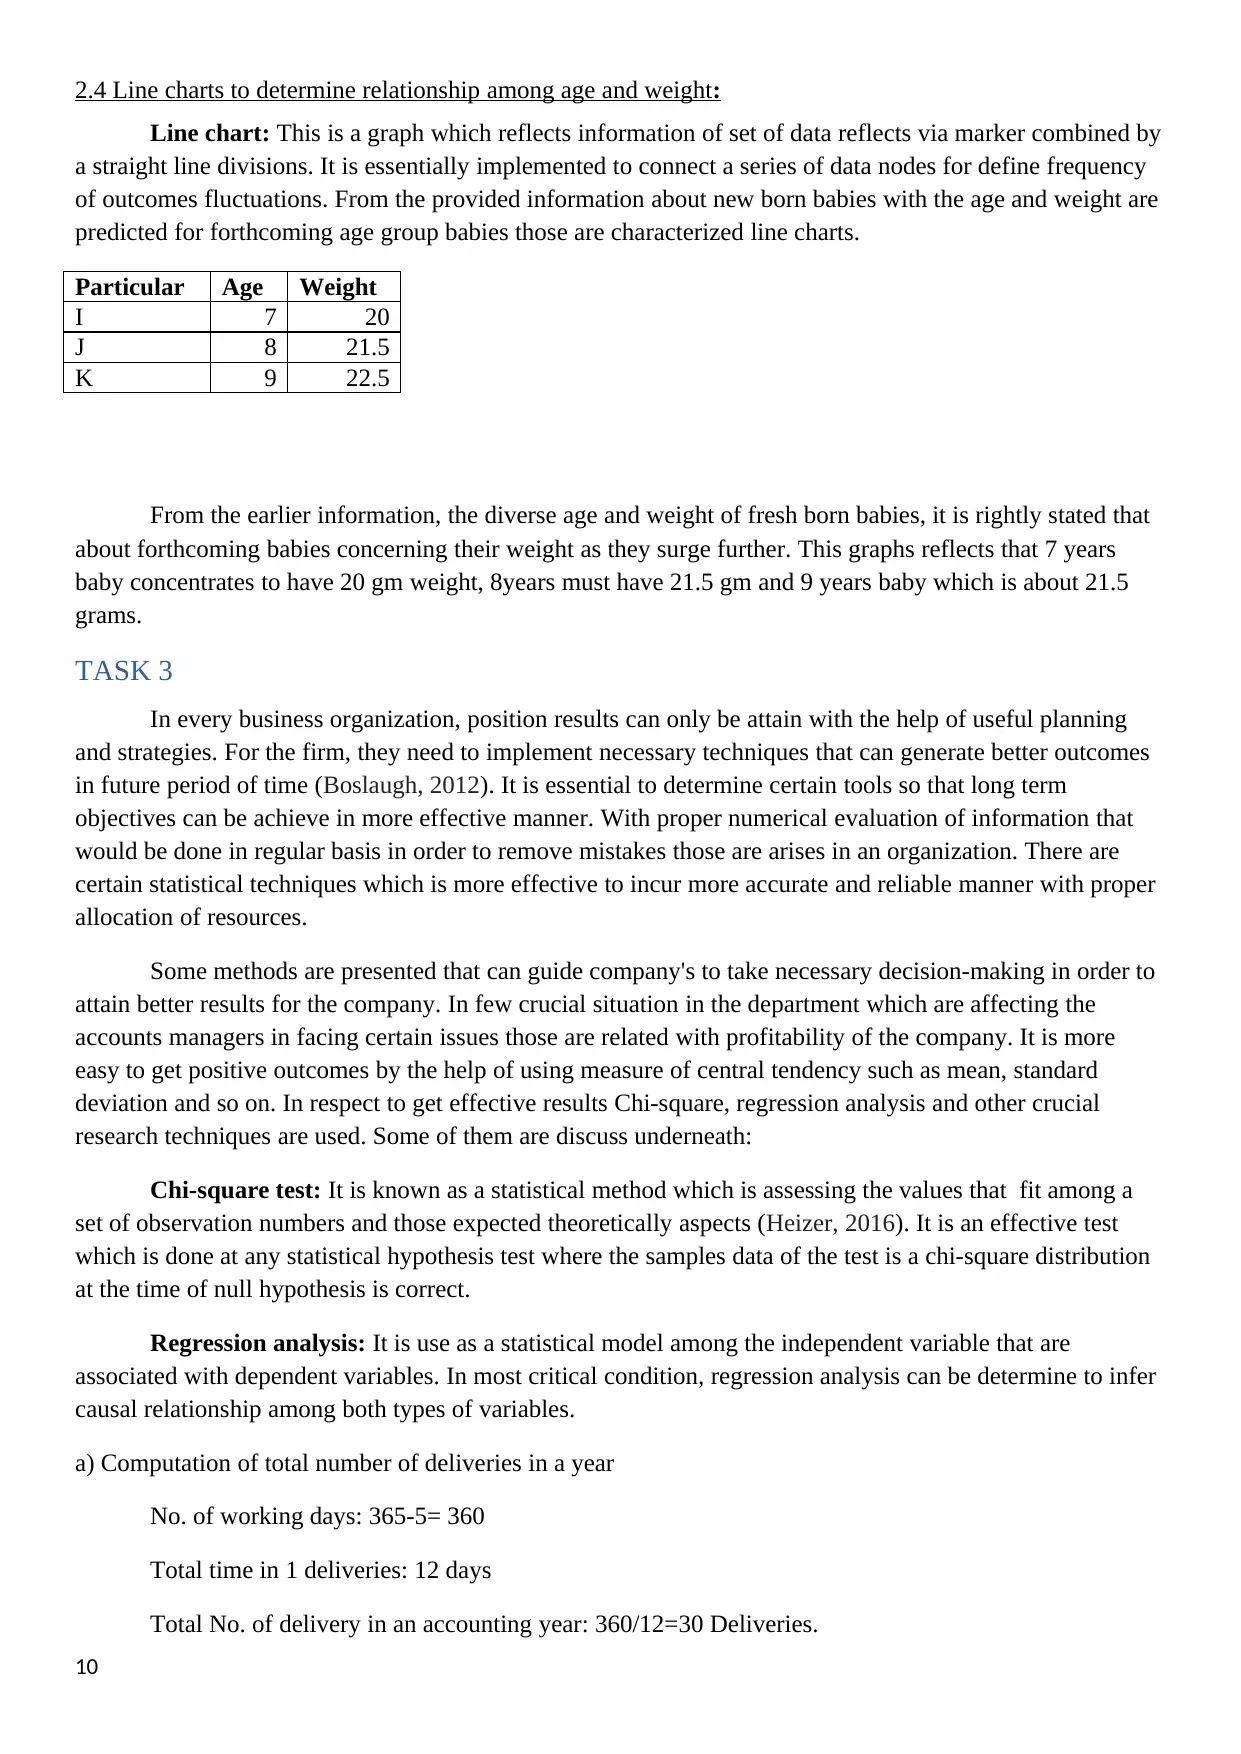
2.4 Line charts to determine relationship among age and weight:
Line chart: This is a graph which reflects information of set of data reflects via marker combined by
a straight line divisions. It is essentially implemented to connect a series of data nodes for define frequency
of outcomes fluctuations. From the provided information about new born babies with the age and weight are
predicted for forthcoming age group babies those are characterized line charts.
Particular Age Weight
I 7 20
J 8 21.5
K 9 22.5
From the earlier information, the diverse age and weight of fresh born babies, it is rightly stated that
about forthcoming babies concerning their weight as they surge further. This graphs reflects that 7 years
baby concentrates to have 20 gm weight, 8years must have 21.5 gm and 9 years baby which is about 21.5
grams.
TASK 3
In every business organization, position results can only be attain with the help of useful planning
and strategies. For the firm, they need to implement necessary techniques that can generate better outcomes
in future period of time (Boslaugh, 2012). It is essential to determine certain tools so that long term
objectives can be achieve in more effective manner. With proper numerical evaluation of information that
would be done in regular basis in order to remove mistakes those are arises in an organization. There are
certain statistical techniques which is more effective to incur more accurate and reliable manner with proper
allocation of resources.
Some methods are presented that can guide company's to take necessary decision-making in order to
attain better results for the company. In few crucial situation in the department which are affecting the
accounts managers in facing certain issues those are related with profitability of the company. It is more
easy to get positive outcomes by the help of using measure of central tendency such as mean, standard
deviation and so on. In respect to get effective results Chi-square, regression analysis and other crucial
research techniques are used. Some of them are discuss underneath:
Chi-square test: It is known as a statistical method which is assessing the values that fit among a
set of observation numbers and those expected theoretically aspects (Heizer, 2016). It is an effective test
which is done at any statistical hypothesis test where the samples data of the test is a chi-square distribution
at the time of null hypothesis is correct.
Regression analysis: It is use as a statistical model among the independent variable that are
associated with dependent variables. In most critical condition, regression analysis can be determine to infer
causal relationship among both types of variables.
a) Computation of total number of deliveries in a year
No. of working days: 365-5= 360
Total time in 1 deliveries: 12 days
Total No. of delivery in an accounting year: 360/12=30 Deliveries.
10
Paraphrase This Document
Need a fresh take? Get an instant paraphrase of this document with our AI Paraphraser
b): Evaluation of no. of bottle in each set of delivery
Total Requirements of bottle: 450000
Total number of deliveries: 30
Delivery per bottle: 450000/30= 15000 bottles
c) EOQ:
It is known as optimum quantity of products to be buy at one time in order to control the total costs
of ordering and holding cost in inventories. It is determine as total maximum lot size of stock available with
the company. It is one of the oldest classical production models which is helpful in analyzing quantity of a
product.
EOQ=√2RO/C
=√2*450000*20/0.50
=6000 bottles
d) Modification and recommendation
For the production of each units of products certain cost are being incur which can be determine as
fixed and variable cost. However, variable cost is those are cost which are changes according to production
of extra units (Berenson, Levine, Szabat and Krehbiel, 2012). Whereas, fixed costs are remaining fixed at
every stage of production. It is useful for managers to carry out their operation with the help of using
information about the company resources in order to increase competitive advantage over other firm.
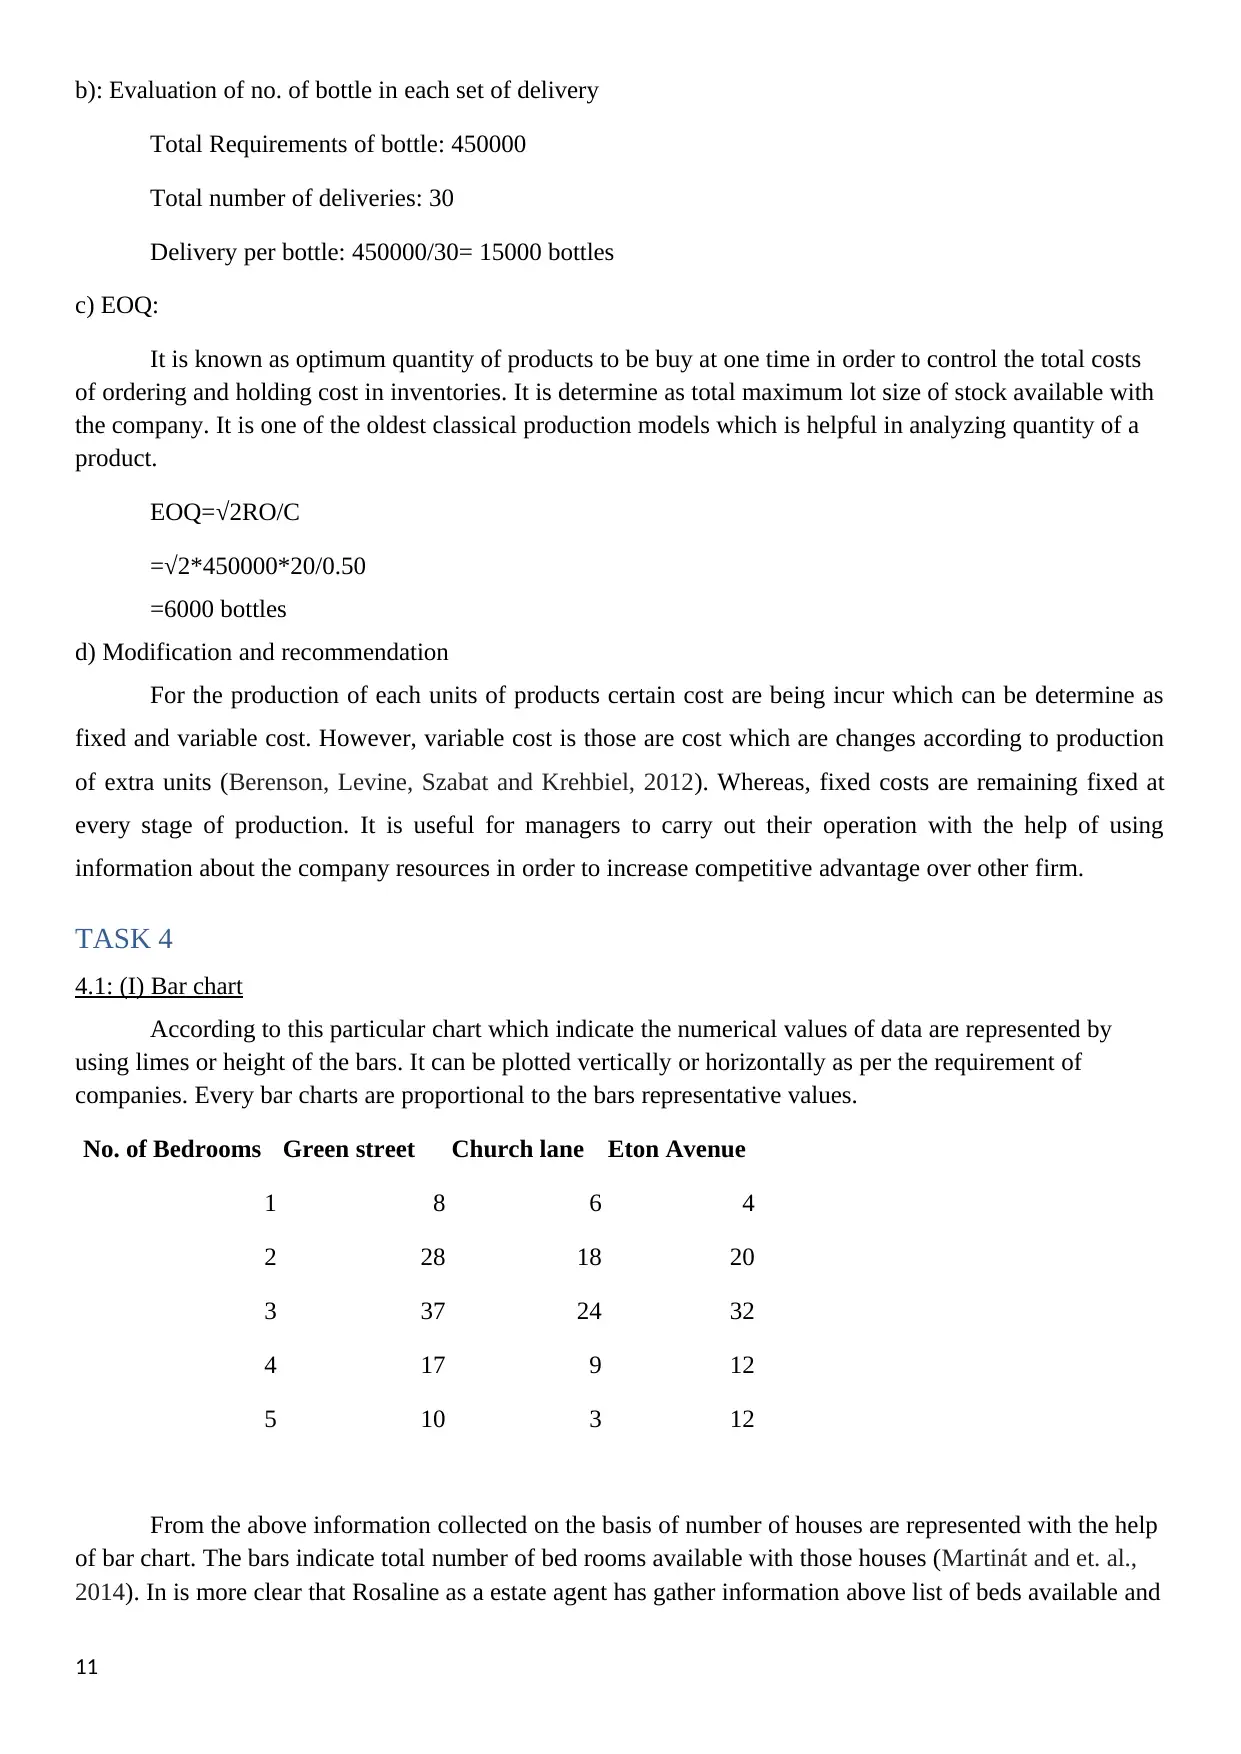
TASK 4
4.1: (I) Bar chart
According to this particular chart which indicate the numerical values of data are represented by
using limes or height of the bars. It can be plotted vertically or horizontally as per the requirement of
companies. Every bar charts are proportional to the bars representative values.
No. of Bedrooms Green street Church lane Eton Avenue
1 8 6 4
2 28 18 20
3 37 24 32
4 17 9 12
5 10 3 12
From the above information collected on the basis of number of houses are represented with the help
of bar chart. The bars indicate total number of bed rooms available with those houses (Martinát and et. al.,
2014). In is more clear that Rosaline as a estate agent has gather information above list of beds available and
11
Total Requirements of bottle: 450000
Total number of deliveries: 30
Delivery per bottle: 450000/30= 15000 bottles
c) EOQ:
It is known as optimum quantity of products to be buy at one time in order to control the total costs
of ordering and holding cost in inventories. It is determine as total maximum lot size of stock available with
the company. It is one of the oldest classical production models which is helpful in analyzing quantity of a
product.
EOQ=√2RO/C
=√2*450000*20/0.50
=6000 bottles
d) Modification and recommendation
For the production of each units of products certain cost are being incur which can be determine as
fixed and variable cost. However, variable cost is those are cost which are changes according to production
of extra units (Berenson, Levine, Szabat and Krehbiel, 2012). Whereas, fixed costs are remaining fixed at
every stage of production. It is useful for managers to carry out their operation with the help of using
information about the company resources in order to increase competitive advantage over other firm.
TASK 4
4.1: (I) Bar chart
According to this particular chart which indicate the numerical values of data are represented by
using limes or height of the bars. It can be plotted vertically or horizontally as per the requirement of
companies. Every bar charts are proportional to the bars representative values.
No. of Bedrooms Green street Church lane Eton Avenue
1 8 6 4
2 28 18 20
3 37 24 32
4 17 9 12
5 10 3 12
From the above information collected on the basis of number of houses are represented with the help
of bar chart. The bars indicate total number of bed rooms available with those houses (Martinát and et. al.,
2014). In is more clear that Rosaline as a estate agent has gather information above list of beds available and
11
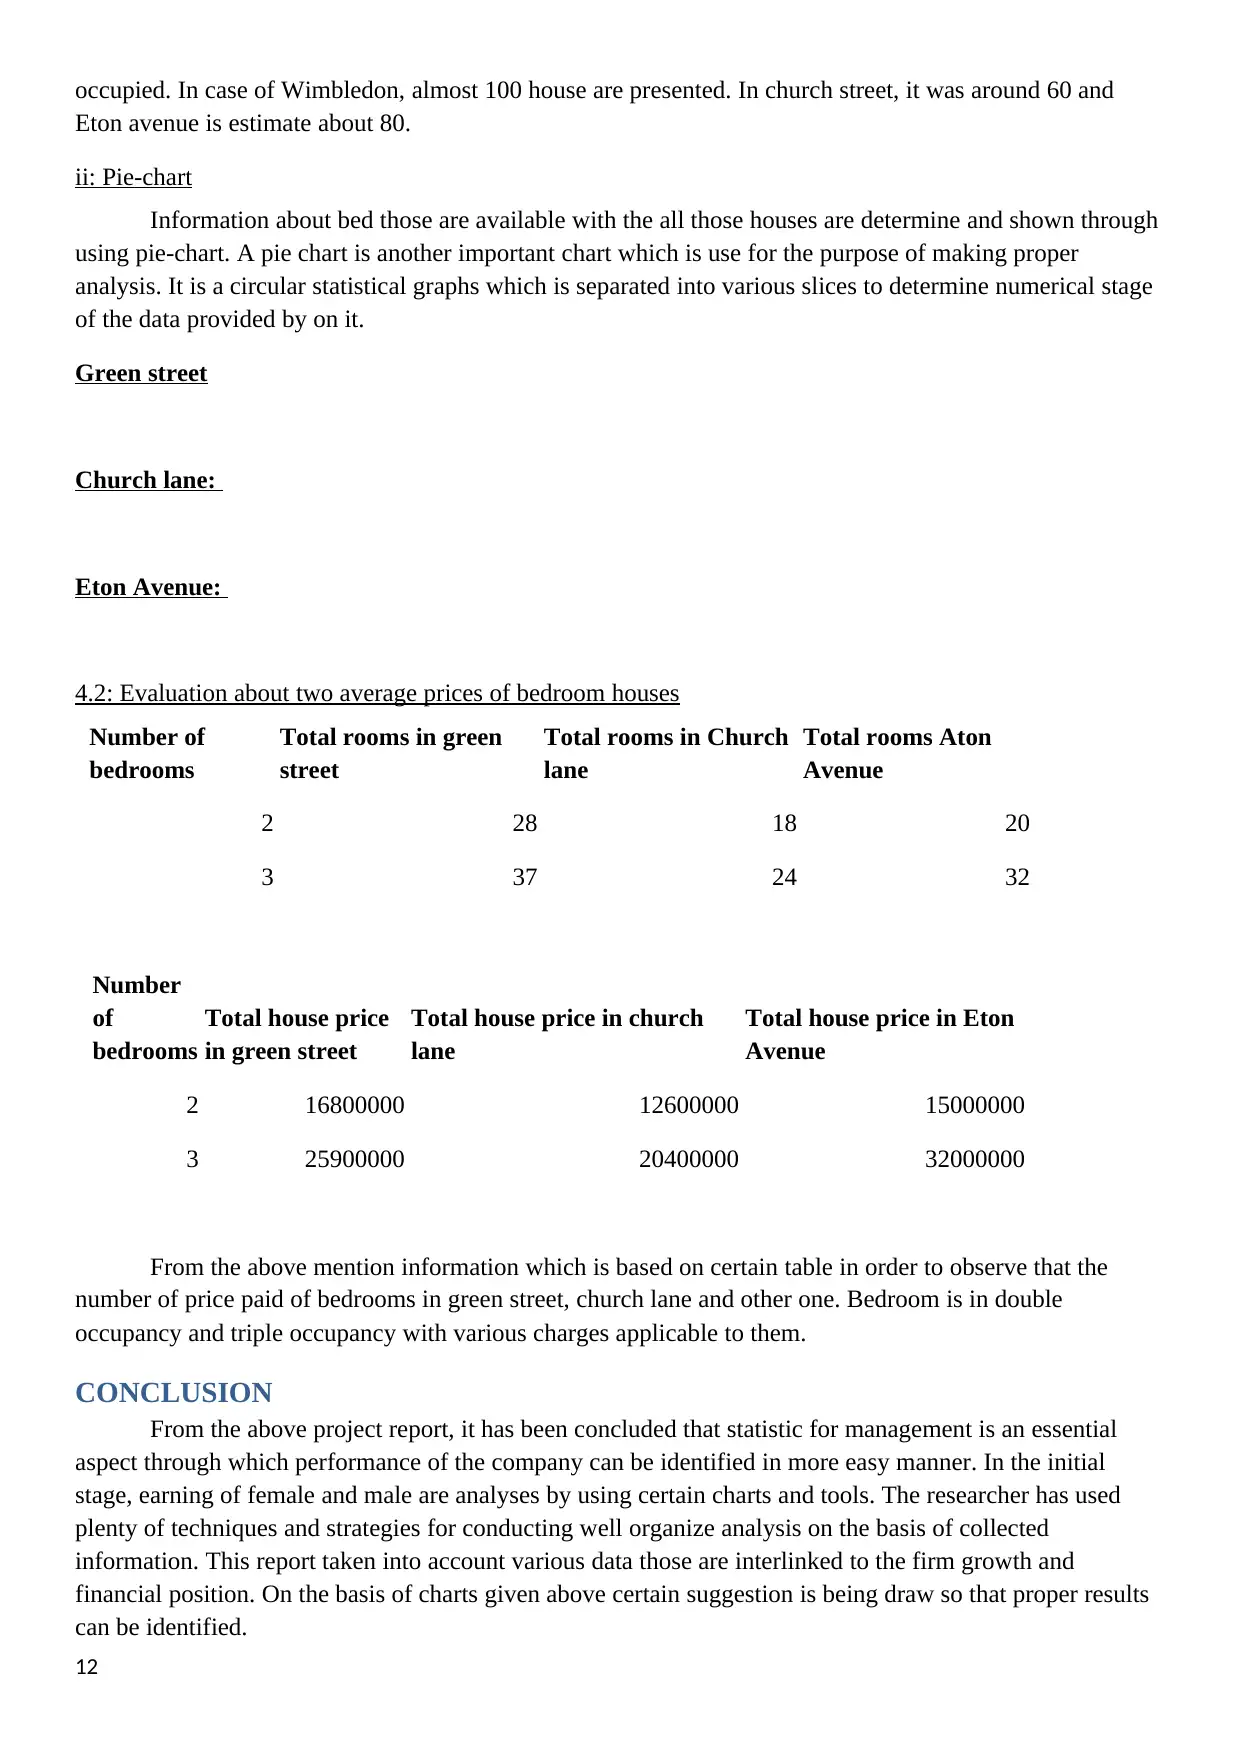
occupied. In case of Wimbledon, almost 100 house are presented. In church street, it was around 60 and
Eton avenue is estimate about 80.
ii: Pie-chart
Information about bed those are available with the all those houses are determine and shown through
using pie-chart. A pie chart is another important chart which is use for the purpose of making proper
analysis. It is a circular statistical graphs which is separated into various slices to determine numerical stage
of the data provided by on it.
Green street
Church lane:
Eton Avenue:
4.2: Evaluation about two average prices of bedroom houses
Number of
bedrooms
Total rooms in green
street
Total rooms in Church
lane
Total rooms Aton
Avenue
2 28 18 20
3 37 24 32
Number
of
bedrooms
Total house price
in green street
Total house price in church
lane
Total house price in Eton
Avenue
2 16800000 12600000 15000000
3 25900000 20400000 32000000
From the above mention information which is based on certain table in order to observe that the
number of price paid of bedrooms in green street, church lane and other one. Bedroom is in double
occupancy and triple occupancy with various charges applicable to them.
CONCLUSION
From the above project report, it has been concluded that statistic for management is an essential
aspect through which performance of the company can be identified in more easy manner. In the initial
stage, earning of female and male are analyses by using certain charts and tools. The researcher has used
plenty of techniques and strategies for conducting well organize analysis on the basis of collected
information. This report taken into account various data those are interlinked to the firm growth and
financial position. On the basis of charts given above certain suggestion is being draw so that proper results
can be identified.
12
⊘ This is a preview!⊘
Do you want full access?
Subscribe today to unlock all pages.
Trusted by 1+ million students worldwide
1 out of 15
Related Documents


Your All-in-One AI-Powered Toolkit for Academic Success.
+13062052269
info@desklib.com
Available 24*7 on WhatsApp / Email
![[object Object]](/_next/static/media/star-bottom.7253800d.svg)
Unlock your academic potential
Copyright © 2020–2026 A2Z Services. All Rights Reserved. Developed and managed by ZUCOL.