Statistics Assignment: Data Analysis, Probability & Interpretation
VerifiedAdded on 2023/04/23
|15
|2055
|479
Homework Assignment
AI Summary
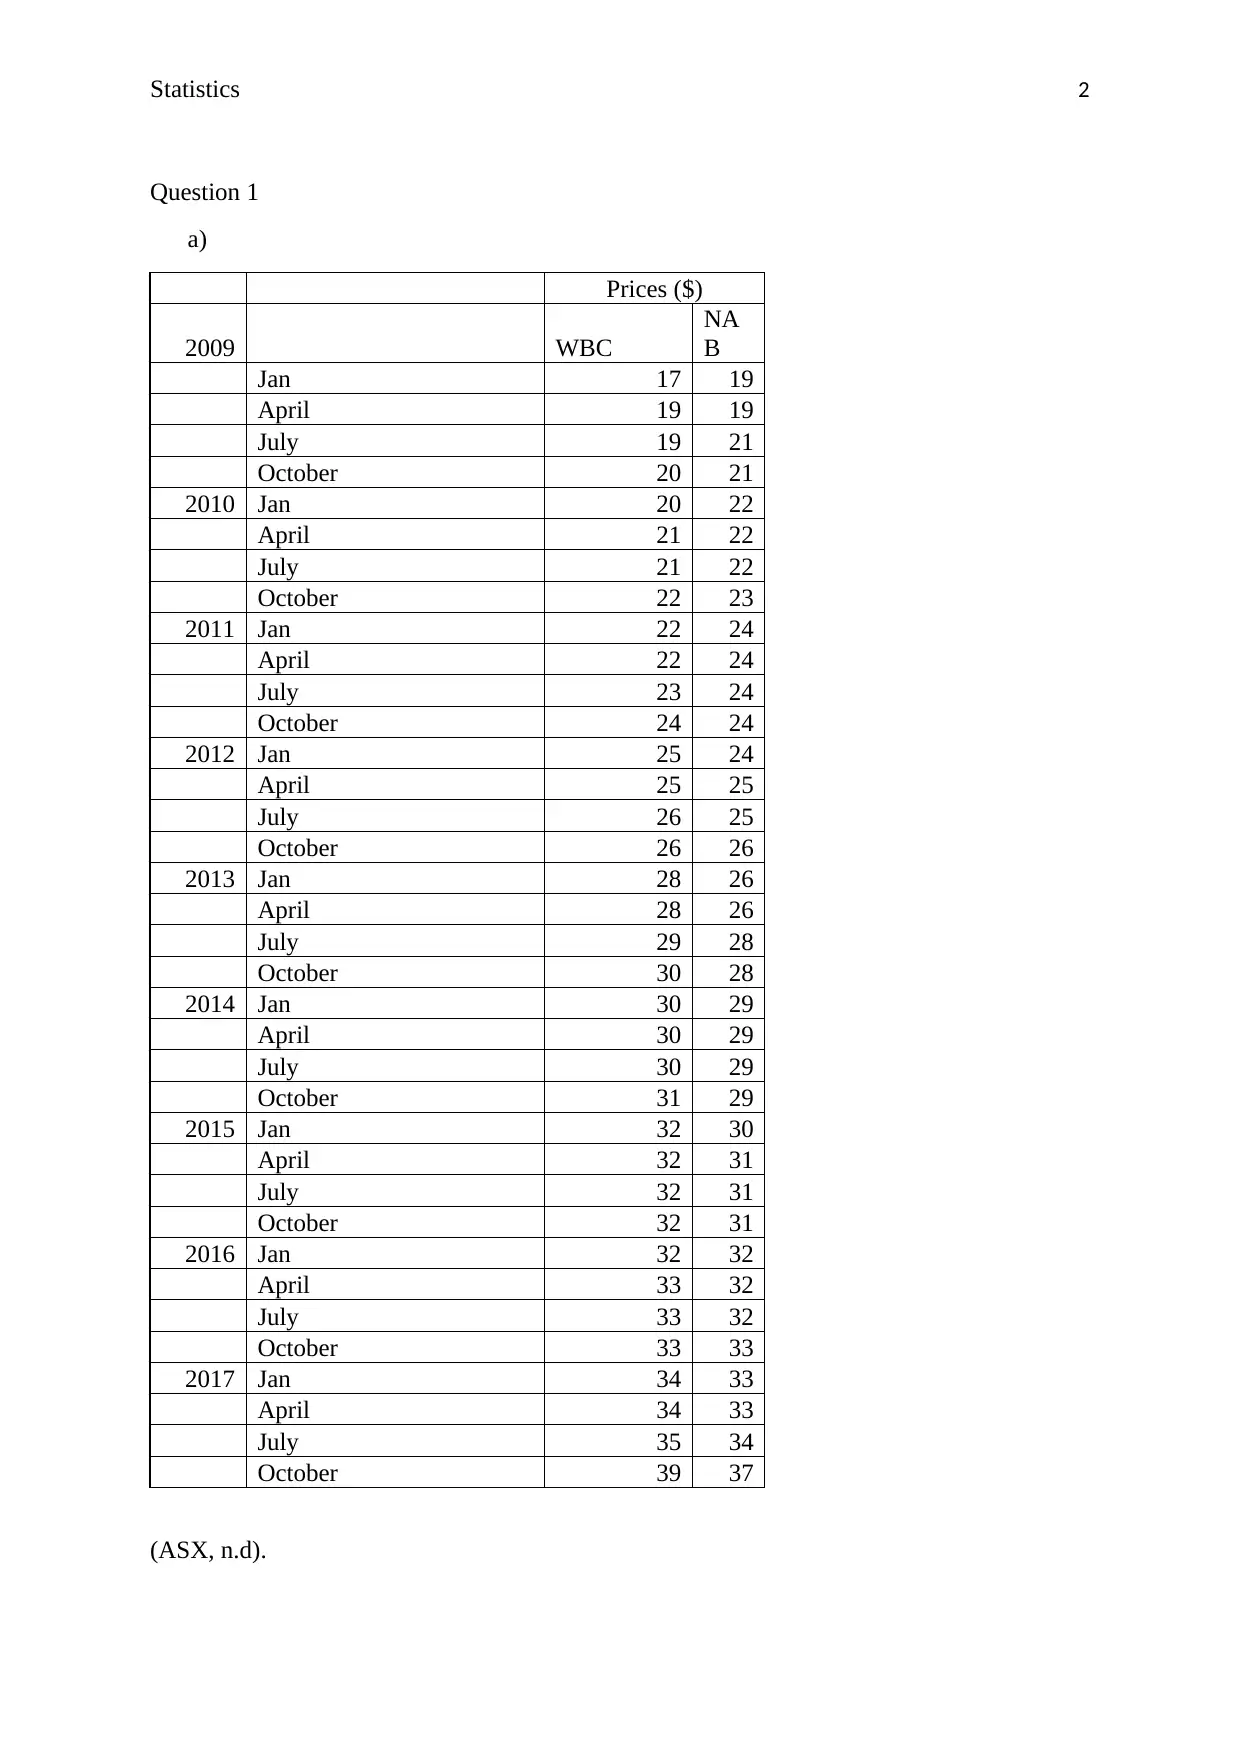
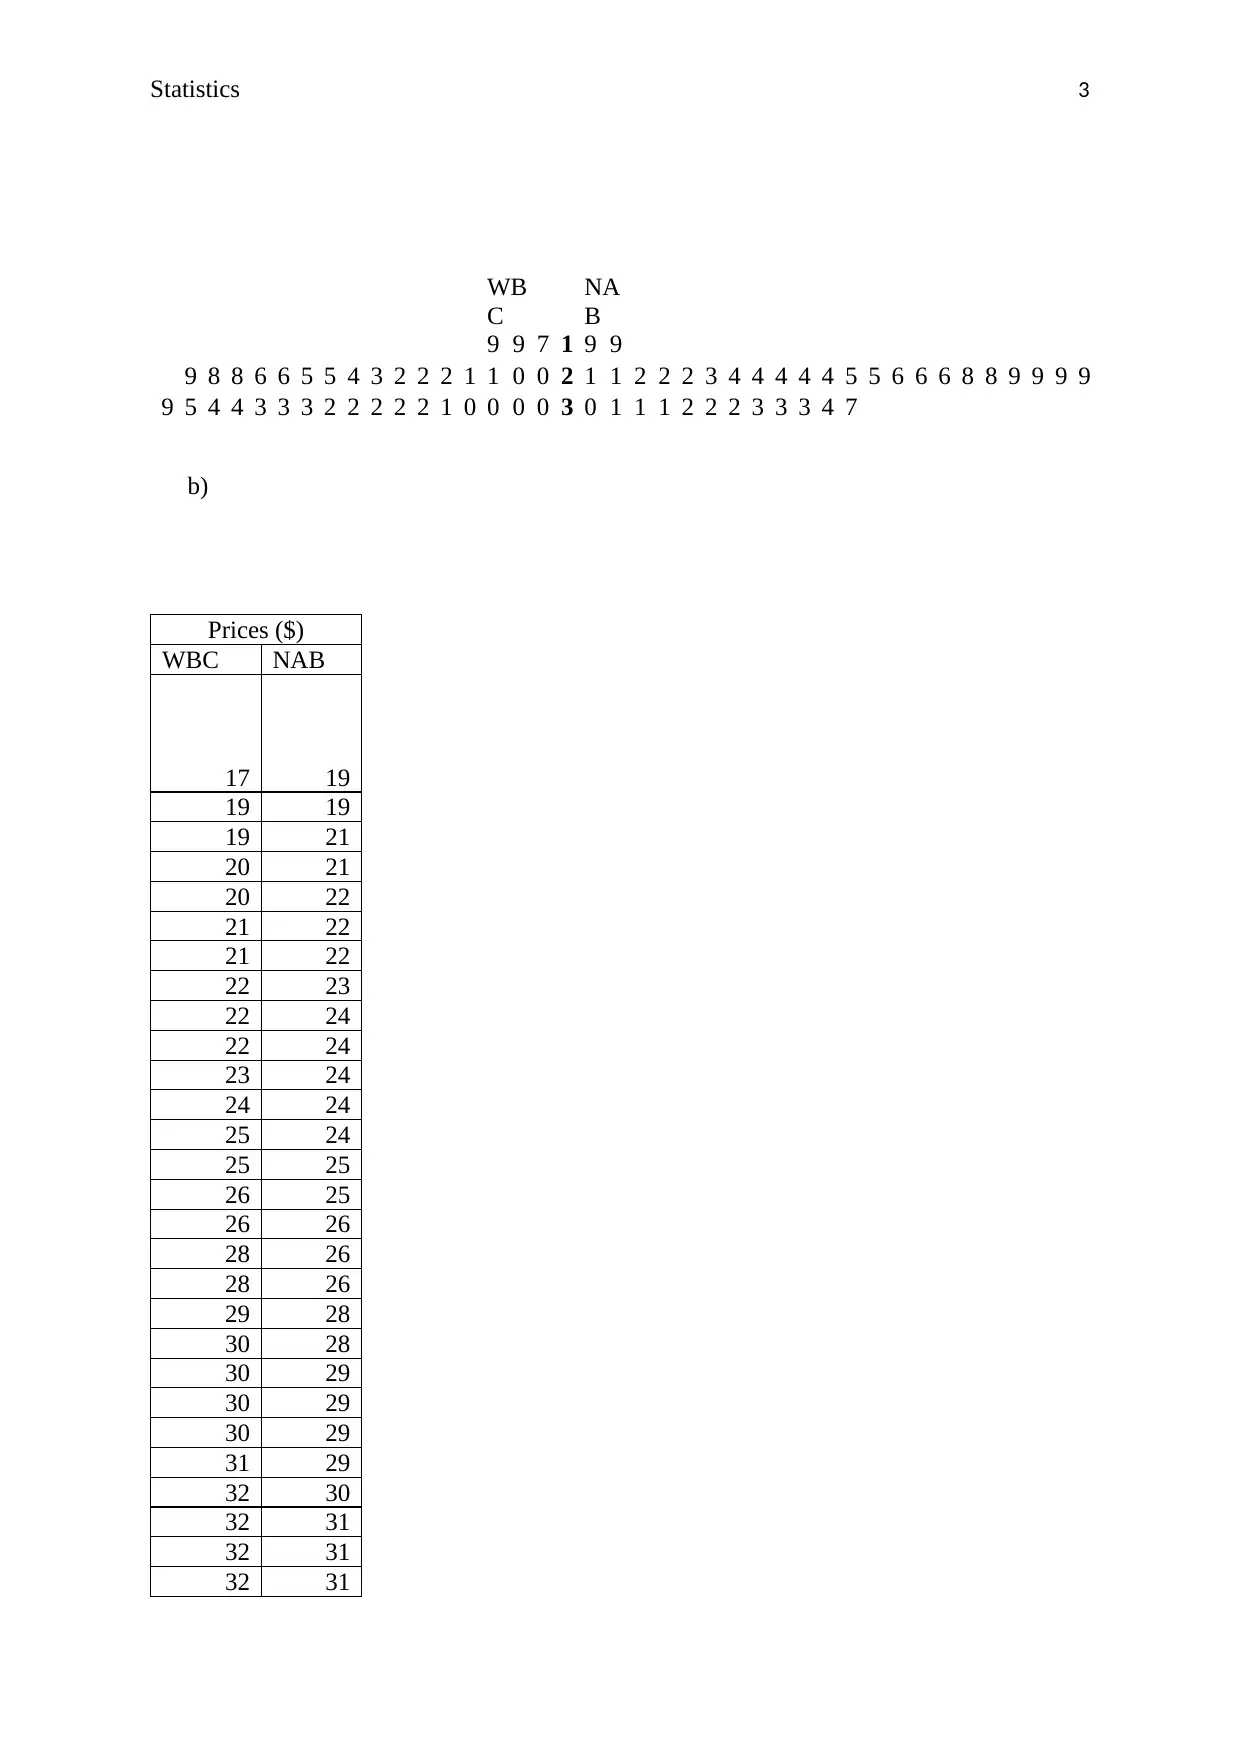
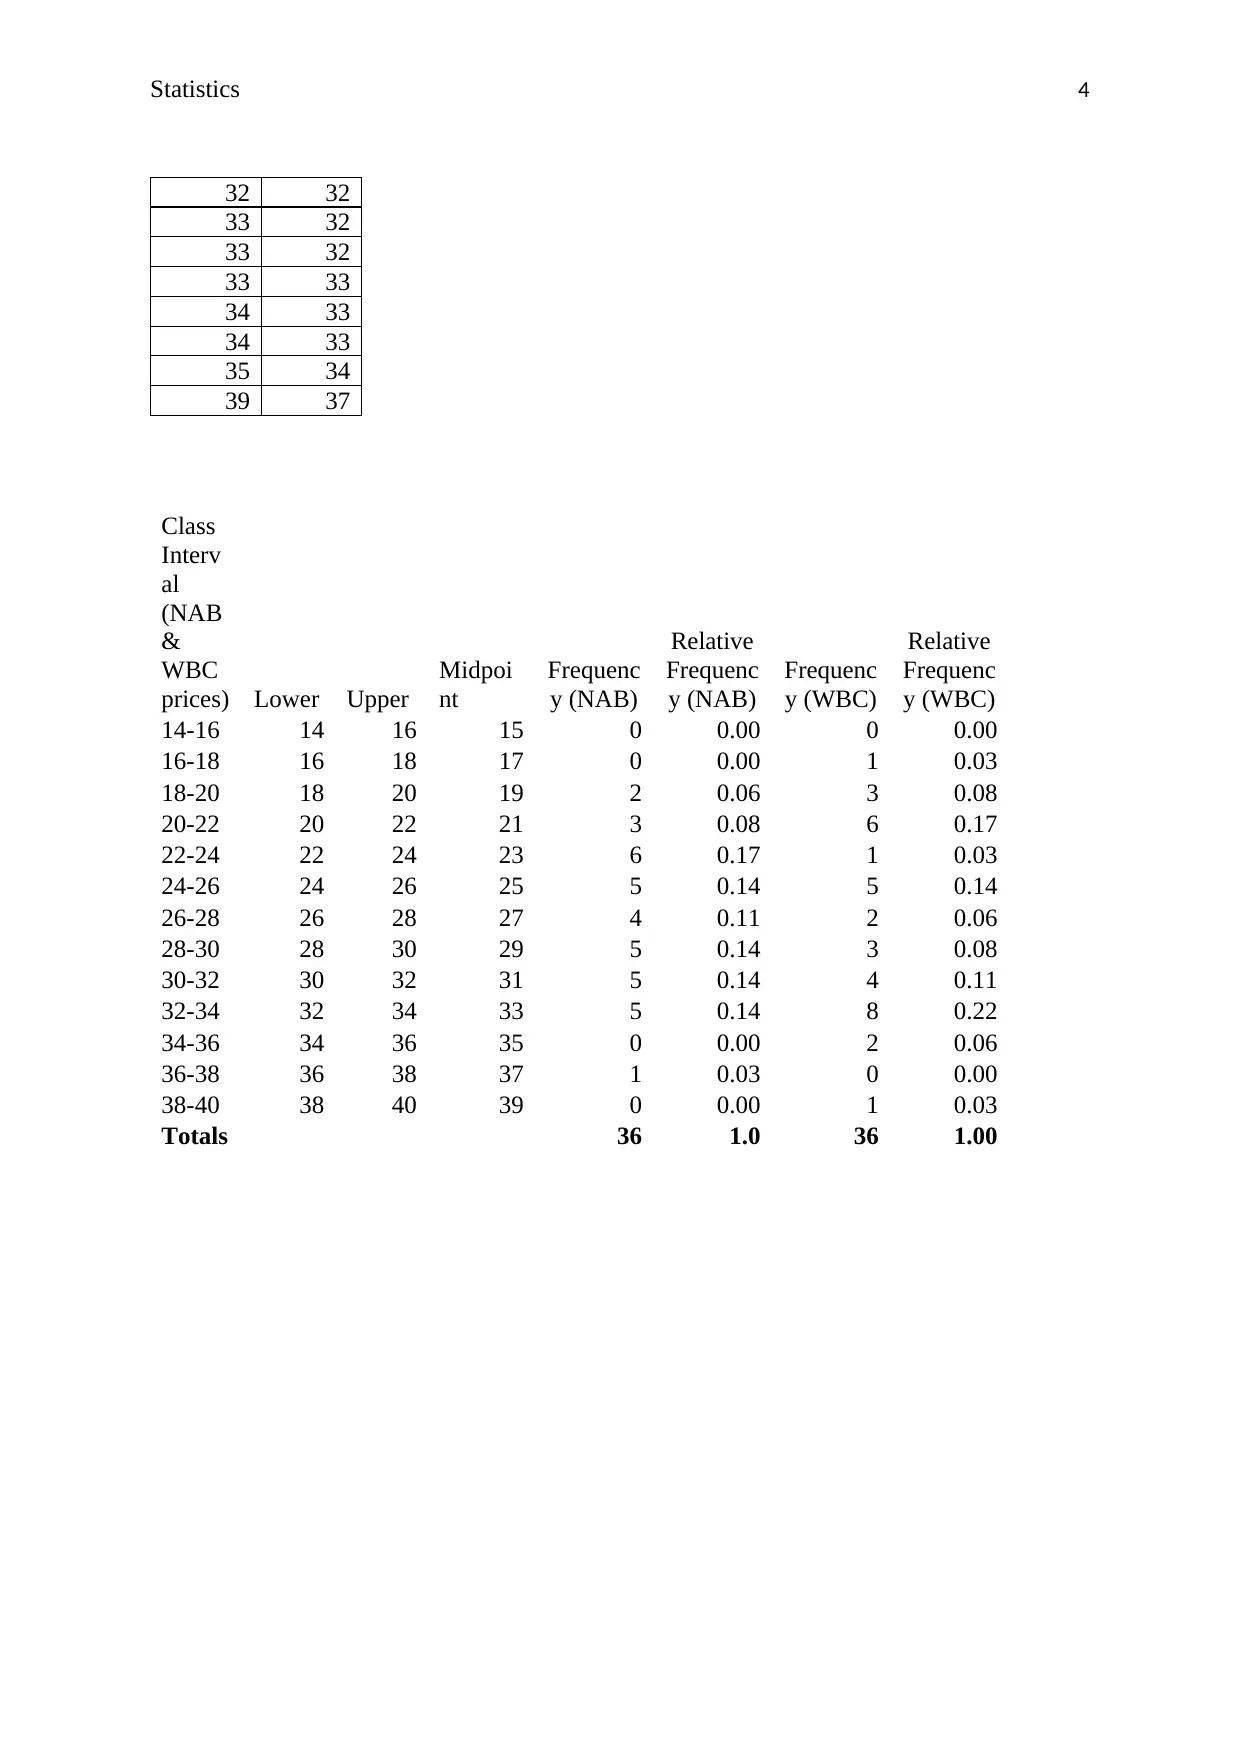
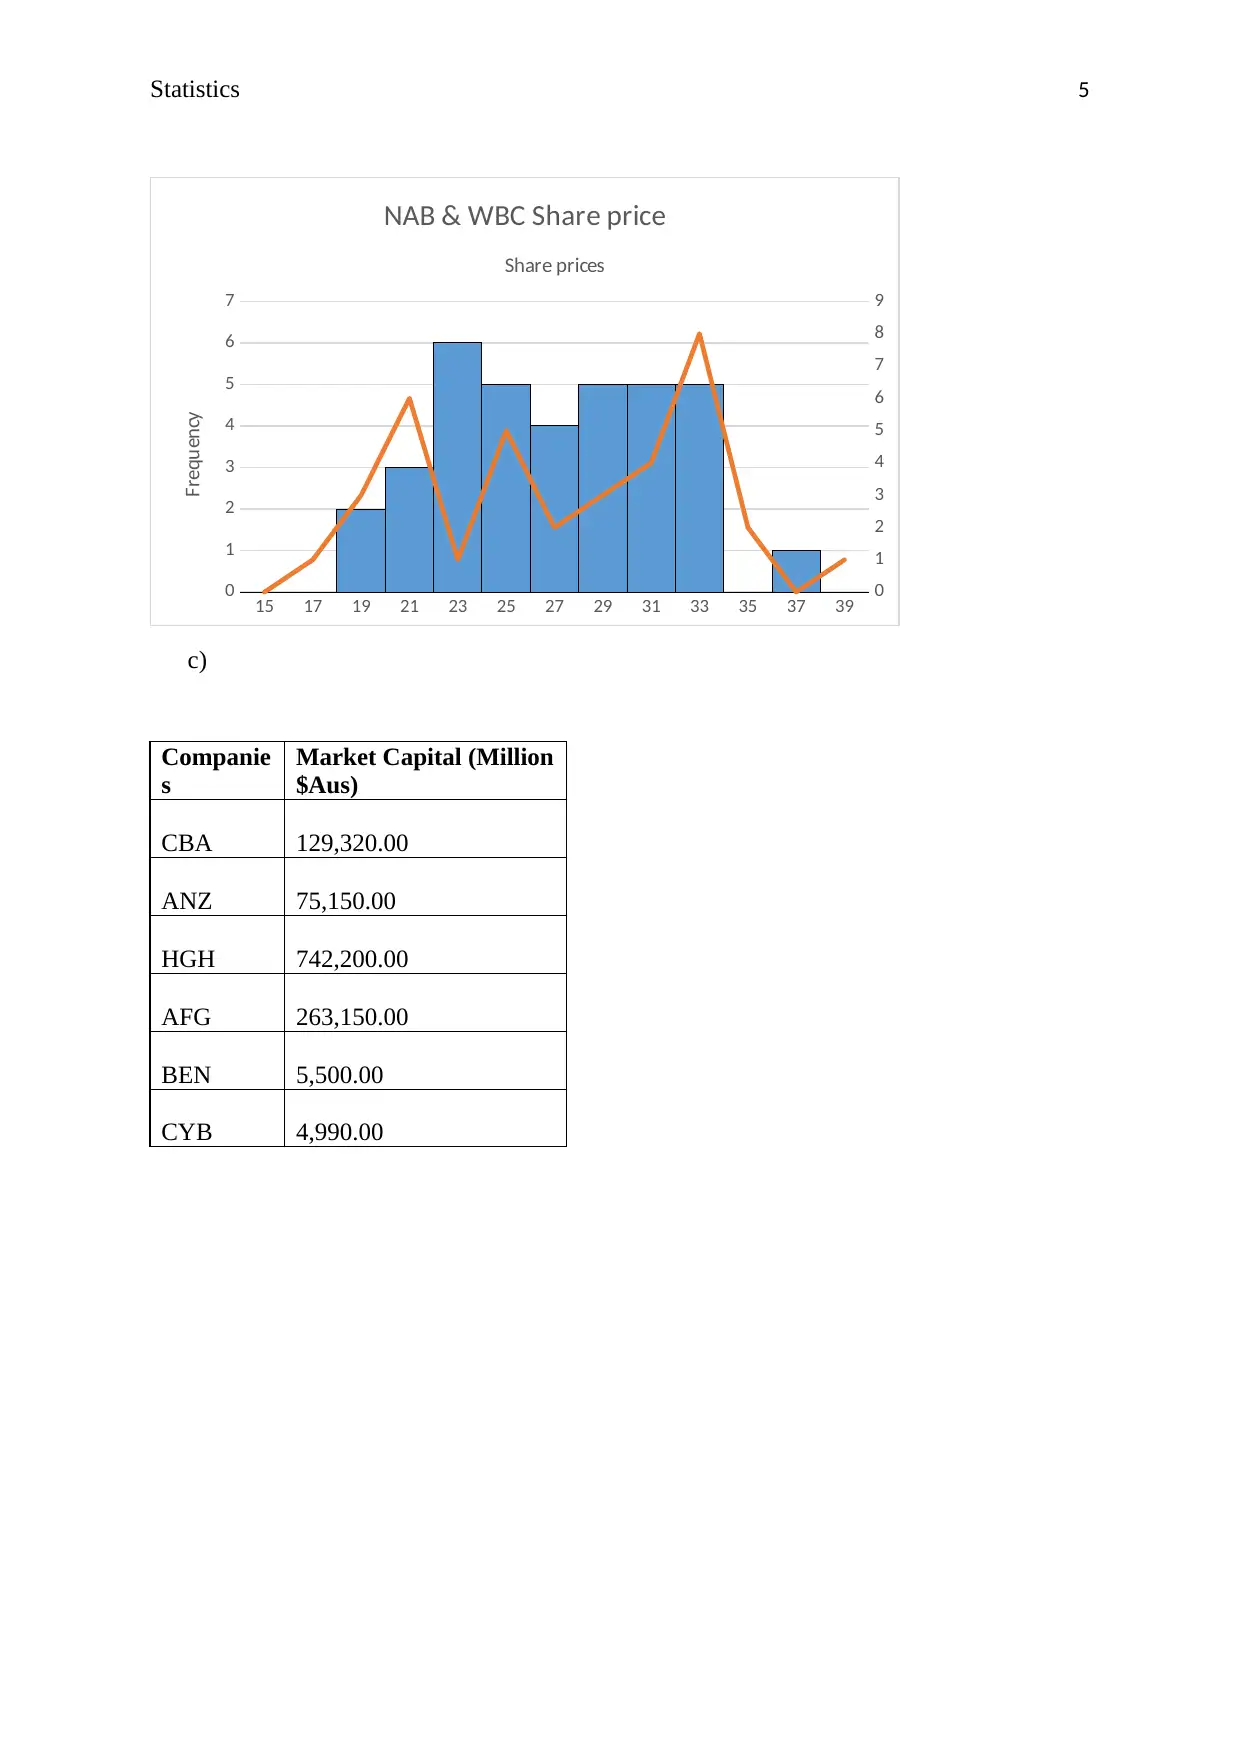
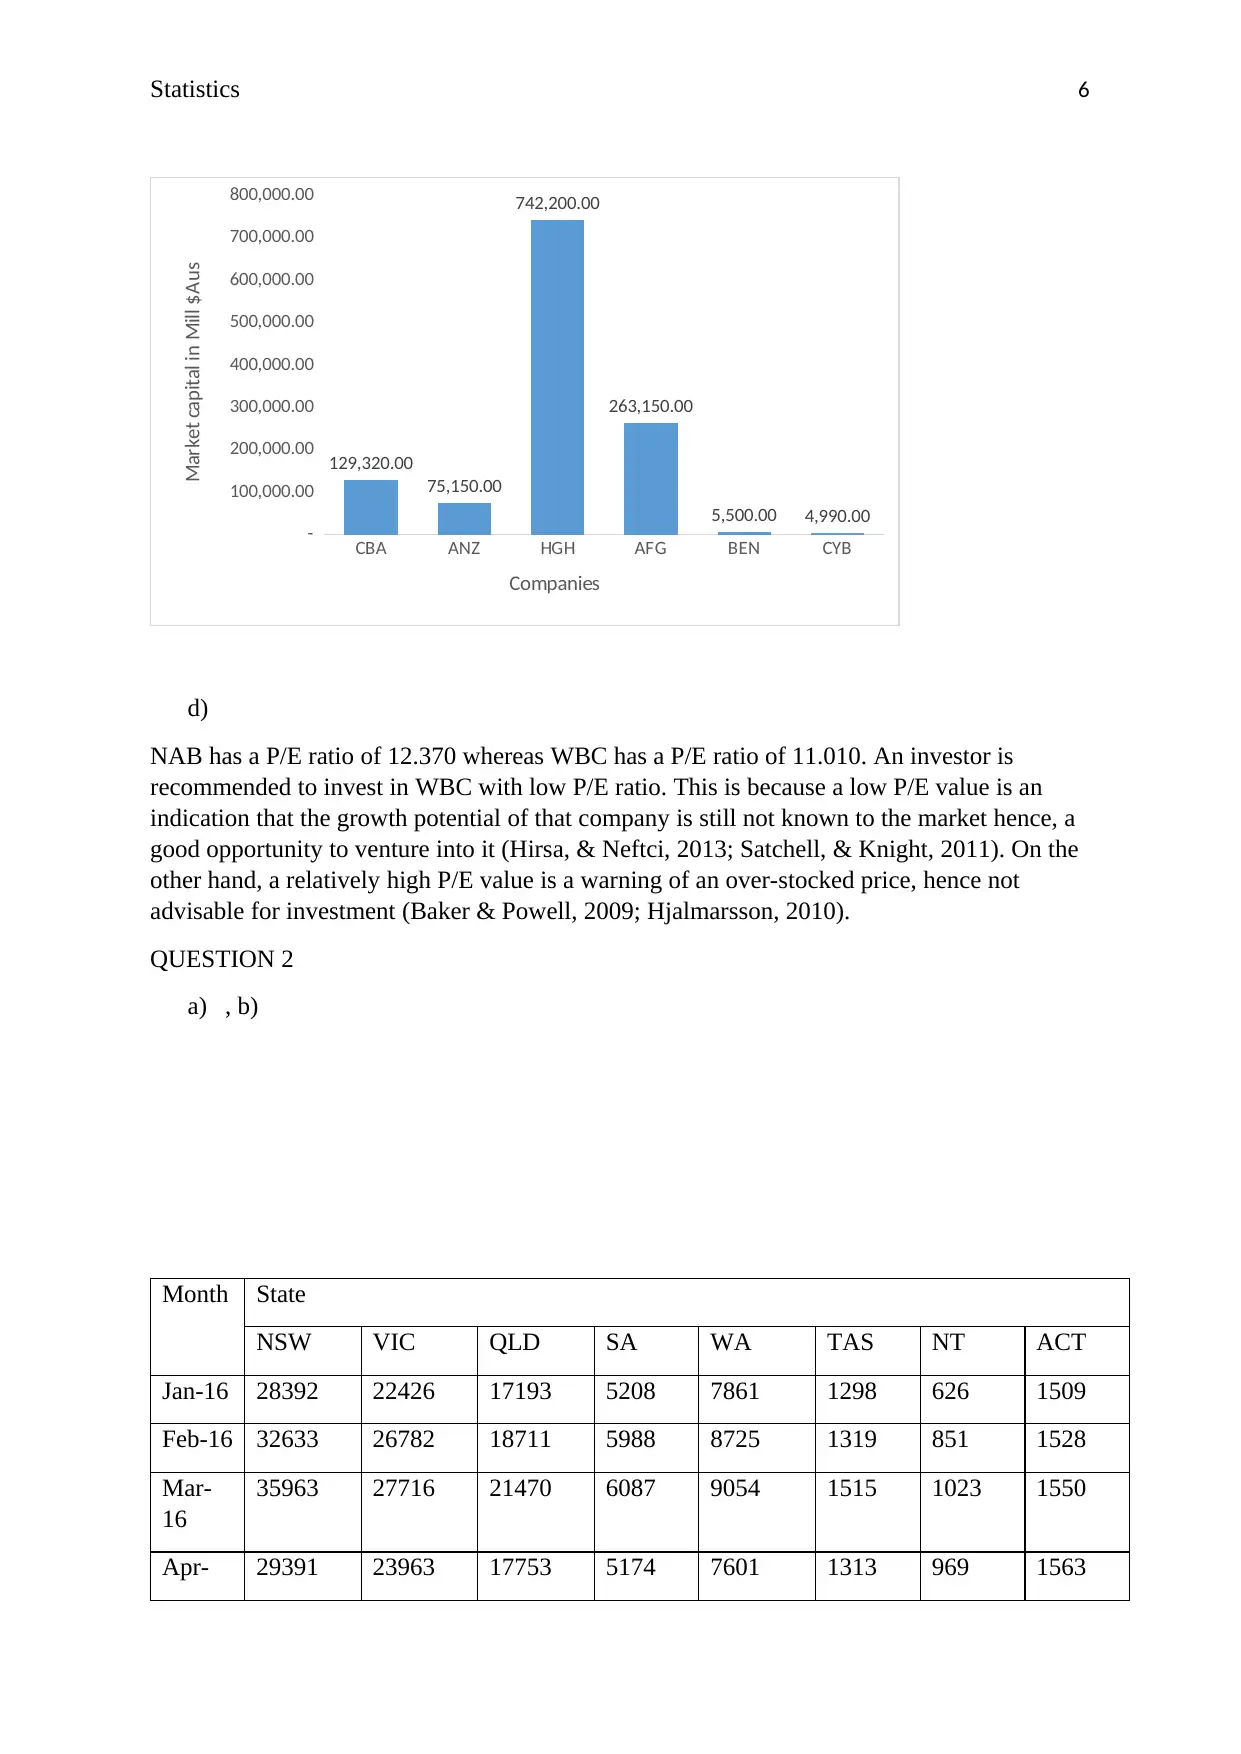
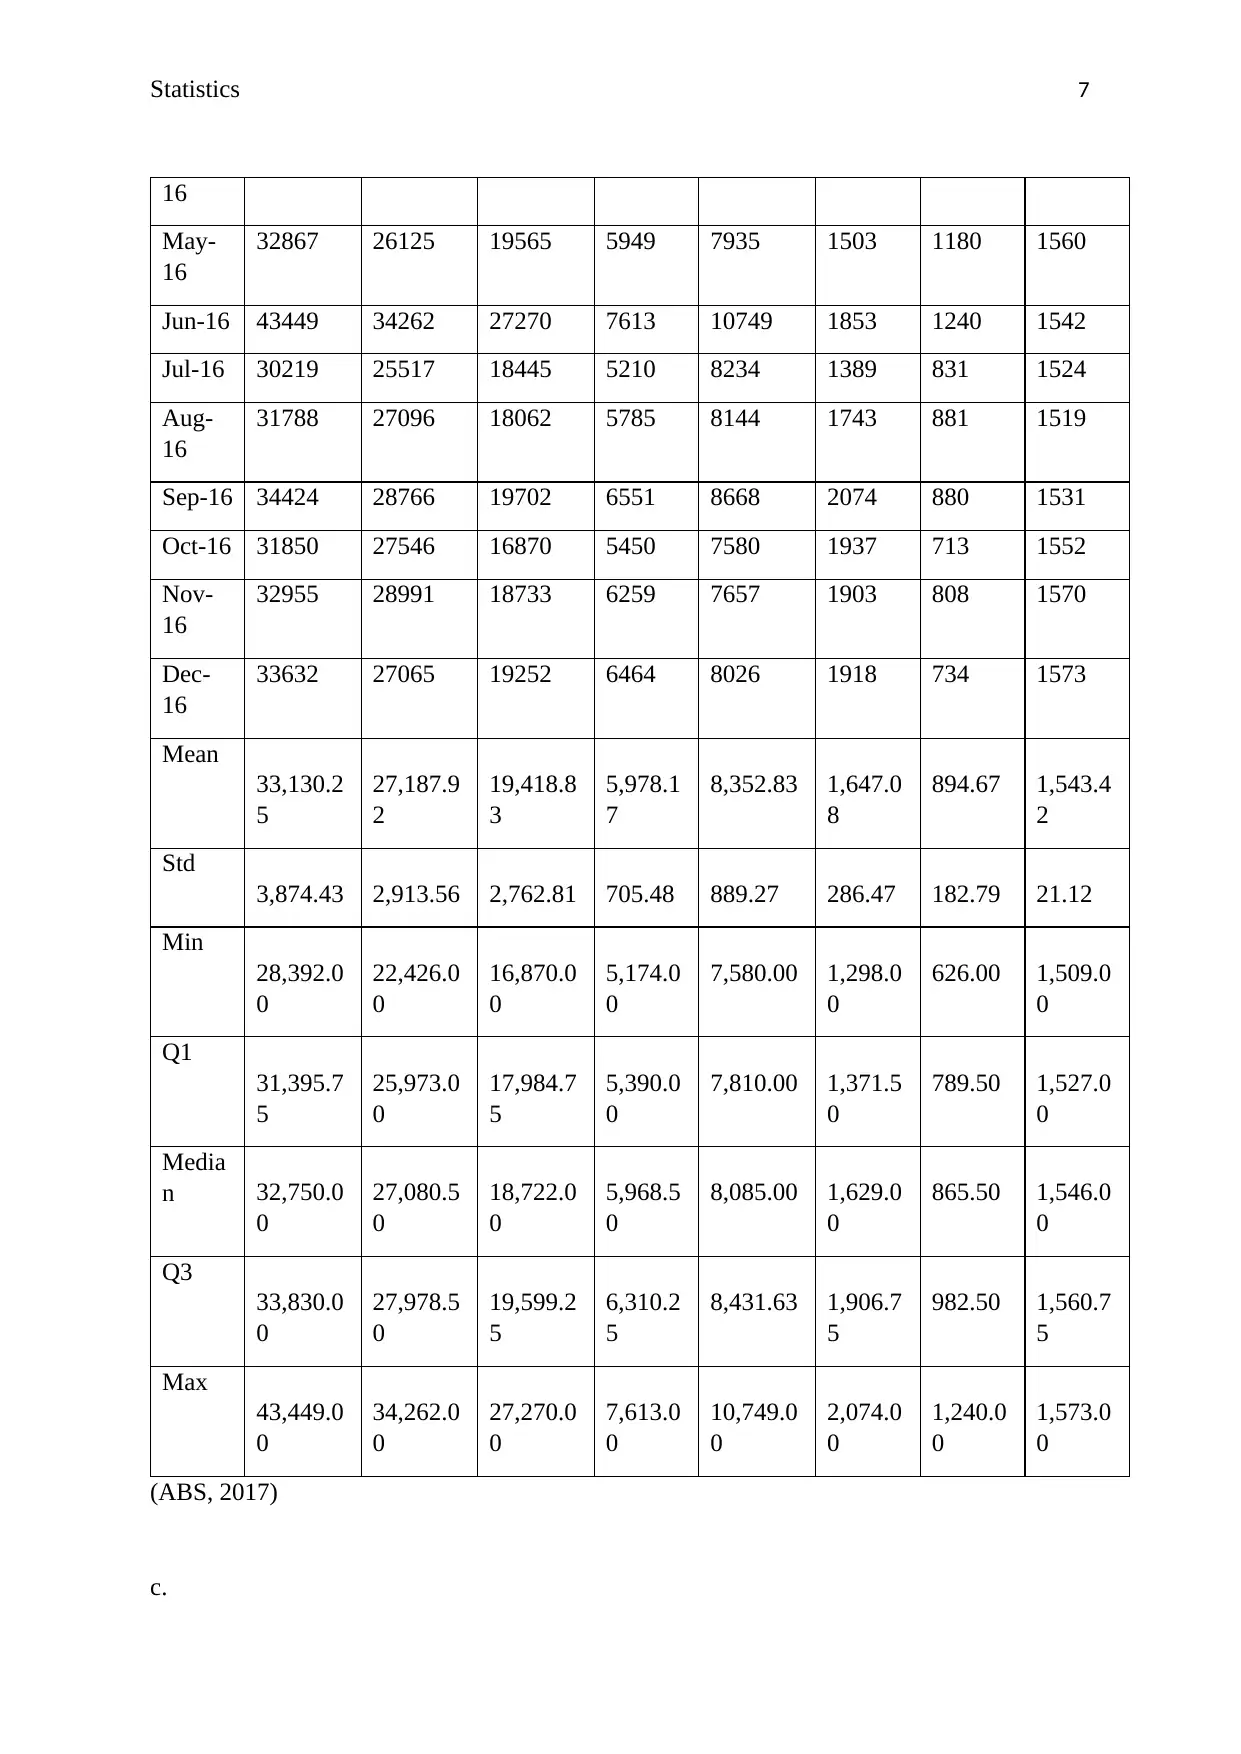
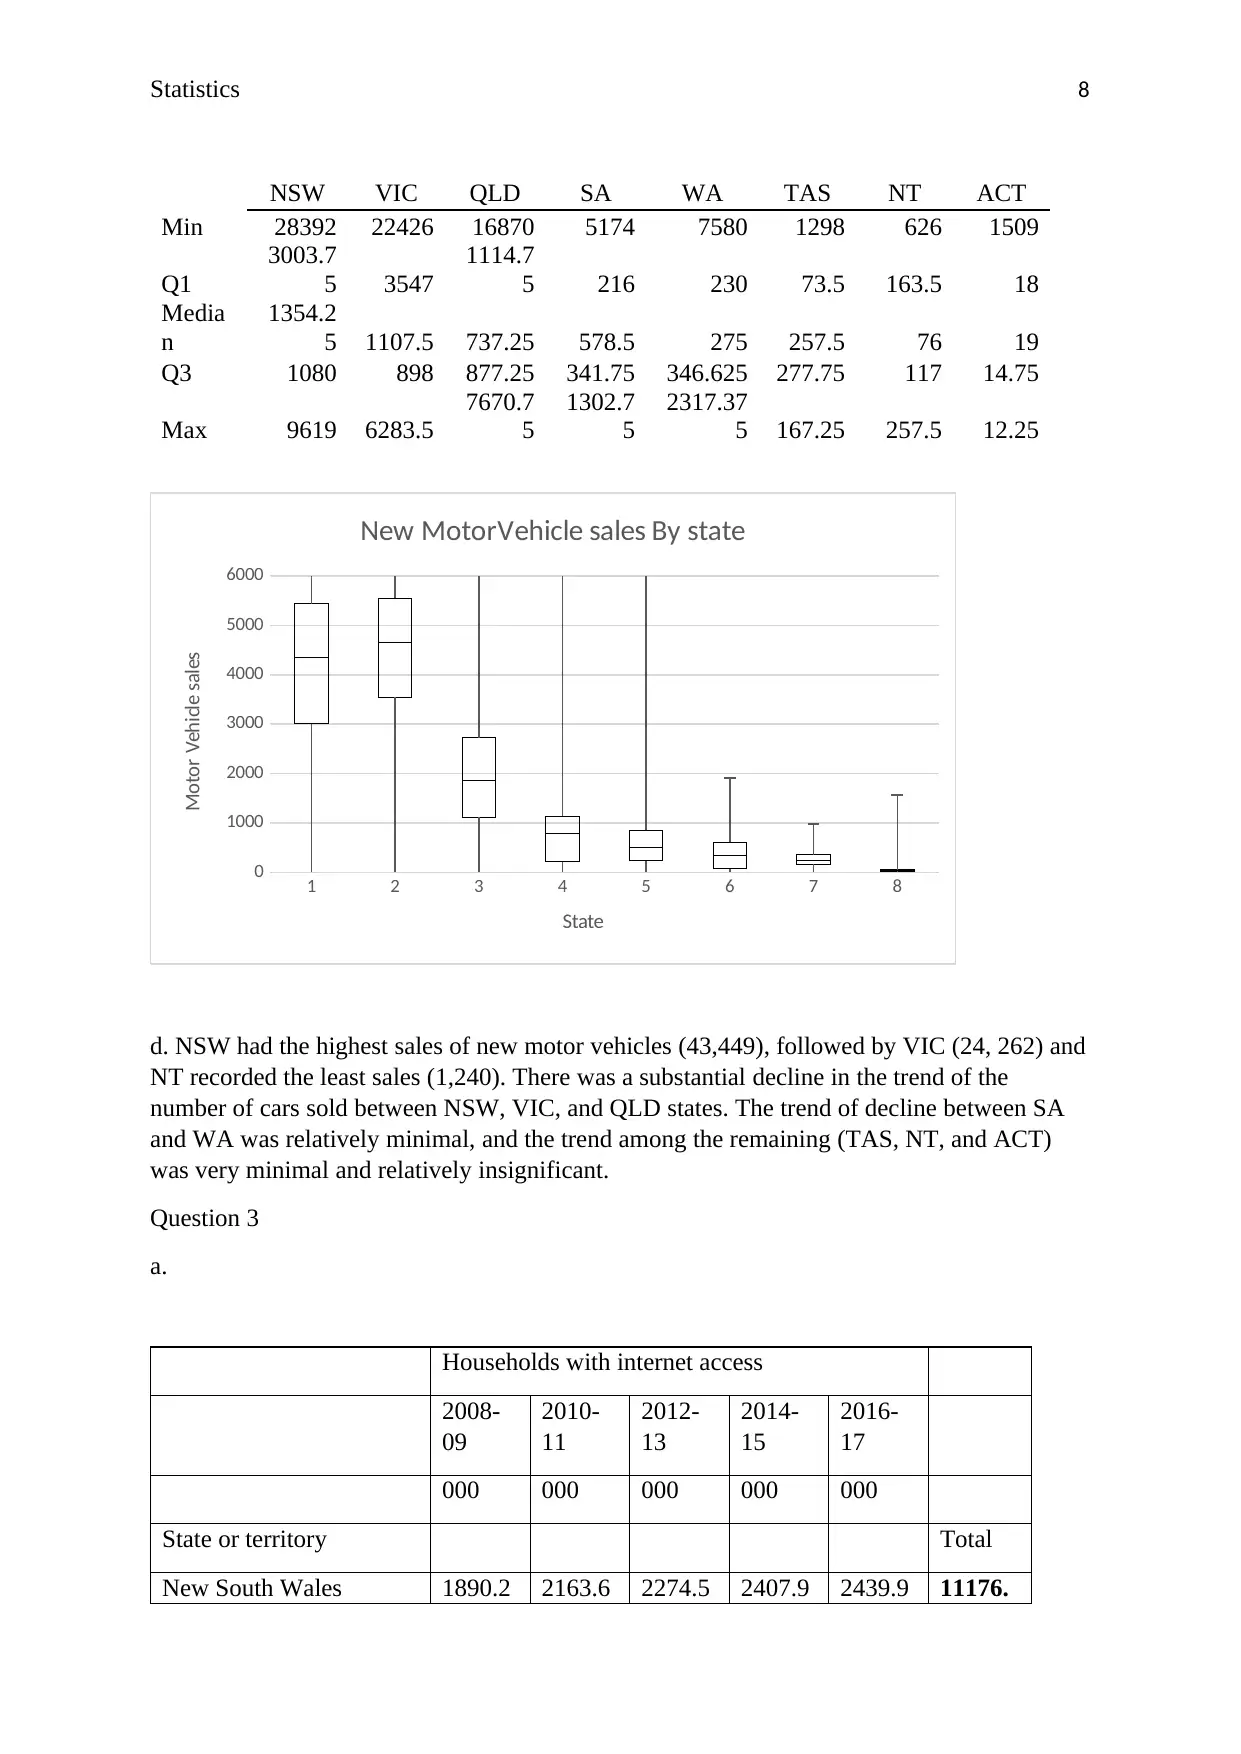
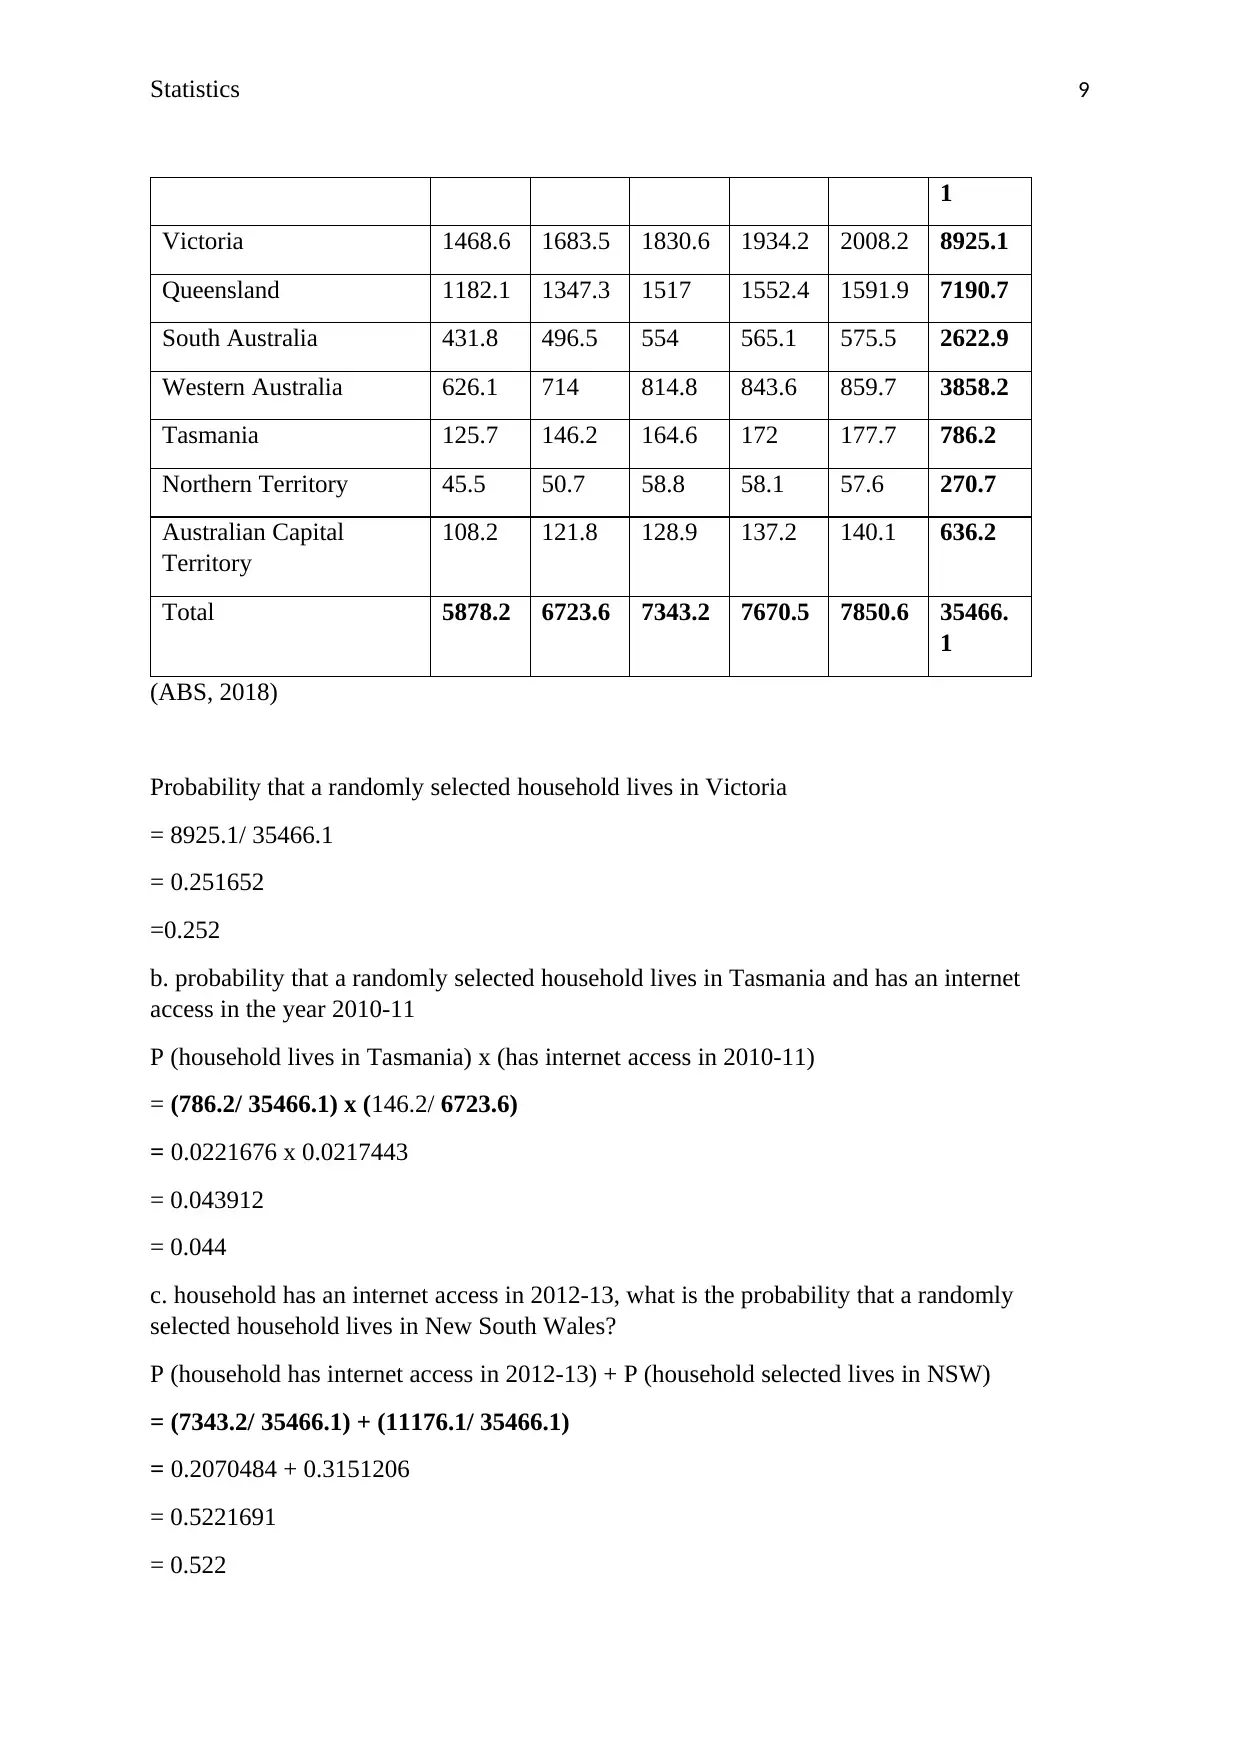
This statistics assignment solution includes detailed answers to questions covering a range of statistical concepts. The assignment begins with an analysis of stock prices for WBC and NAB, including calculations of frequency, relative frequency, and graphical representations of market capitalization. It then moves on to analyze new motor vehicle sales data by state, calculating descriptive statistics such as mean, standard deviation, minimum, maximum, and quartiles. The assignment further explores probability concepts, including calculating the probability of household internet access across different states and years. Finally, it addresses problems involving normal and uniform distributions, as well as hypothesis testing, providing step-by-step calculations and interpretations. The solution also uses Excel to assist in statistical calculations.

1 out of 15
Related Documents


Your All-in-One AI-Powered Toolkit for Academic Success.
+13062052269
info@desklib.com
Available 24*7 on WhatsApp / Email
![[object Object]](/_next/static/media/star-bottom.7253800d.svg)
Copyright © 2020–2026 A2Z Services. All Rights Reserved. Developed and managed by ZUCOL.