Statistics and Data Analysis: Weekly Rent in Australian Suburbs Report

Verified

Added on  2020/03/04

|6
|2113
|50
Report
AI Summary
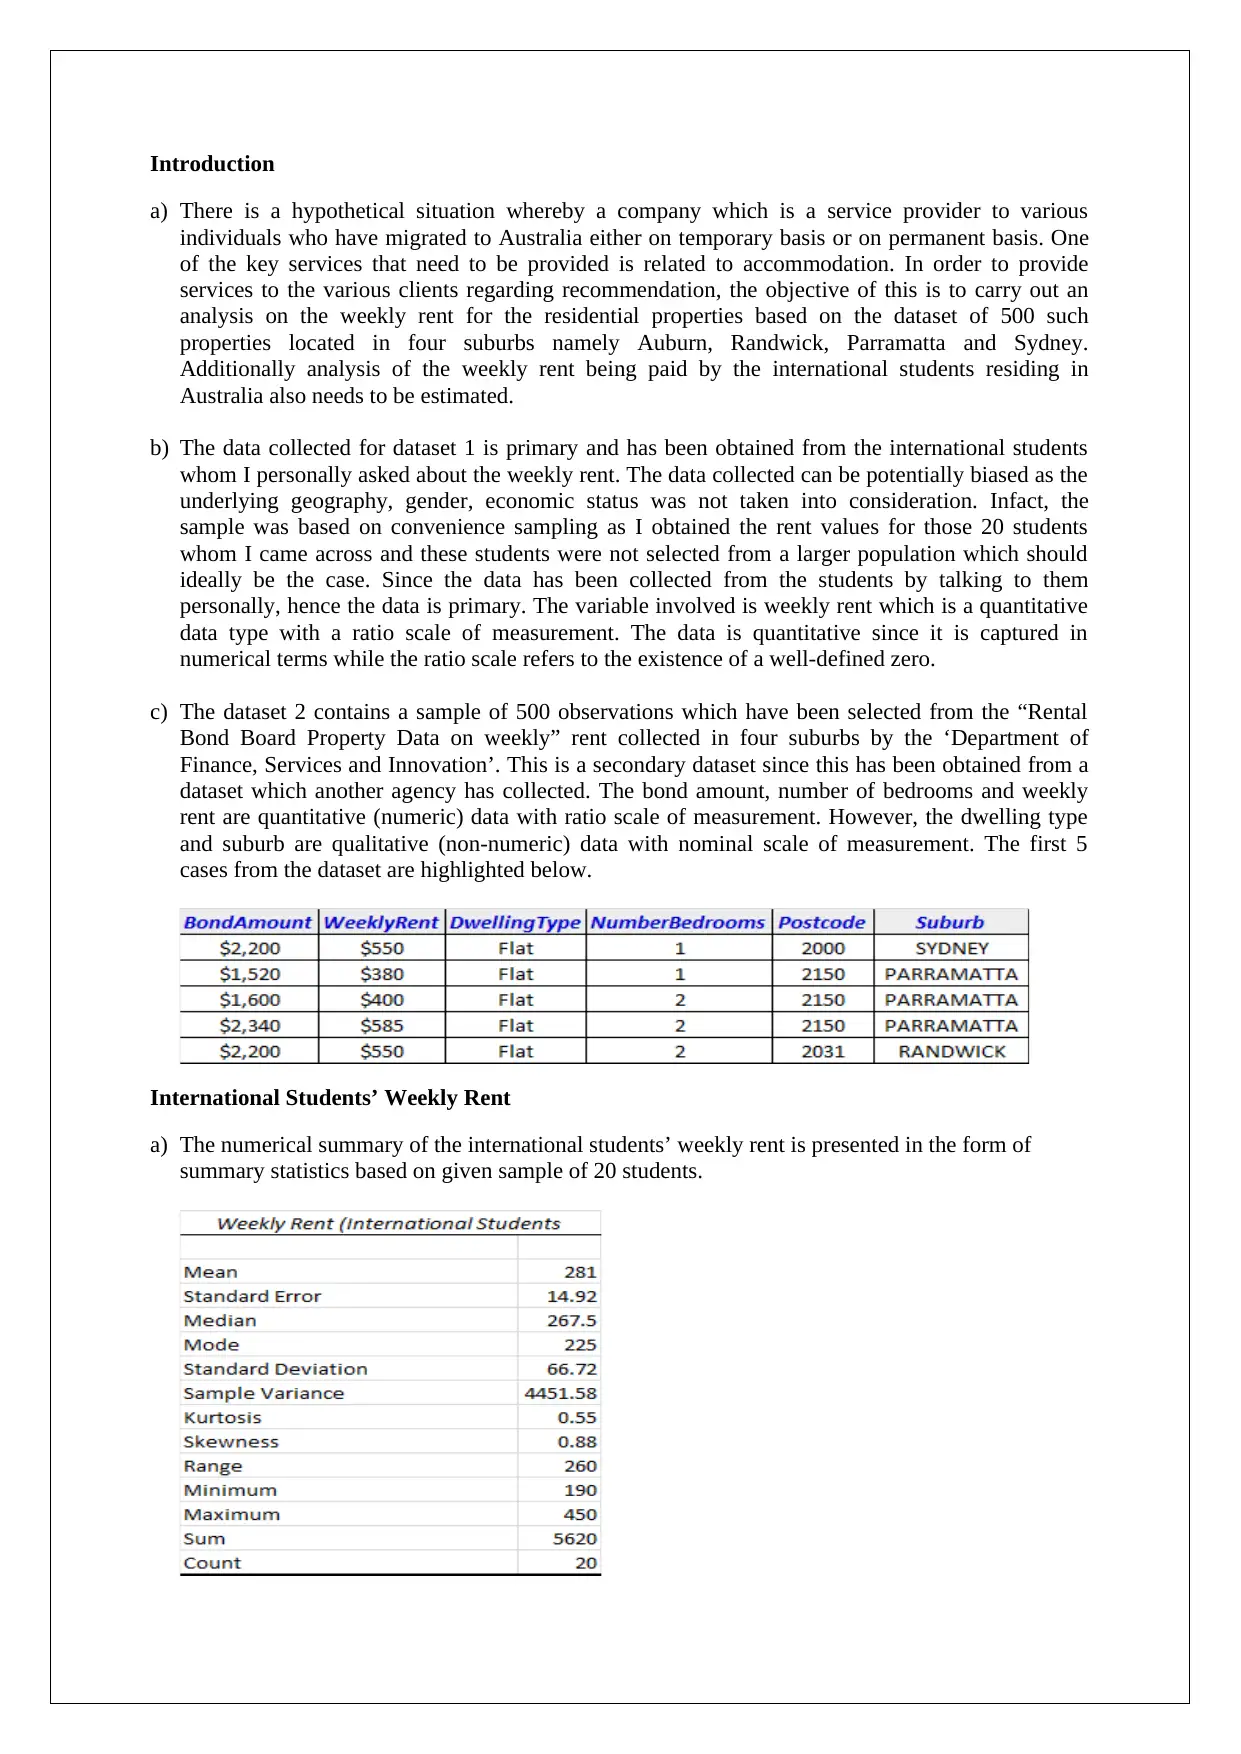
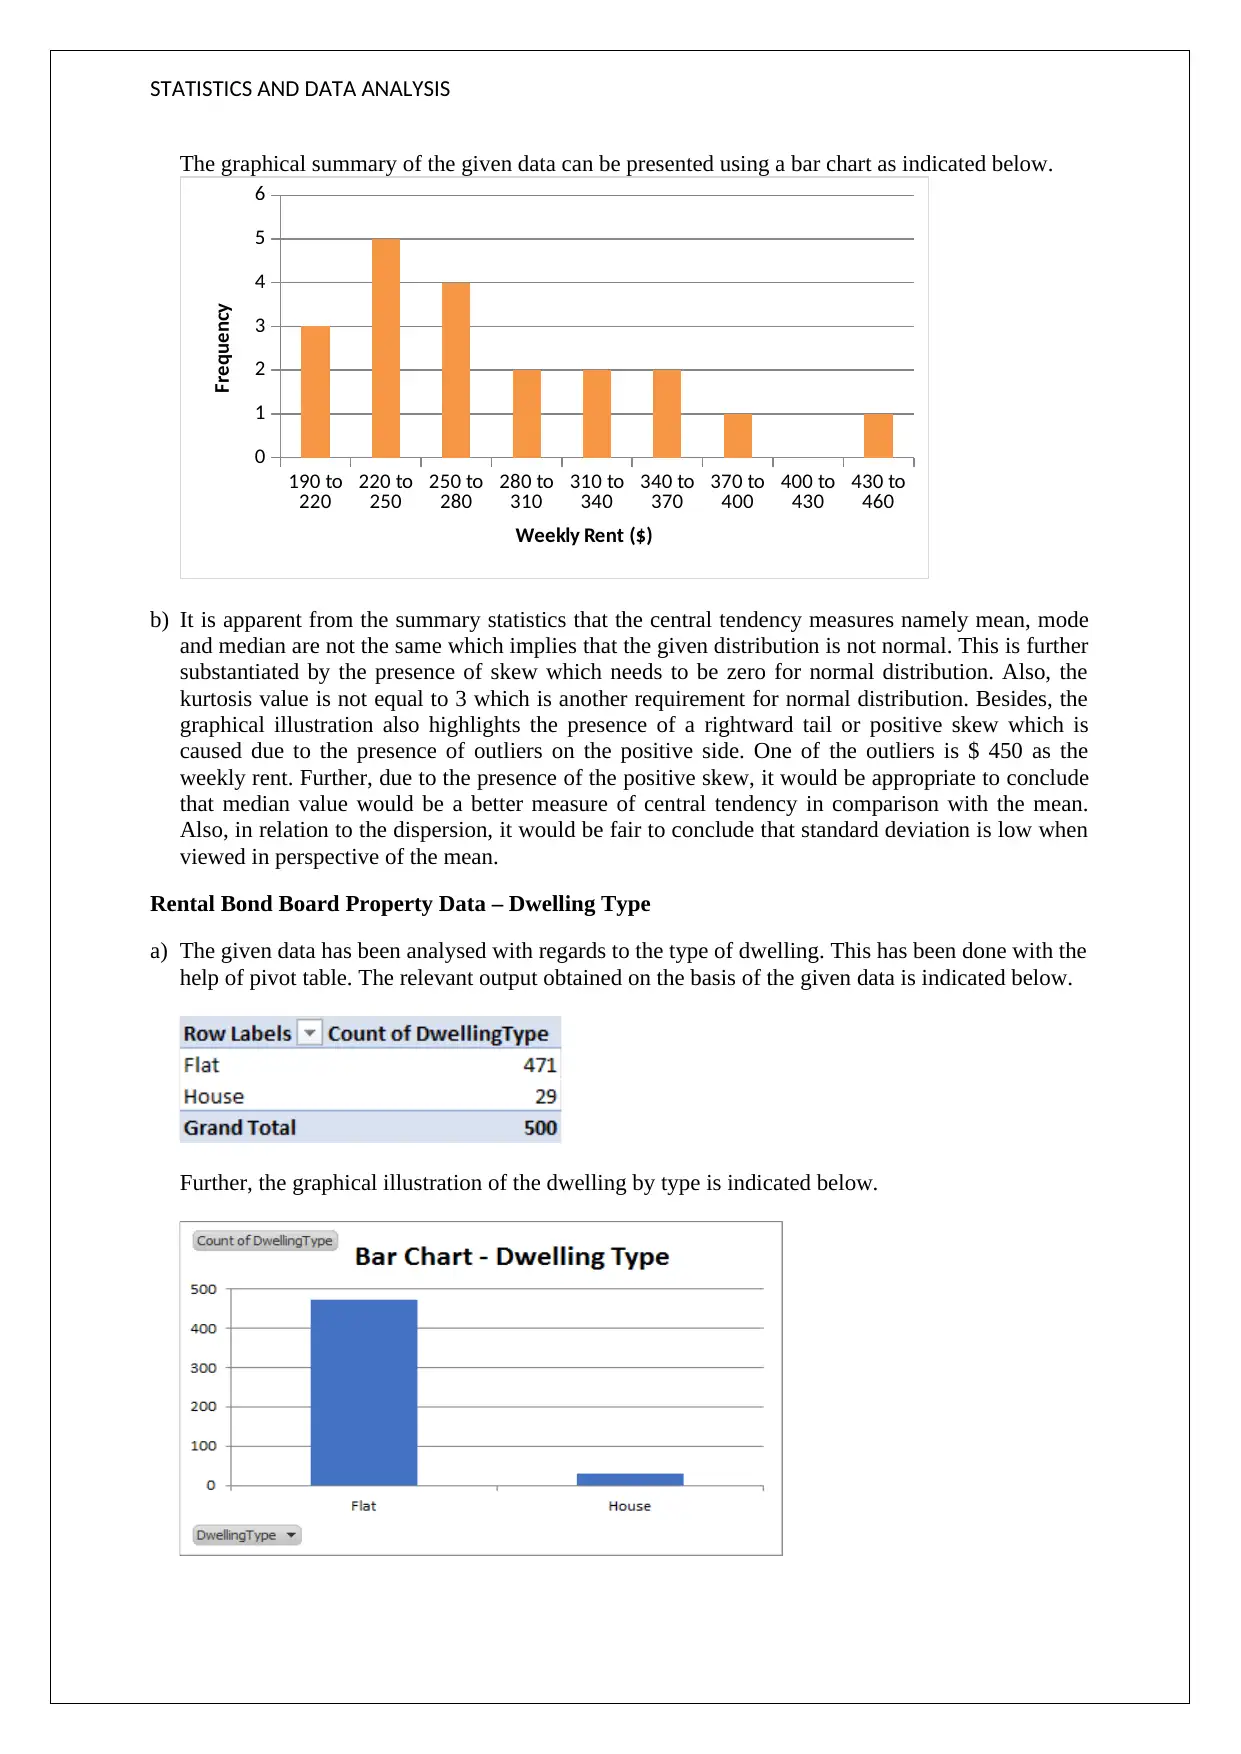
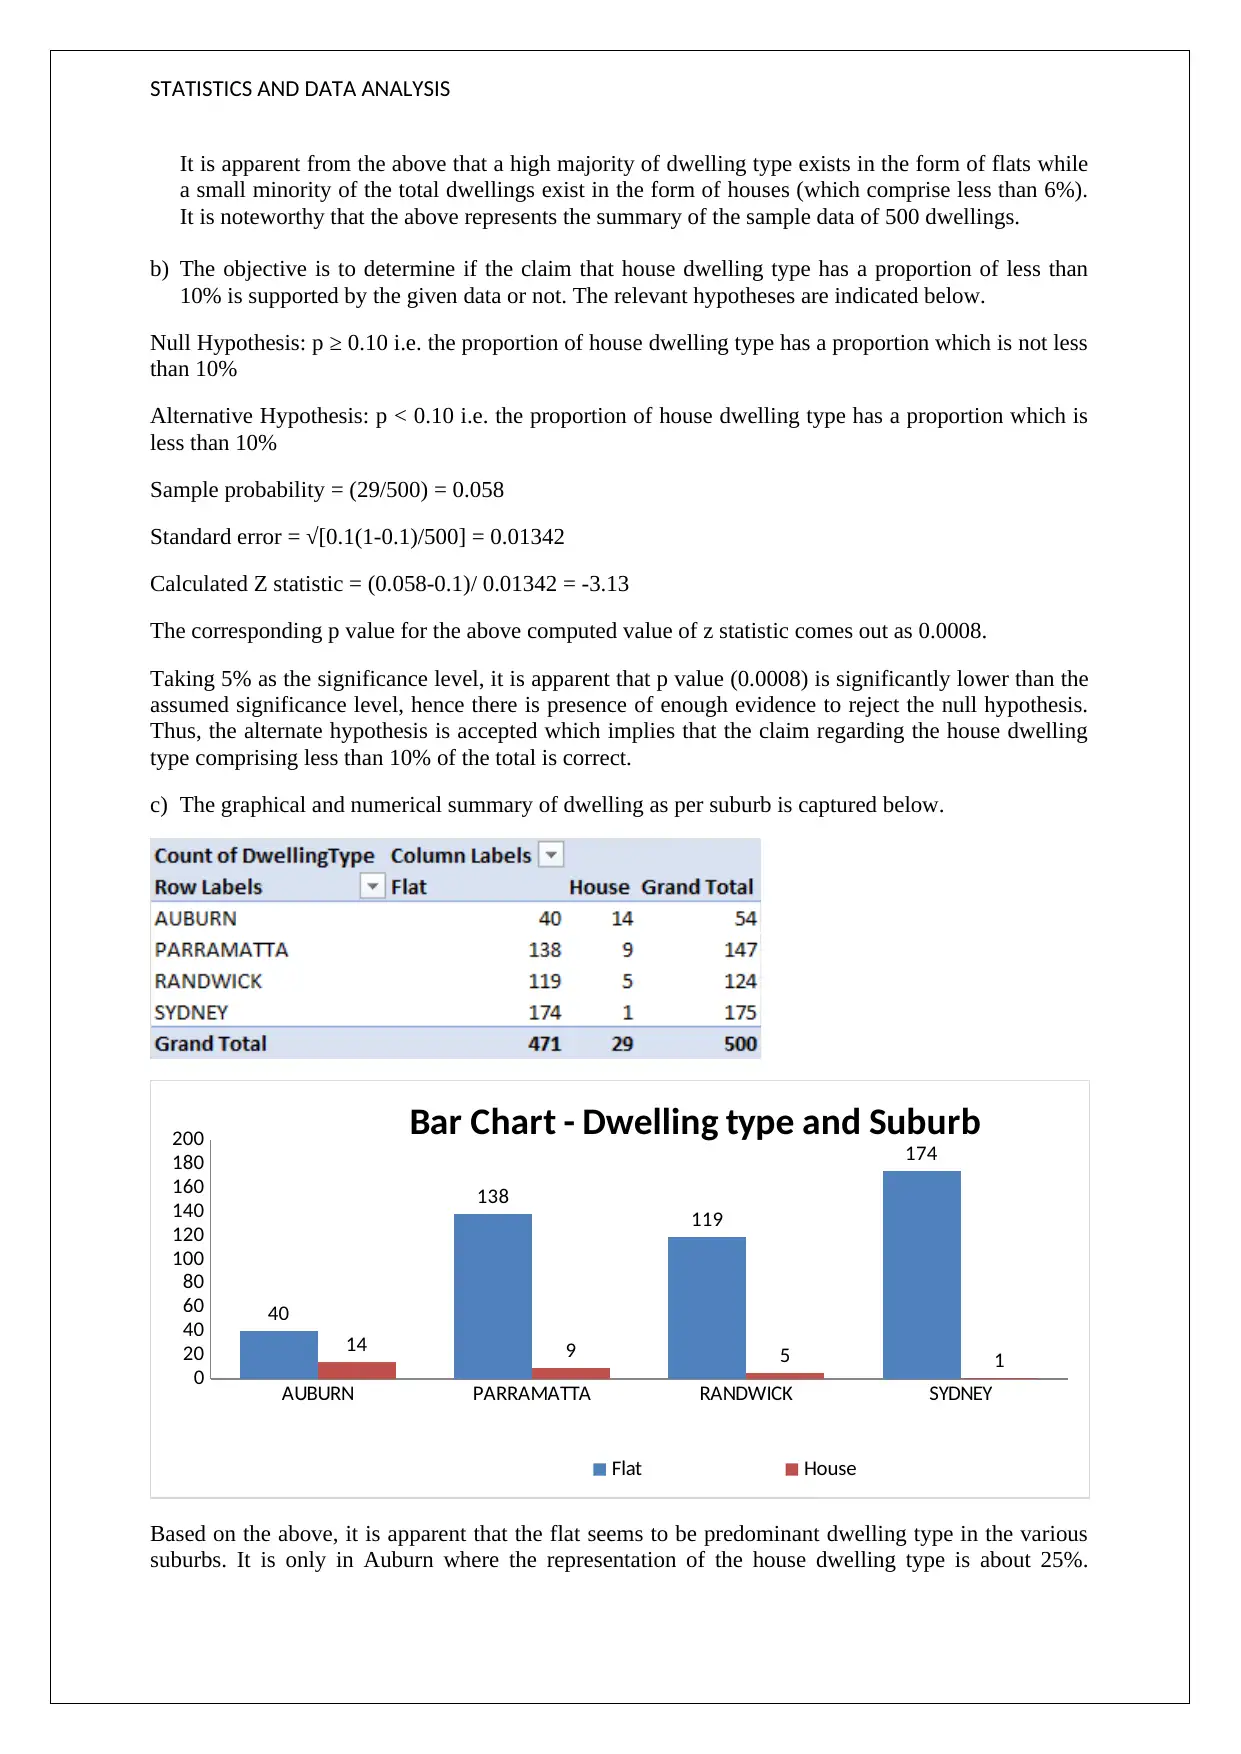
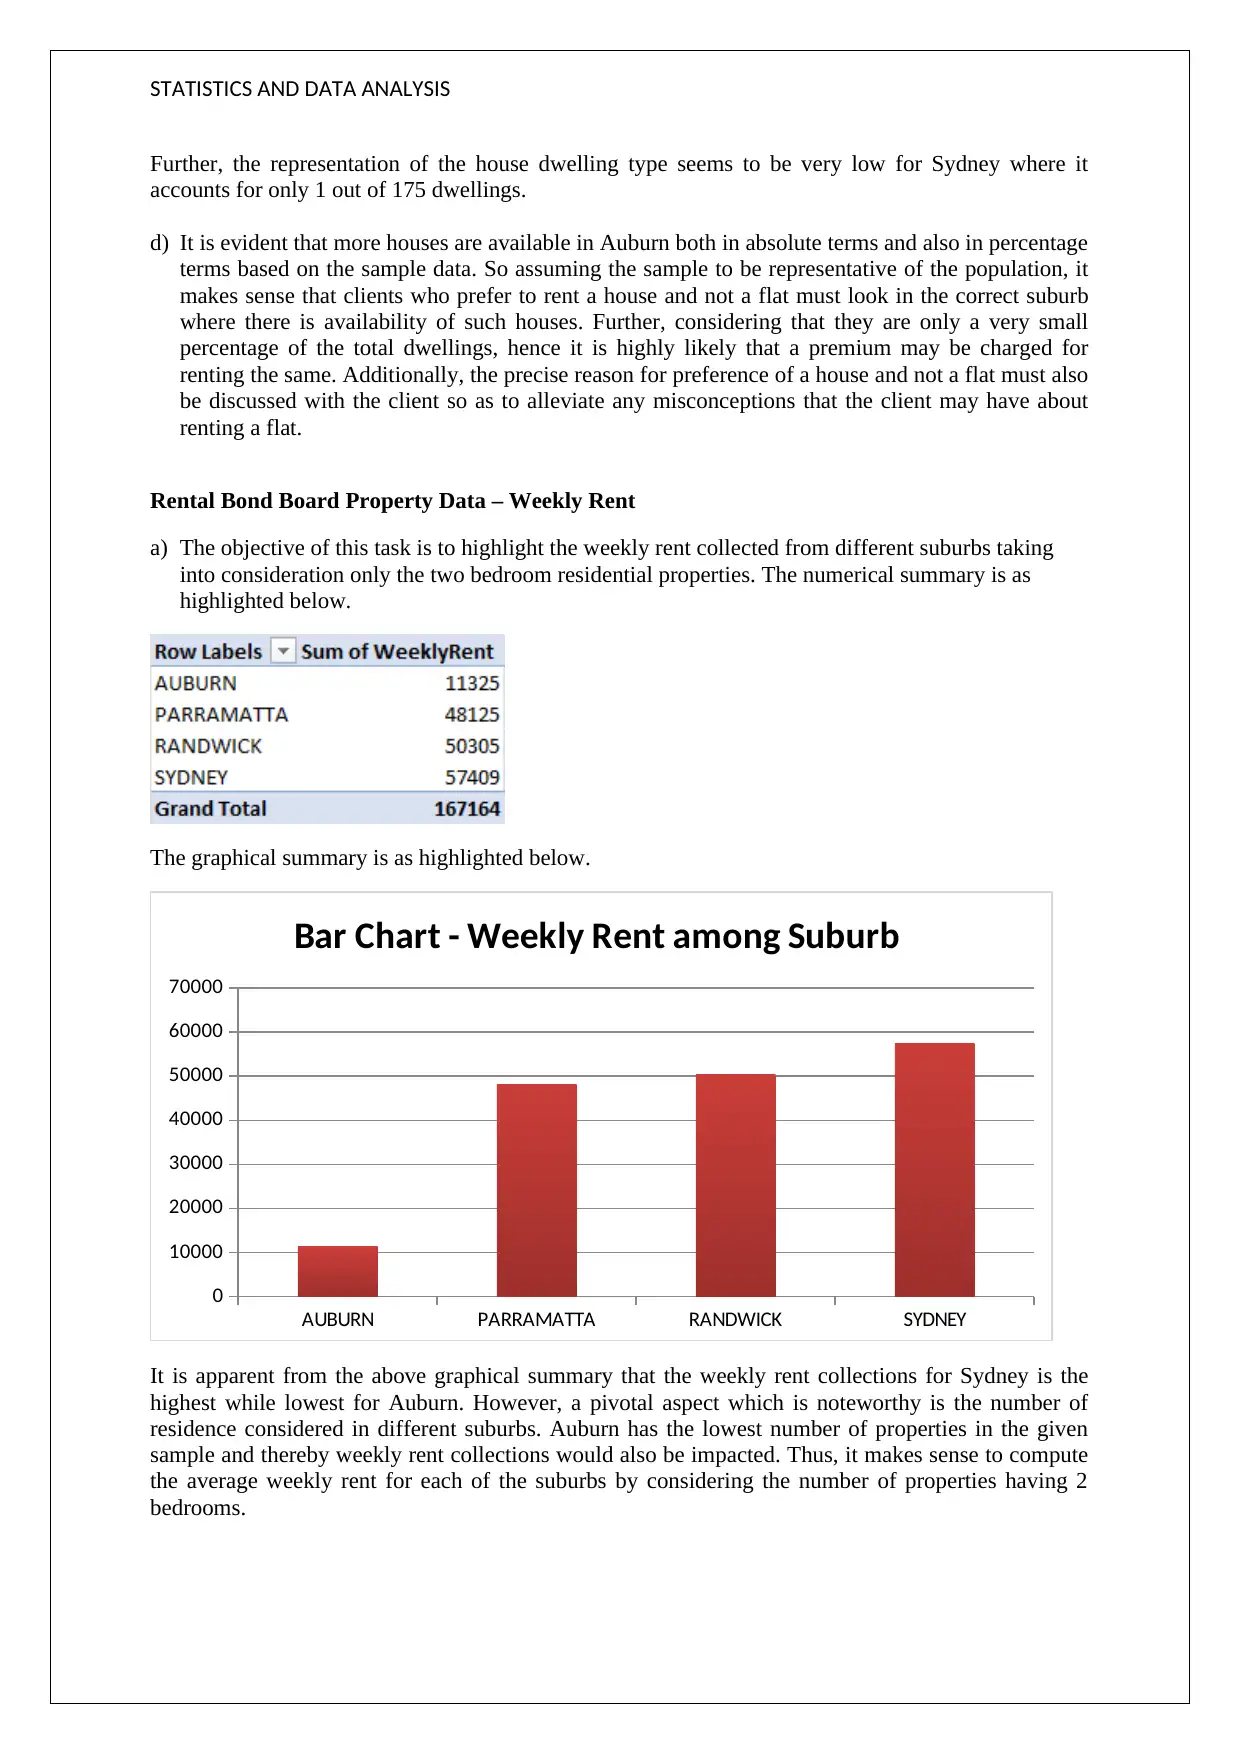
This report presents a statistical analysis of weekly rent for residential properties in Australia, focusing on data from four suburbs: Auburn, Randwick, Parramatta, and Sydney. The analysis includes two datasets: one from international students and another from the Rental Bond Board. The study examines the distribution of weekly rent, dwelling types (flats vs. houses), and the relationship between weekly rent and bond amounts. Statistical methods such as descriptive statistics, hypothesis testing (z-test and ANOVA), and correlation analysis are employed to draw conclusions. Key findings include the non-normal distribution of international student rent data, the predominance of flats over houses, variations in average weekly rent across suburbs for two-bedroom properties, and a strong linear relationship between weekly rent and bond amounts. The report concludes with recommendations for future research, suggesting further analysis of properties with different bedroom counts and comparing trends between houses and flats.
Document Page
Introduction
a) There is a hypothetical situation whereby a company which is a service provider to various
individuals who have migrated to Australia either on temporary basis or on permanent basis. One
of the key services that need to be provided is related to accommodation. In order to provide
services to the various clients regarding recommendation, the objective of this is to carry out an
analysis on the weekly rent for the residential properties based on the dataset of 500 such
properties located in four suburbs namely Auburn, Randwick, Parramatta and Sydney.
Additionally analysis of the weekly rent being paid by the international students residing in
Australia also needs to be estimated.
b) The data collected for dataset 1 is primary and has been obtained from the international students
whom I personally asked about the weekly rent. The data collected can be potentially biased as the
underlying geography, gender, economic status was not taken into consideration. Infact, the
sample was based on convenience sampling as I obtained the rent values for those 20 students
whom I came across and these students were not selected from a larger population which should
ideally be the case. Since the data has been collected from the students by talking to them
personally, hence the data is primary. The variable involved is weekly rent which is a quantitative
data type with a ratio scale of measurement. The data is quantitative since it is captured in
numerical terms while the ratio scale refers to the existence of a well-defined zero.
c) The dataset 2 contains a sample of 500 observations which have been selected from the “Rental
Bond Board Property Data on weekly” rent collected in four suburbs by the ‘Department of
Finance, Services and Innovation’. This is a secondary dataset since this has been obtained from a
dataset which another agency has collected. The bond amount, number of bedrooms and weekly
rent are quantitative (numeric) data with ratio scale of measurement. However, the dwelling type
and suburb are qualitative (non-numeric) data with nominal scale of measurement. The first 5
cases from the dataset are highlighted below.
International Students’ Weekly Rent
a) The numerical summary of the international students’ weekly rent is presented in the form of
summary statistics based on given sample of 20 students.
tabler-icon-diamond-filled.svg

Paraphrase This Document

Need a fresh take? Get an instant paraphrase of this document with our AI Paraphraser
Document Page
STATISTICS AND DATA ANALYSIS
The graphical summary of the given data can be presented using a bar chart as indicated below.
190 to
220 220 to
250 250 to
280 280 to
310 310 to
340 340 to
370 370 to
400 400 to
430 430 to
460
0
1
2
3
4
5
6
Weekly Rent ($)
Frequency
b) It is apparent from the summary statistics that the central tendency measures namely mean, mode
and median are not the same which implies that the given distribution is not normal. This is further
substantiated by the presence of skew which needs to be zero for normal distribution. Also, the
kurtosis value is not equal to 3 which is another requirement for normal distribution. Besides, the
graphical illustration also highlights the presence of a rightward tail or positive skew which is
caused due to the presence of outliers on the positive side. One of the outliers is $ 450 as the
weekly rent. Further, due to the presence of the positive skew, it would be appropriate to conclude
that median value would be a better measure of central tendency in comparison with the mean.
Also, in relation to the dispersion, it would be fair to conclude that standard deviation is low when
viewed in perspective of the mean.
Rental Bond Board Property Data – Dwelling Type
a) The given data has been analysed with regards to the type of dwelling. This has been done with the
help of pivot table. The relevant output obtained on the basis of the given data is indicated below.
Further, the graphical illustration of the dwelling by type is indicated below.
Document Page
STATISTICS AND DATA ANALYSIS
It is apparent from the above that a high majority of dwelling type exists in the form of flats while
a small minority of the total dwellings exist in the form of houses (which comprise less than 6%).
It is noteworthy that the above represents the summary of the sample data of 500 dwellings.
b) The objective is to determine if the claim that house dwelling type has a proportion of less than
10% is supported by the given data or not. The relevant hypotheses are indicated below.
Null Hypothesis: p ≥ 0.10 i.e. the proportion of house dwelling type has a proportion which is not less
than 10%
Alternative Hypothesis: p < 0.10 i.e. the proportion of house dwelling type has a proportion which is
less than 10%
Sample probability = (29/500) = 0.058
Standard error = √[0.1(1-0.1)/500] = 0.01342
Calculated Z statistic = (0.058-0.1)/ 0.01342 = -3.13
The corresponding p value for the above computed value of z statistic comes out as 0.0008.
Taking 5% as the significance level, it is apparent that p value (0.0008) is significantly lower than the
assumed significance level, hence there is presence of enough evidence to reject the null hypothesis.
Thus, the alternate hypothesis is accepted which implies that the claim regarding the house dwelling
type comprising less than 10% of the total is correct.
c) The graphical and numerical summary of dwelling as per suburb is captured below.
AUBURN PARRAMATTA RANDWICK SYDNEY
0
20
40
60
80
100
120
140
160
180
200
40
138
119
174
14 9 5 1
Bar Chart - Dwelling type and Suburb
Flat House
Based on the above, it is apparent that the flat seems to be predominant dwelling type in the various
suburbs. It is only in Auburn where the representation of the house dwelling type is about 25%.
Document Page
STATISTICS AND DATA ANALYSIS
Further, the representation of the house dwelling type seems to be very low for Sydney where it
accounts for only 1 out of 175 dwellings.
d) It is evident that more houses are available in Auburn both in absolute terms and also in percentage
terms based on the sample data. So assuming the sample to be representative of the population, it
makes sense that clients who prefer to rent a house and not a flat must look in the correct suburb
where there is availability of such houses. Further, considering that they are only a very small
percentage of the total dwellings, hence it is highly likely that a premium may be charged for
renting the same. Additionally, the precise reason for preference of a house and not a flat must also
be discussed with the client so as to alleviate any misconceptions that the client may have about
renting a flat.
Rental Bond Board Property Data – Weekly Rent
a) The objective of this task is to highlight the weekly rent collected from different suburbs taking
into consideration only the two bedroom residential properties. The numerical summary is as
highlighted below.
The graphical summary is as highlighted below.
AUBURN PARRAMATTA RANDWICK SYDNEY
0
10000
20000
30000
40000
50000
60000
70000
Bar Chart - Weekly Rent among Suburb
It is apparent from the above graphical summary that the weekly rent collections for Sydney is the
highest while lowest for Auburn. However, a pivotal aspect which is noteworthy is the number of
residence considered in different suburbs. Auburn has the lowest number of properties in the given
sample and thereby weekly rent collections would also be impacted. Thus, it makes sense to compute
the average weekly rent for each of the suburbs by considering the number of properties having 2
bedrooms.
tabler-icon-diamond-filled.svg

Paraphrase This Document

Need a fresh take? Get an instant paraphrase of this document with our AI Paraphraser
Document Page
STATISTICS AND DATA ANALYSIS
b) Since there are more than two suburbs whose average rent need to be compared, hence a T test
would not be suitable and instead an ANOVA test would be performed to compare the average
weekly rents for the various suburbs. The relevant hypotheses are as highlighted below.
Null Hypothesis or H0: The mean prices of residential properties in various suburbs are the same.
Alternative Hypothesis or H1: The mean prices of residential properties in atleast one suburb are
different from the corresponding price in other suburbs.
The one factor ANOVA output obtained from Excel is indicated below.
It is apparent from the above Excel output that the relevant F statistic comes out as 218.0698 while the
corresponding p value comes out to be zero.
Assuming a significance level of 5%, it is apparent that the p value computed is lower than the
significance level and hence the null hypothesis would be rejected while the alternative hypothesis
would be accepted. This leads to the logical conclusion that there is a statistically significant
difference between the average rent of the residential properties in the different suburbs.
c) It is apparent that for two bedroom residential properties, the weekly rent would tend to differ in
various suburbs and thus, the client must narrow down on the locality based on the underlying
budget. The average weekly rent for the two bedroom residential based on the data available from
the sample.
Average weekly rent for 2 bedroom residential (Auburn) = 11325/28 = $ 404.46
Average weekly rent for 2 bedroom residential (Parramatta) = 48125/103 = $ 467.23
Average weekly rent for 2 bedroom residential (Randwick) = 50305/82 = $ 613.48
Average weekly rent for 2 bedroom residential (Sydney) = 57409/70 = $820.12
Based on the above computations, it is apparent that the rent for a 2 bedroom residential is
maximum in Sydney and minimum in case of Auburn. Thus, this needs to be kept in mind when
searching and finalising a house to take on rent.
Bond Amount
Document Page
STATISTICS AND DATA ANALYSIS
a) In order to examine the relationship between weekly rent and bond amount, the suitable graphical
display is as highlighted below.
$100
$200
$300
$400
$500
$600
$700
$800
$900
$1,000
$1,100
$0
$500
$1,000
$1,500
$2,000
$2,500
$3,000
$3,500
$4,000
$4,500
Scatter Plot
Weekly Rent (AUD)
Bond Amount (AUD)
It is apparent from the scatter plot highlighted above that there seems to be very strong linear
relationship between the given variables considering the linear pattern that is formed even though
there are certain values which are tend to deviating from the linear trend. However, this is on expected
lines considering the bond amount is typically expressed as four times the weekly rent and this
practice is widely followed.
b) The correlation coefficient for the two variables highlighted above has come out to be 0.989. This
implies that the correlation between the bond amount and weekly rent is very strong which has
already been explained above. Although there are some outliers present which are apparent from
the scatter plot but they are quite few. Based on this, it would be correct to assume that the clients
must make sure that the bond amount should not exceed one month rent or four weeks rent as this
seems to be the accepted protocol and then same is being adhered to by a vast majority of rent
transactions.
Conclusion
a) Based on the above discussion, it would be fair to conclude that the sample data collected for
international students’ weekly rent has a positive skew and does not follow a normal distribution.
Besides, the variation tends to be low only but there is presence of outlier which makes median a
suitable measure of central tendency. Further with regards to the sample data regards dwelling in
four suburbs, it is apparent that flats tend to be the predominant type of dwelling with very few
houses available. The availability of houses varies from suburb to suburb which needs to be kept in
mind by the client. Besides, using the sample data available and inferential data analysis, it is also
apparent the average rent for two bedroom residential properties is not the same across the four
suburbs. Additionally, a strong linear relationship is noticeable between the weekly rent and the
bond amount which is on account of usually the bond amount being equal to four weeks or one
month rent.
b) For future research, it is advisable that properties with various bedrooms may be analysed in
different suburbs to understand whether there is any difference in the price trends of the various
suburbs. This is critical in order to understand whether certain suburbs are in general expensive or
there is some complex mechanism in play. Similar exercise needs to be done for houses also and
this needs to be compared with flats of various bedrooms to analyse for the underlying similarities
and differences in the trend.
chevron_up_icon
1 out of 6
circle_padding
hide_on_mobile
zoom_out_icon
[object Object]