Exploring Data: Skewness, Kurtosis, Normality Tests, and Distributions

Verified

Added on  2023/06/09

|6
|571
|123
Homework Assignment
AI Summary
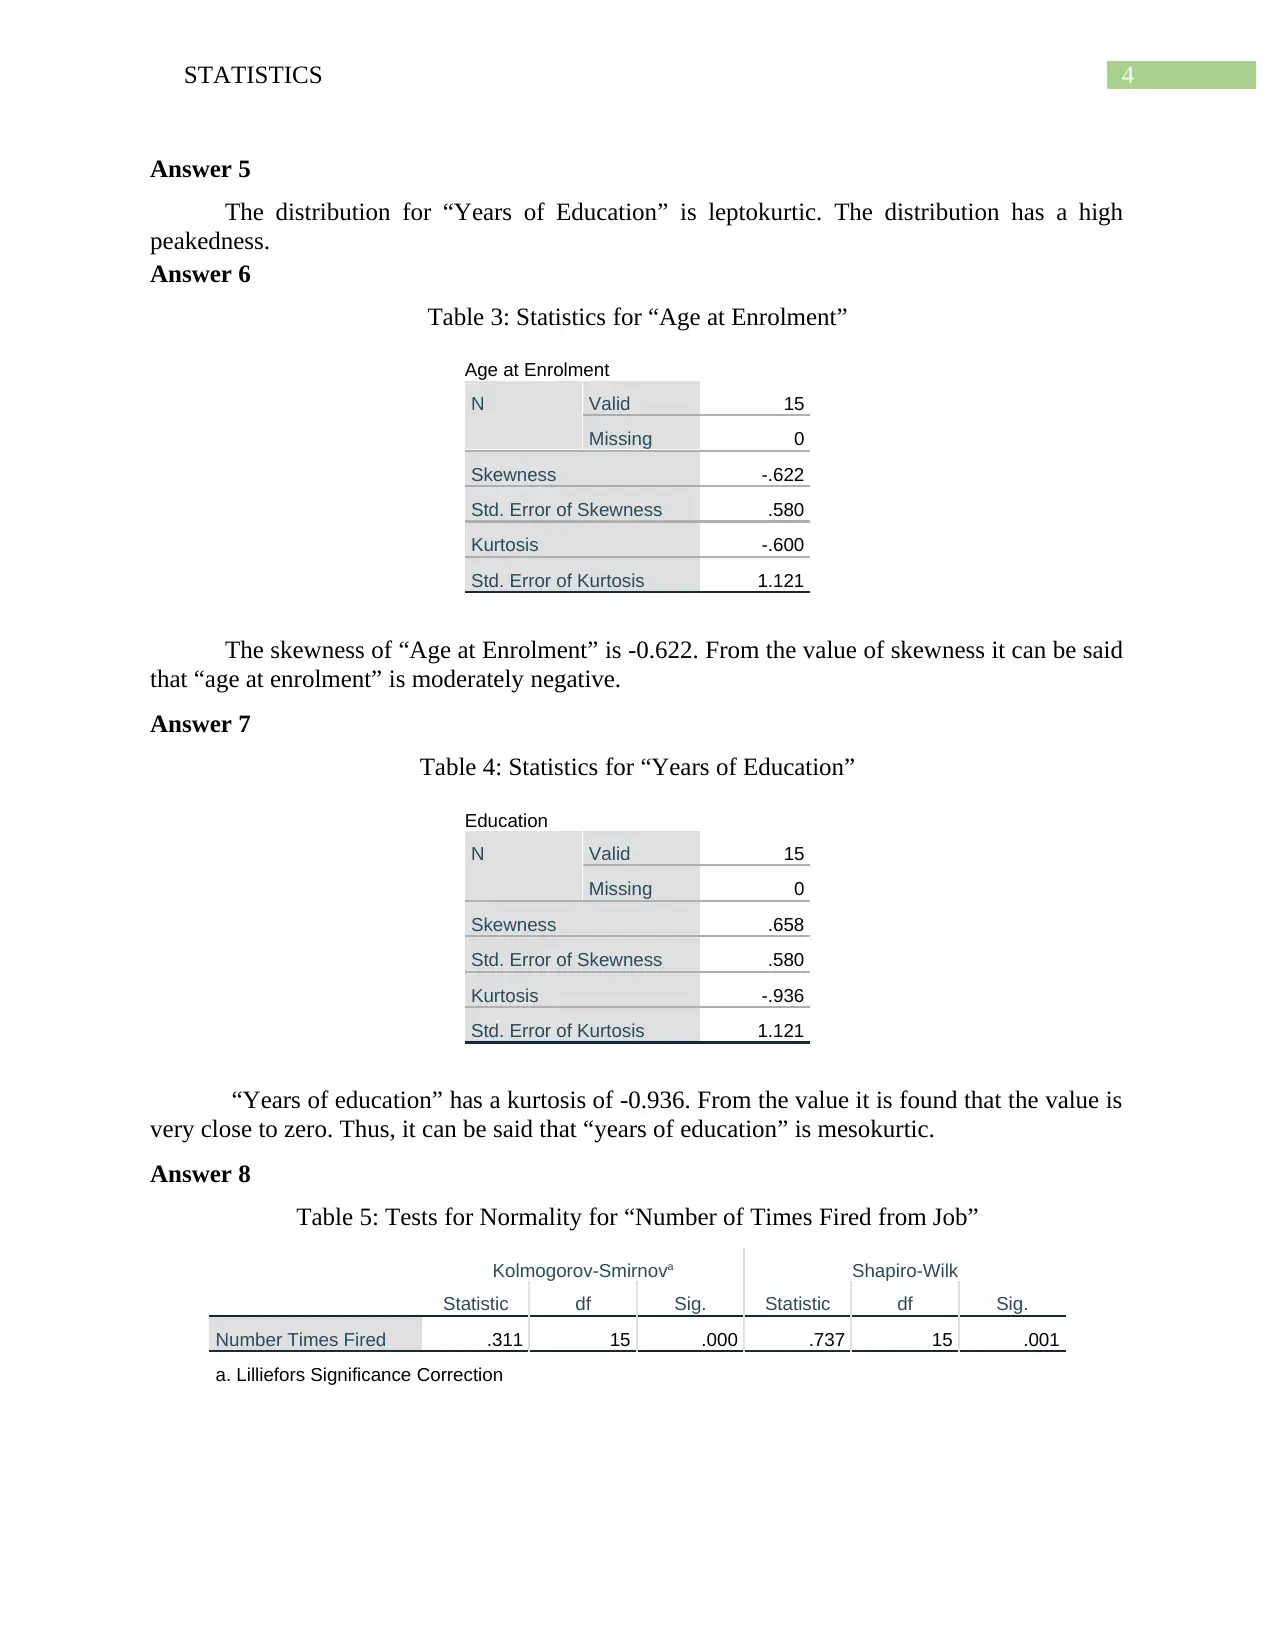
This statistics assignment delves into analyzing data distributions, skewness, kurtosis, and normality tests using a sample dataset. The analysis includes frequency distribution plots, histograms, and statistical tests like Shapiro-Wilk. The assignment interprets skewness values for 'Age at 1st Arrest' and 'Age at Enrolment,' kurtosis for 'Years of Education,' and determines whether 'Number of Times Fired from Job' follows a normal distribution. It also addresses the appropriateness of the Kolmogorov-Smirnov test for small sample sizes and discusses the relationship between skewness, kurtosis, and normality, highlighting how distributions can be leptokurtic or platykurtic despite low skewness values. This document is available on Desklib, a platform offering AI-based study tools and a wide range of solved assignments for students.
Document Page
Running Head: STATISTICS
Statistics
Name of the Student
Name of the University
Author Note
tabler-icon-diamond-filled.svg

Paraphrase This Document

Need a fresh take? Get an instant paraphrase of this document with our AI Paraphraser
Document Page
1STATISTICS
Answer 1
Figure 1: Frequency Distribution of Age
The plot of frequency distribution of Age is presented above.
Document Page
2STATISTICS
Answer 2
Figure 2: Histogram of Enrolment at Age
From the above lot it can be interpreted that the frequency of Enrolment at Age is
Negatively Skewed. The above inference is based on the fact that the tail of the distribution
appears to below the mean value.
Answer 3
Table 1: Skewness of Age at 1st Arrest
Statistics
Age at 1st Arrest
N Valid 15
Missing 0
Skewness .990
Std. Error of Skewness .580
Kurtosis .746
Std. Error of Kurtosis 1.121
Document Page
3STATISTICS
Table 2: Shapiro-Wilk test
Tests of Normality
Kolmogorov-Smirnova Shapiro-Wilk
Statistic df Sig. Statistic df Sig.
Age at 1st Arrest .138 15 .200* .923 15 .211
*. This is a lower bound of the true significance.
a. Lilliefors Significance Correction
The skewness for age at 1st arrest is positively skewed. From Shapiro-Wilk test it is found
that the distribution is normally distributed. The difference is due to the fact that Shapiro-Wilk
takes into account the entire shape of the distribution.
Answer 4
Figure 3: Frequency distribution of Education
Figure 3 presents the frequency distribution of Education.
tabler-icon-diamond-filled.svg

Paraphrase This Document

Need a fresh take? Get an instant paraphrase of this document with our AI Paraphraser
Document Page
4STATISTICS
Answer 5
The distribution for “Years of Education” is leptokurtic. The distribution has a high
peakedness.
Answer 6
Table 3: Statistics for “Age at Enrolment”
Age at Enrolment
N Valid 15
Missing 0
Skewness -.622
Std. Error of Skewness .580
Kurtosis -.600
Std. Error of Kurtosis 1.121
The skewness of “Age at Enrolment” is -0.622. From the value of skewness it can be said
that “age at enrolment” is moderately negative.
Answer 7
Table 4: Statistics for “Years of Education”
Education
N Valid 15
Missing 0
Skewness .658
Std. Error of Skewness .580
Kurtosis -.936
Std. Error of Kurtosis 1.121
“Years of education” has a kurtosis of -0.936. From the value it is found that the value is
very close to zero. Thus, it can be said that “years of education” is mesokurtic.
Answer 8
Table 5: Tests for Normality for “Number of Times Fired from Job”
Kolmogorov-Smirnova Shapiro-Wilk
Statistic df Sig. Statistic df Sig.
Number Times Fired .311 15 .000 .737 15 .001
a. Lilliefors Significance Correction
Document Page
5STATISTICS
Shapiro-Wilk test for “Number of Times Fired from Job” has sig = 0.001. Since sig
<0.05, hence it can be concluded that the distribution for “Number of Times Fired from Job” is
not normally distributed.
Answer 9
The example data set has n = 15. For Kolmogorov-Smirnov statistic the sample size
required is n>2000. Thus, the Kolmogorov-Smirnov statistic is inappropriate for the present data
set.
Answer 10
A normally distributed data would have both low values of skewness and kurtosis. In the
present circumstances the Shapiro-Wilk test is p < 0.05, i.e., not-normal and having low
skewness value can be attributed to the fact that the distribution may be either of leptokurtic or
platykurtic.
chevron_up_icon
1 out of 6
circle_padding
hide_on_mobile
zoom_out_icon