Statistics Homework: Unit Test, Part 2 - Data Analysis and Plots

Verified

Added on  2022/10/18

|5
|494
|42
Homework Assignment
AI Summary
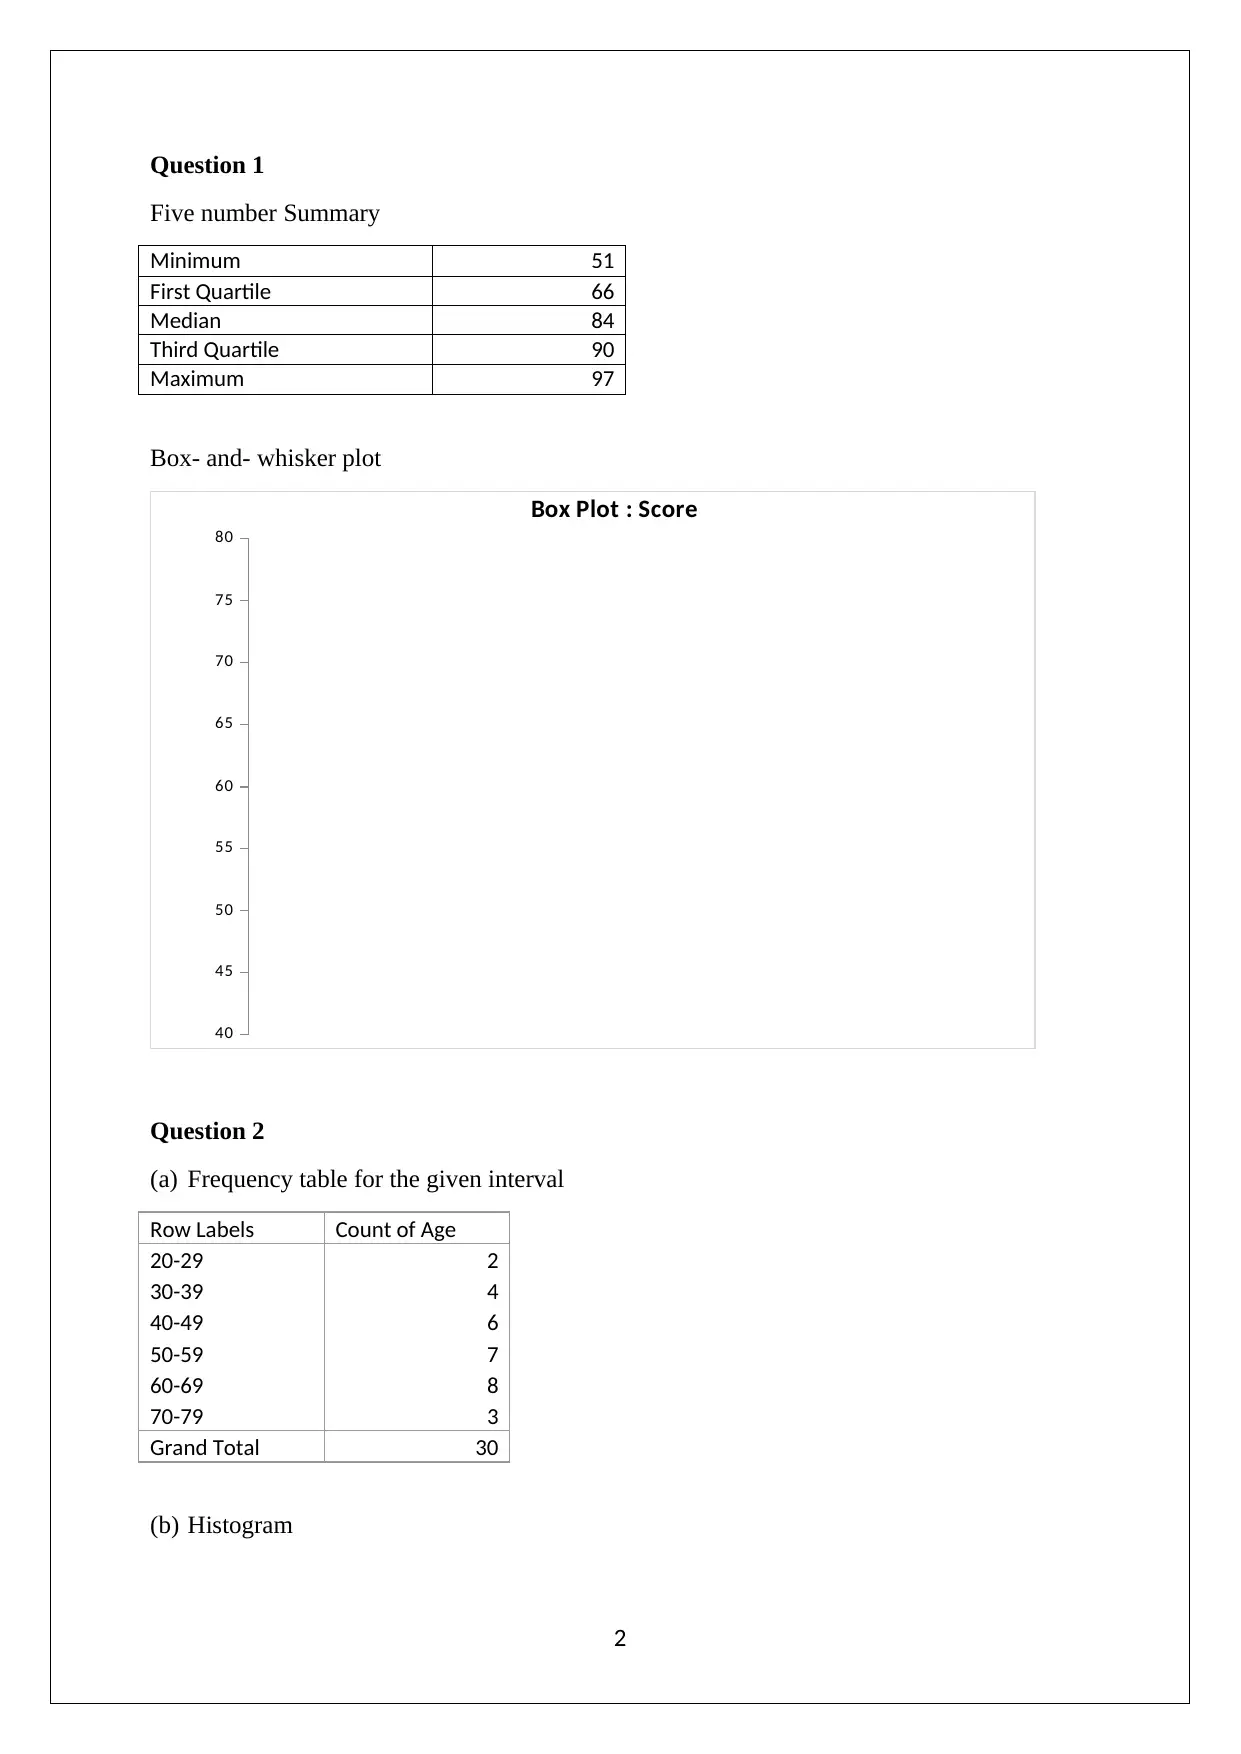
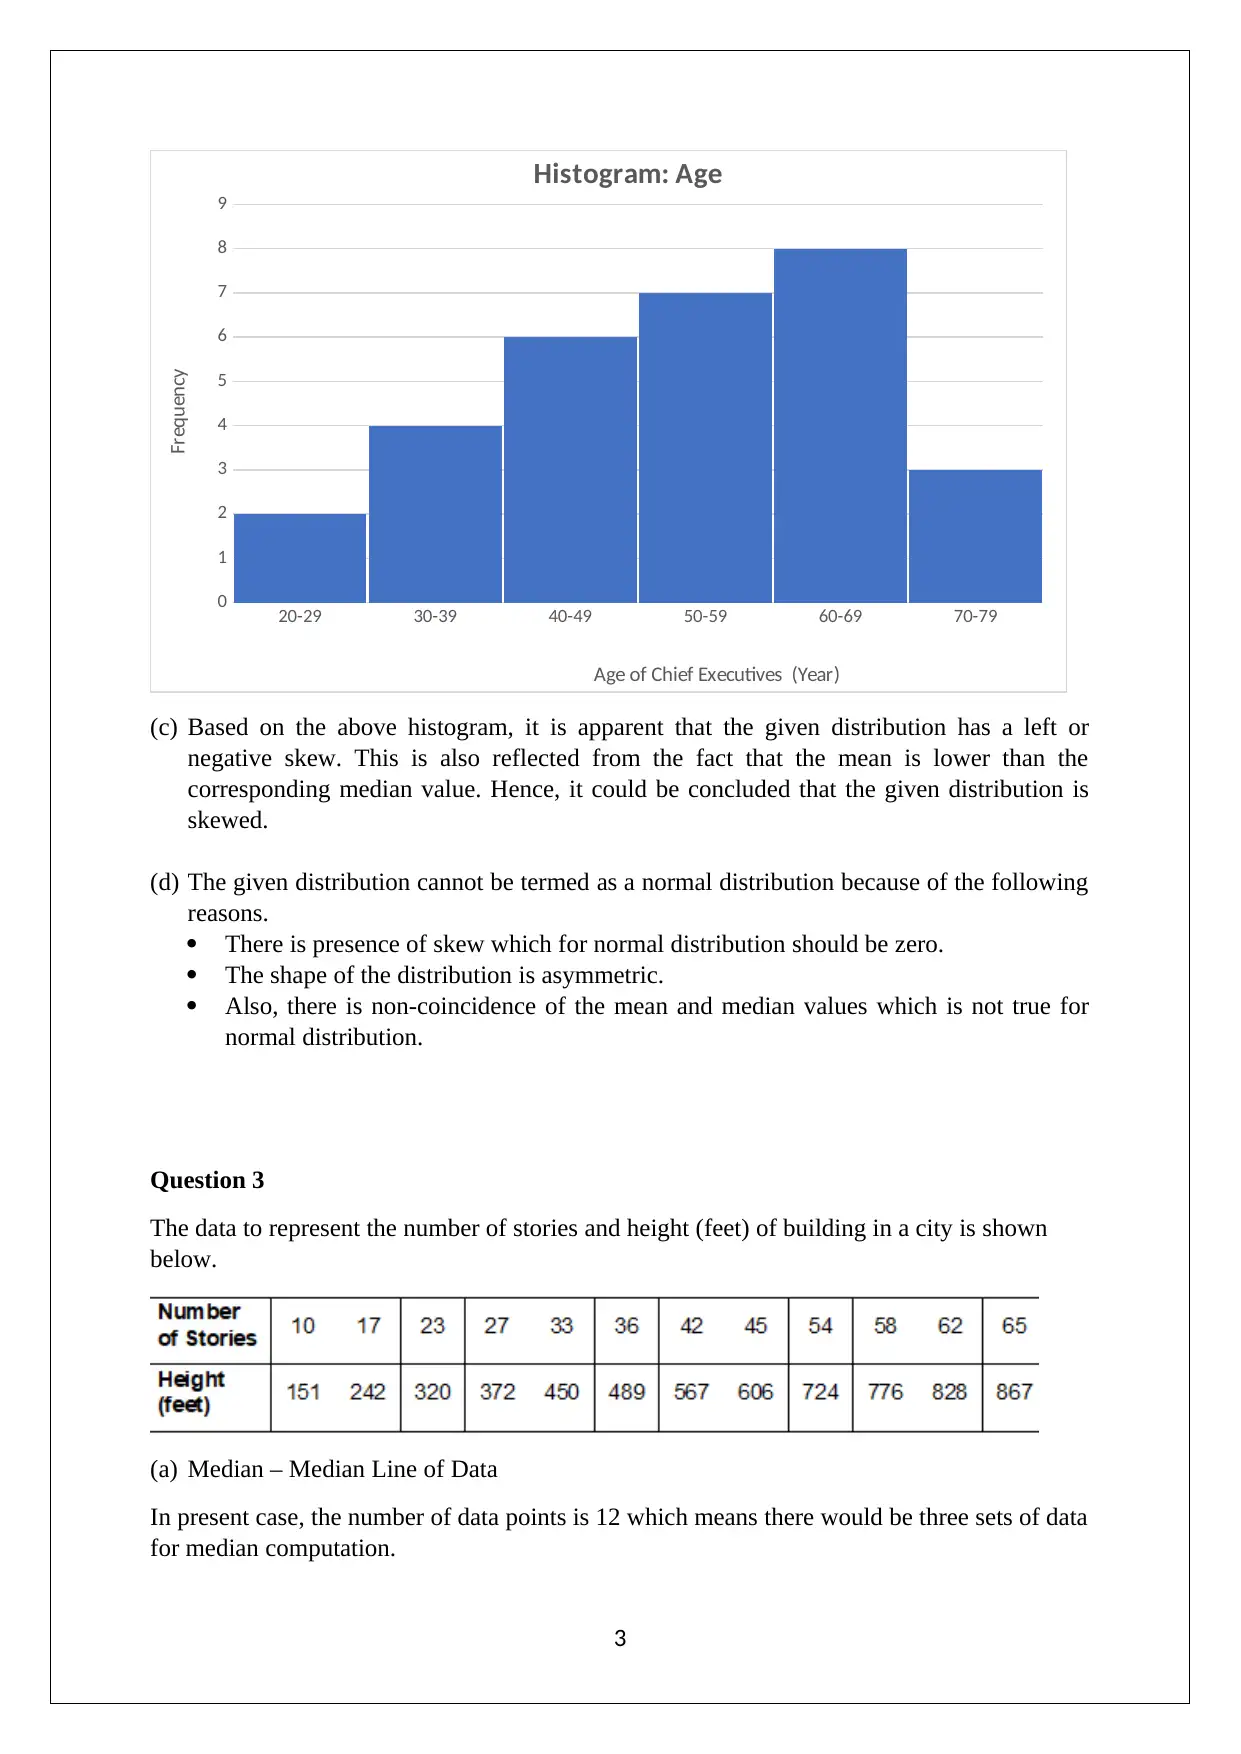
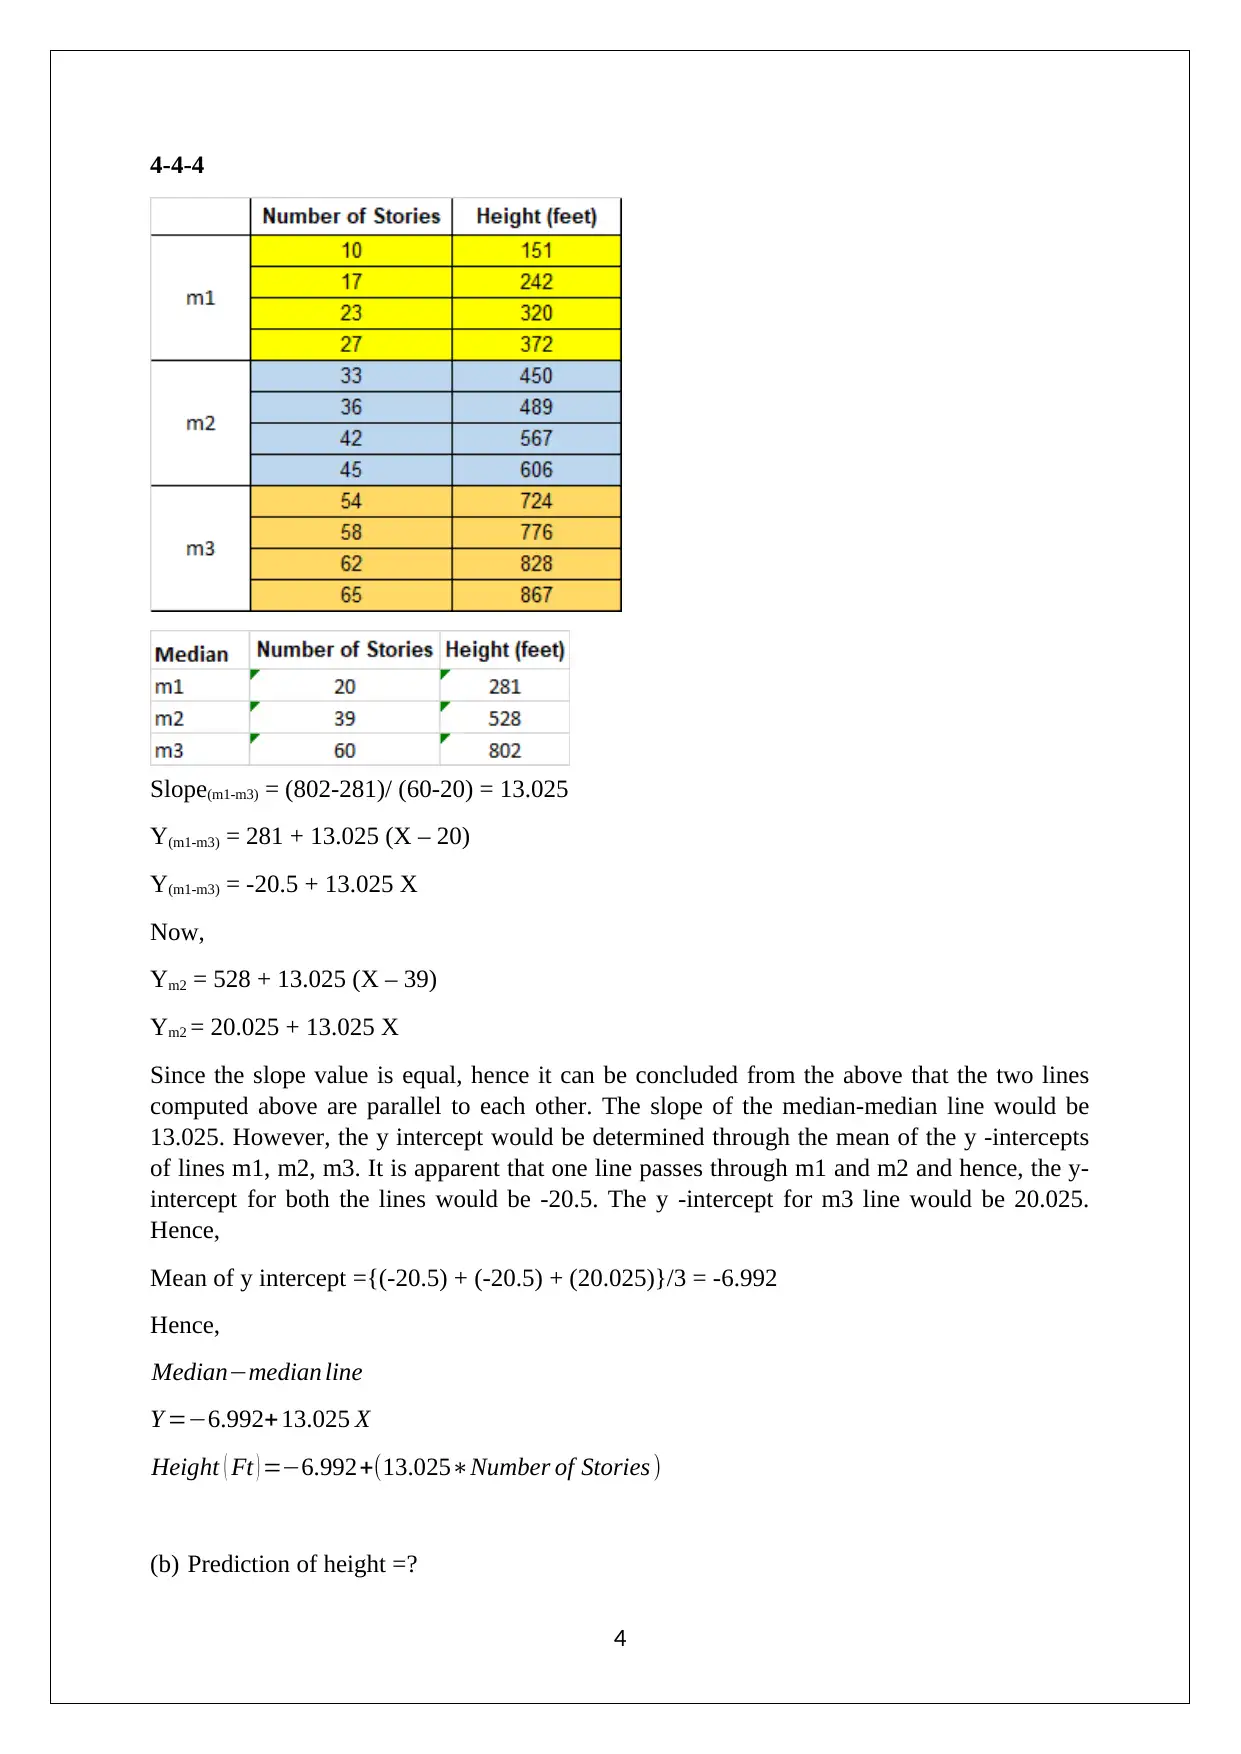
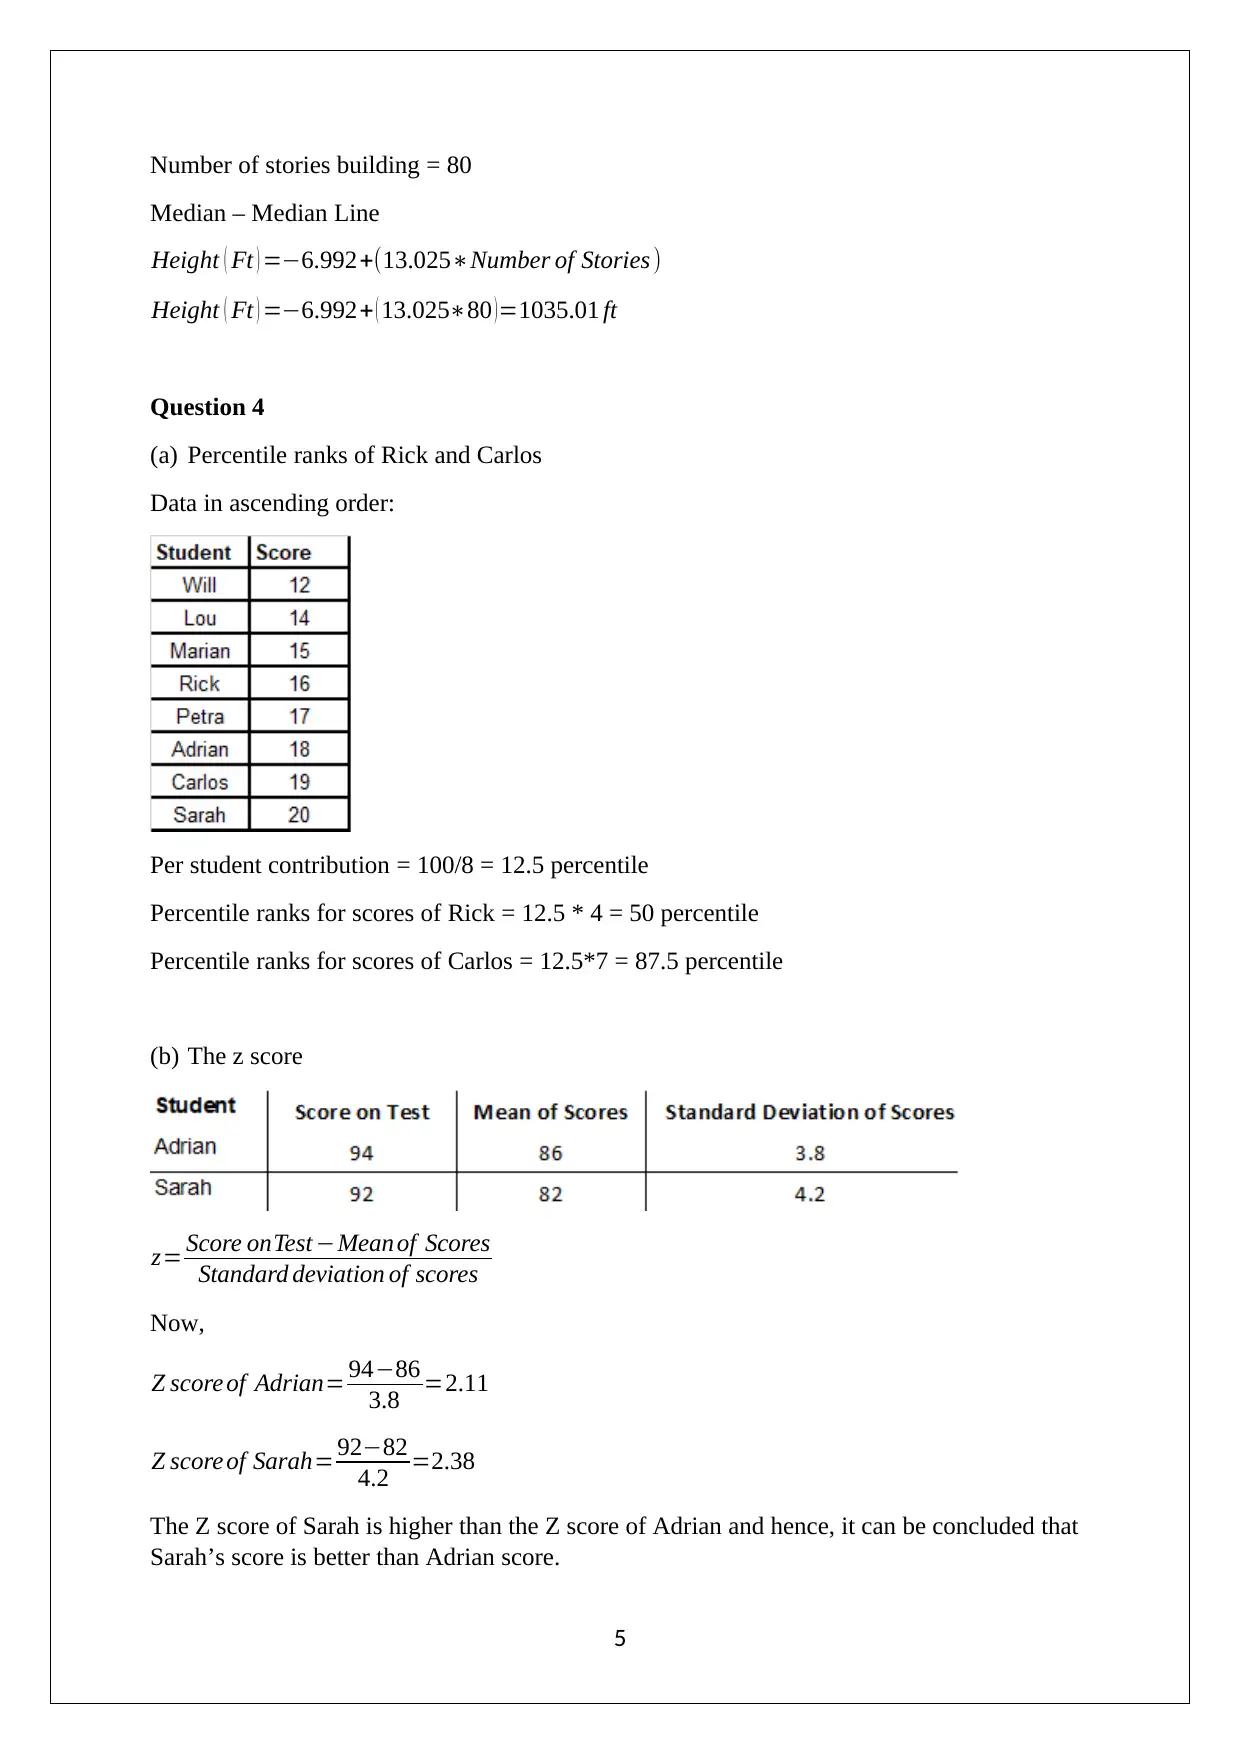
This statistics assignment provides solutions to a unit test, focusing on data analysis and interpretation. The first question involves calculating a five-number summary and creating a box-and-whisker plot for a given data set. The second question requires creating a frequency table and histogram from a provided dataset of ages, describing the distribution type, and analyzing the relationship between the mean and median, also determining if the distribution is normal. The third question uses a table of building stories and heights to compute the median-median line and predict building heights. Finally, the fourth question involves calculating percentile ranks and z-scores for given student scores, comparing their relative performance. The assignment demonstrates key statistical concepts and problem-solving skills.
Document Page
STATISTICS
STUDENT ID:
[Pick the date]
tabler-icon-diamond-filled.svg

Paraphrase This Document

Need a fresh take? Get an instant paraphrase of this document with our AI Paraphraser
Document Page
Question 1
Five number Summary
Minimum 51
First Quartile 66
Median 84
Third Quartile 90
Maximum 97
Box- and- whisker plot
40
45
50
55
60
65
70
75
80
Box Plot : Score
Question 2
(a) Frequency table for the given interval
Row Labels Count of Age
20-29 2
30-39 4
40-49 6
50-59 7
60-69 8
70-79 3
Grand Total 30
(b) Histogram
2
Document Page
20-29 30-39 40-49 50-59 60-69 70-79
0
1
2
3
4
5
6
7
8
9
Histogram: Age
Age of Chief Executives (Year)
Frequency
(c) Based on the above histogram, it is apparent that the given distribution has a left or
negative skew. This is also reflected from the fact that the mean is lower than the
corresponding median value. Hence, it could be concluded that the given distribution is
skewed.
(d) The given distribution cannot be termed as a normal distribution because of the following
reasons.
There is presence of skew which for normal distribution should be zero.
The shape of the distribution is asymmetric.
Also, there is non-coincidence of the mean and median values which is not true for
normal distribution.
Question 3
The data to represent the number of stories and height (feet) of building in a city is shown
below.
(a) Median – Median Line of Data
In present case, the number of data points is 12 which means there would be three sets of data
for median computation.
3
Document Page
4-4-4
Slope(m1-m3) = (802-281)/ (60-20) = 13.025
Y(m1-m3) = 281 + 13.025 (X – 20)
Y(m1-m3) = -20.5 + 13.025 X
Now,
Ym2 = 528 + 13.025 (X – 39)
Ym2 = 20.025 + 13.025 X
Since the slope value is equal, hence it can be concluded from the above that the two lines
computed above are parallel to each other. The slope of the median-median line would be
13.025. However, the y intercept would be determined through the mean of the y -intercepts
of lines m1, m2, m3. It is apparent that one line passes through m1 and m2 and hence, the y-
intercept for both the lines would be -20.5. The y -intercept for m3 line would be 20.025.
Hence,
Mean of y intercept ={(-20.5) + (-20.5) + (20.025)}/3 = -6.992
Hence,
Medianmedian line
Y =6.992+ 13.025 X
Height ( Ft ) =6.992+(13.025Number of Stories )
(b) Prediction of height =?
4
tabler-icon-diamond-filled.svg

Paraphrase This Document

Need a fresh take? Get an instant paraphrase of this document with our AI Paraphraser
Document Page
Number of stories building = 80
Median – Median Line
Height ( Ft ) =6.992+(13.025Number of Stories )
Height ( Ft ) =6.992+ ( 13.02580 )=1035.01 ft
Question 4
(a) Percentile ranks of Rick and Carlos
Data in ascending order:
Per student contribution = 100/8 = 12.5 percentile
Percentile ranks for scores of Rick = 12.5 * 4 = 50 percentile
Percentile ranks for scores of Carlos = 12.5*7 = 87.5 percentile
(b) The z score
z= Score onTest Mean of Scores
Standard deviation of scores
Now,
Z score of Adrian= 9486
3.8 =2.11
Z score of Sarah= 9282
4.2 =2.38
The Z score of Sarah is higher than the Z score of Adrian and hence, it can be concluded that
Sarah’s score is better than Adrian score.
5
chevron_up_icon
1 out of 5
circle_padding
hide_on_mobile
zoom_out_icon
[object Object]