MATH221 Statistics for Decision Making Week 2 Lab: Excel Analysis
VerifiedAdded on 2022/08/24
|5
|1378
|15
Homework Assignment
AI Summary
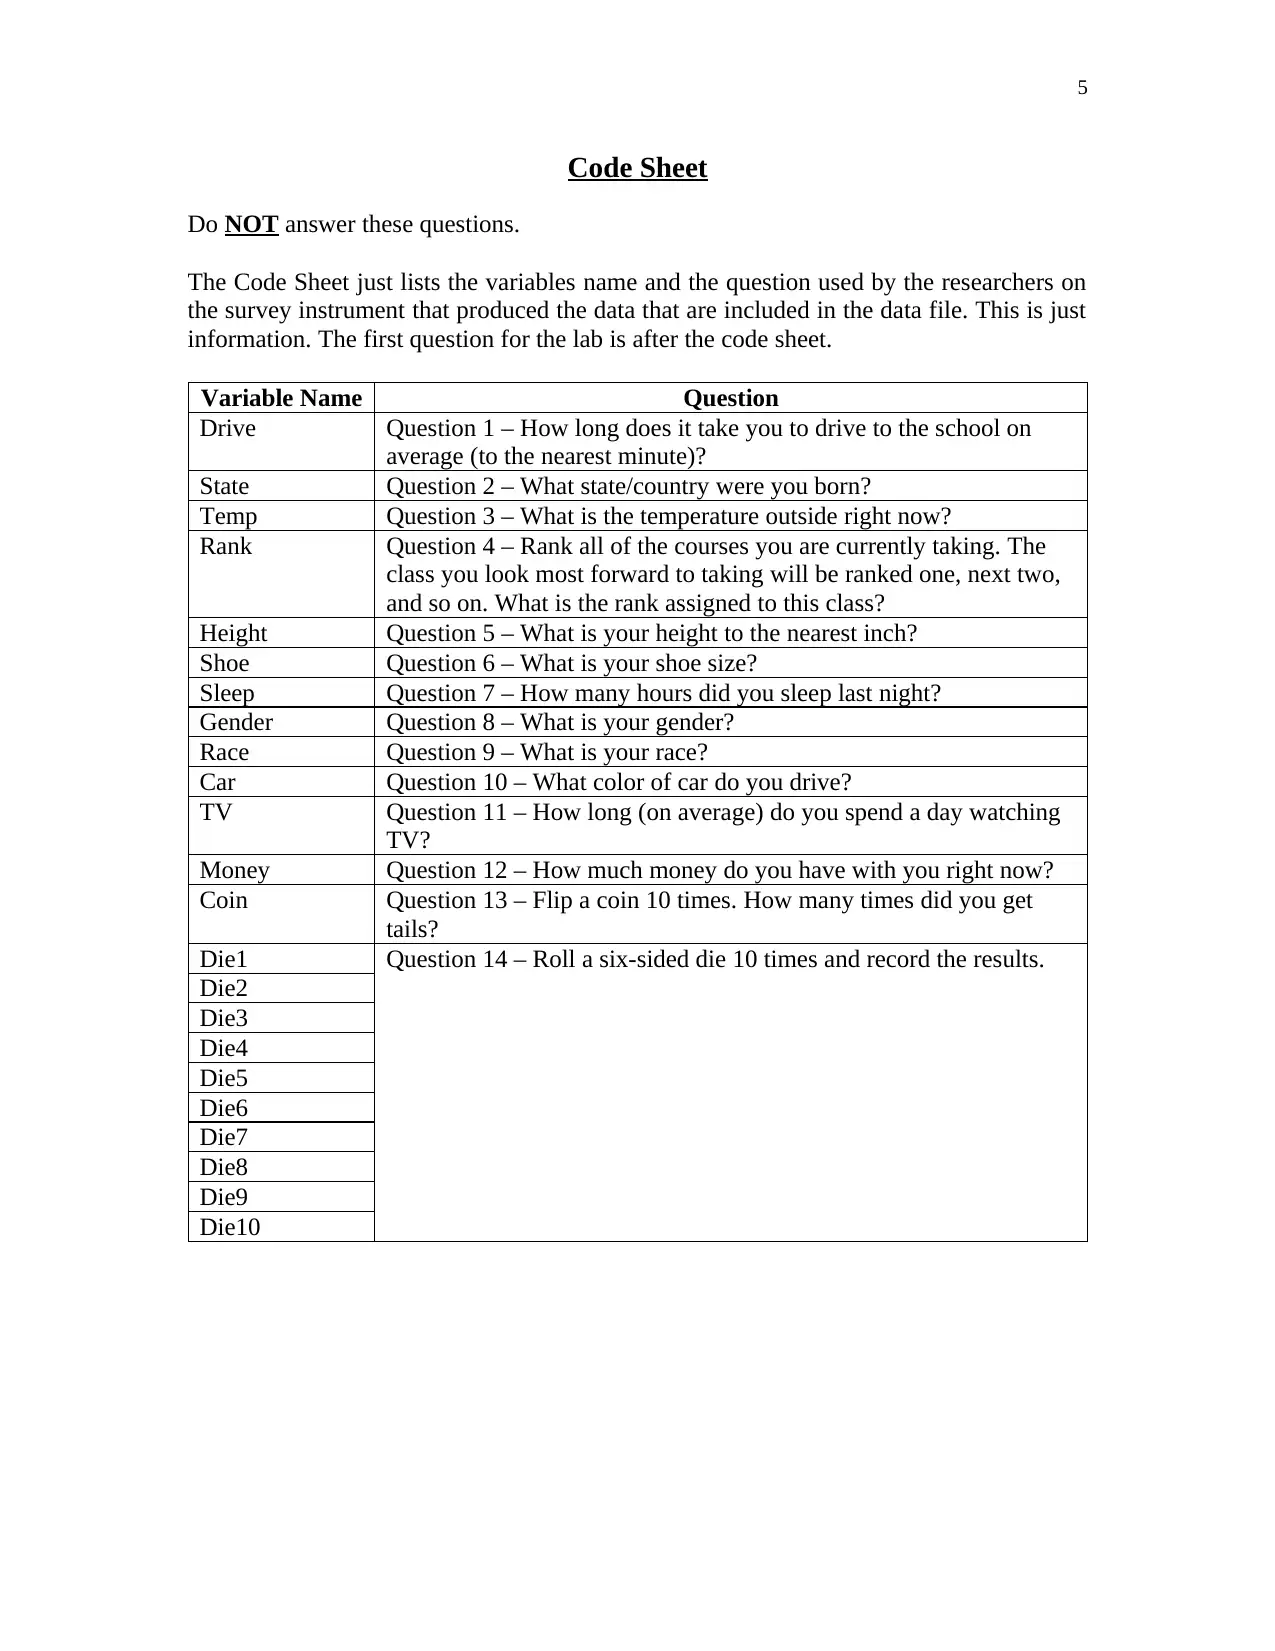
This document presents a completed lab assignment for a Statistics for Decision Making (MATH221) course, focusing on data analysis using Excel. The assignment involves creating various graphs, including pie charts, scatter plots, and histograms, to visualize and interpret survey data. Students are required to calculate descriptive statistics such as mean and standard deviation for variables like sleep and compare results based on gender. The assignment also explores the empirical rule to determine data ranges. Short-answer questions require students to analyze the graphs and provide explanations about the relationships between variables and the shape of the data distribution. The lab covers key statistical concepts like descriptive statistics, graphical representation, and the empirical rule, applying them to real-world survey data.
1 out of 5
Related Documents


Your All-in-One AI-Powered Toolkit for Academic Success.
+13062052269
info@desklib.com
Available 24*7 on WhatsApp / Email
![[object Object]](/_next/static/media/star-bottom.7253800d.svg)
Copyright © 2020–2026 A2Z Services. All Rights Reserved. Developed and managed by ZUCOL.