Statistics in Management: Analysis of Earnings, Deliveries, and EOQ
VerifiedAdded on 2020/12/29
|17
|3350
|361
Report
AI Summary
This report presents a comprehensive statistical analysis of data relevant to management practices. The analysis includes interpreting gross annual earnings in the public and private sectors from 2010 to 2016, identifying trends in male and female wages, and assessing the gap between earnings. The report utilizes ogive curves to estimate median and quartiles for hourly earnings, and calculates mean and standard deviation to compare earnings across different regions. Furthermore, it delves into delivery management, calculating the number of deliveries made annually and the number of bags delivered per delivery. Finally, the report explores Economic Order Quantity (EOQ) to determine cost-efficient delivery situations, analyzing the impact of current ordering policies on EOQ and associated costs. The report employs various statistical methods to provide insights into earnings, delivery efficiency, and inventory management.
Statistics in
Management
Management
Paraphrase This Document
Need a fresh take? Get an instant paraphrase of this document with our AI Paraphraser
Table of Contents
ACTIVTIY 1...................................................................................................................................1
(a) Interpretation of based on gross annual earning between the years 2010 and 2016..............1
.........................................................................................................................................................5
(b) Locating data related to gross annual earnings by industry sector........................................5
ACTIVITY 2...................................................................................................................................7
(a) Using ogive for estimating median and quartiles and calculation of mean and median........7
(b) Comparing the earnings of two regions...............................................................................10
ACTIVITY 3.................................................................................................................................10
(a) Calculation of deliveries made in each year.........................................................................10
(b) Calculation of number of bags delivered in each delivery...................................................11
(c) Assessing economic Order Quantity (EOQ)........................................................................11
(d) Calculation for the cost of current ordering policy and analysing the change in EOQ due to
it.................................................................................................................................................12
ACTIVITY 4.................................................................................................................................13
(a) Producing line chart indicating male and female gross annual earnings for public and
private sector from 2010 to 2016...............................................................................................13
(b) Producing Ogive for cumulative percentage of sales personnel versus hourly earning......14
ACTIVTIY 1
(a) Interpretation of based on gross annual earning between the years 2010 and 2016
Changes in gross annual earnings of public and private sector since 2010
Based on the data being received, it can be stated that there is small but positive change
in the gross annual earnings of private and sector wages received by male and female employees.
The changes being noticed can be indicated in the following manner:
2010 2011 2012 2013 2014 2015 2016
0
5000
10000
15000
20000
25000
30000
35000
Interpreting the above graph and tabular format, it can be indicated that there is adequate
amount of change in wages aspects of male employees between the year 2010 and 2016. The
change in yearly wages is high for public sector in comparison to that if private sector. In context
1
⊘ This is a preview!⊘
Do you want full access?
Subscribe today to unlock all pages.
Trusted by 1+ million students worldwide
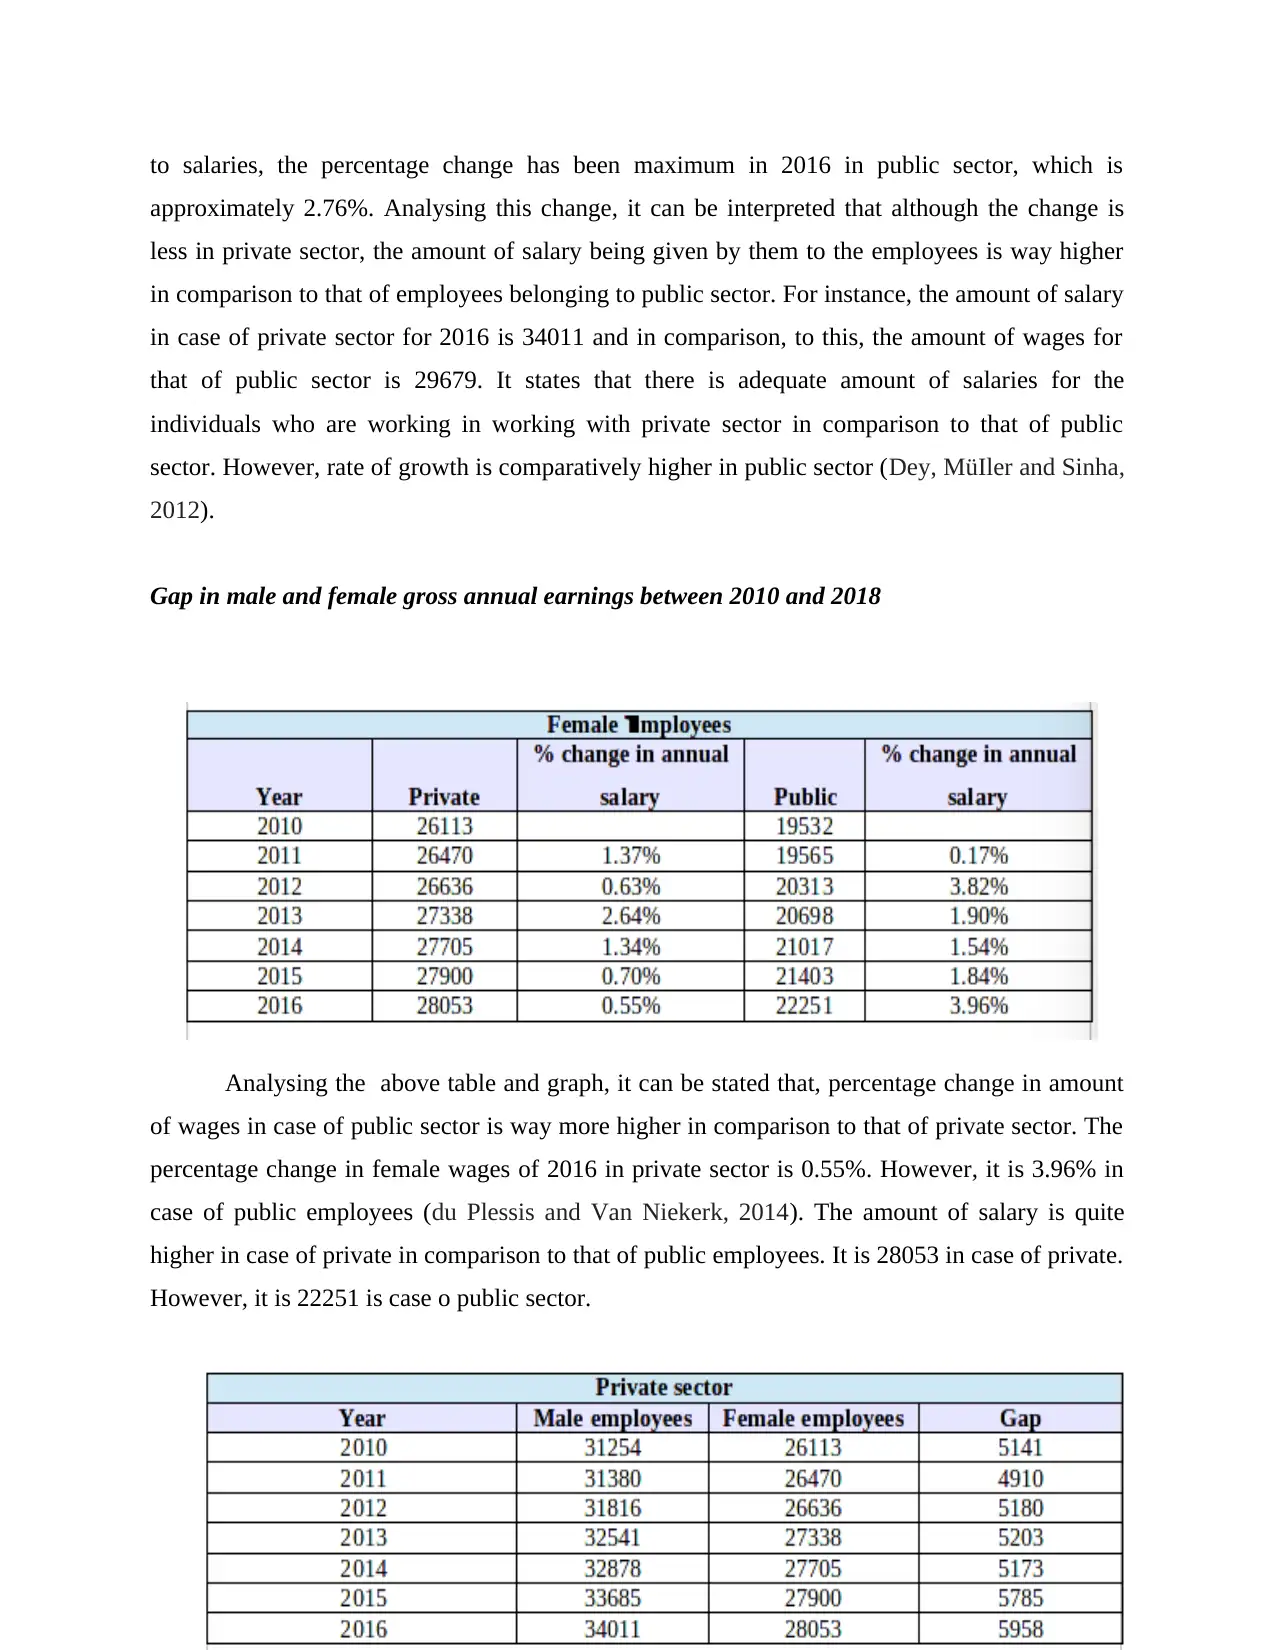
to salaries, the percentage change has been maximum in 2016 in public sector, which is
approximately 2.76%. Analysing this change, it can be interpreted that although the change is
less in private sector, the amount of salary being given by them to the employees is way higher
in comparison to that of employees belonging to public sector. For instance, the amount of salary
in case of private sector for 2016 is 34011 and in comparison, to this, the amount of wages for
that of public sector is 29679. It states that there is adequate amount of salaries for the
individuals who are working in working with private sector in comparison to that of public
sector. However, rate of growth is comparatively higher in public sector (Dey, MüIler and Sinha,
2012).
Gap in male and female gross annual earnings between 2010 and 2018
Analysing the above table and graph, it can be stated that, percentage change in amount
of wages in case of public sector is way more higher in comparison to that of private sector. The
percentage change in female wages of 2016 in private sector is 0.55%. However, it is 3.96% in
case of public employees (du Plessis and Van Niekerk, 2014). The amount of salary is quite
higher in case of private in comparison to that of public employees. It is 28053 in case of private.
However, it is 22251 is case o public sector.
2
Paraphrase This Document
Need a fresh take? Get an instant paraphrase of this document with our AI Paraphraser
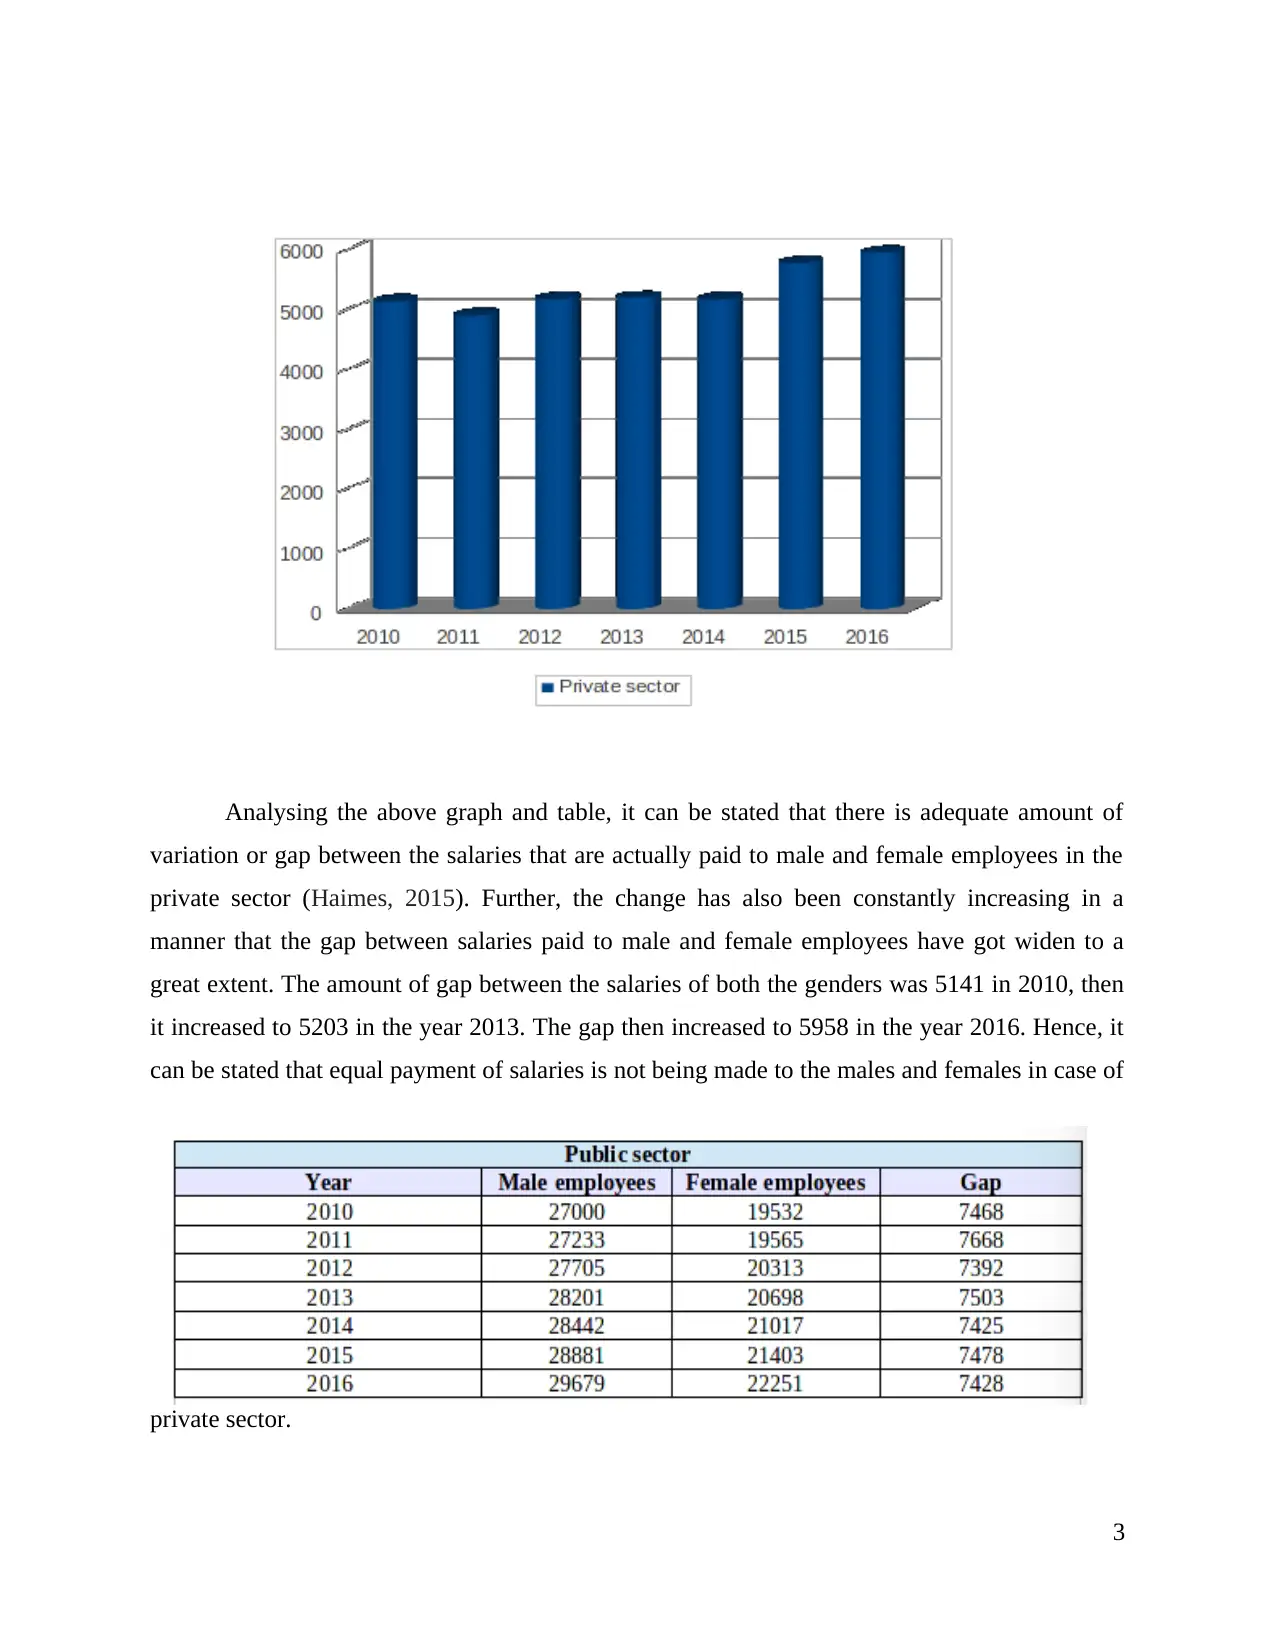
Analysing the above graph and table, it can be stated that there is adequate amount of
variation or gap between the salaries that are actually paid to male and female employees in the
private sector (Haimes, 2015). Further, the change has also been constantly increasing in a
manner that the gap between salaries paid to male and female employees have got widen to a
great extent. The amount of gap between the salaries of both the genders was 5141 in 2010, then
it increased to 5203 in the year 2013. The gap then increased to 5958 in the year 2016. Hence, it
can be stated that equal payment of salaries is not being made to the males and females in case of
private sector.
3
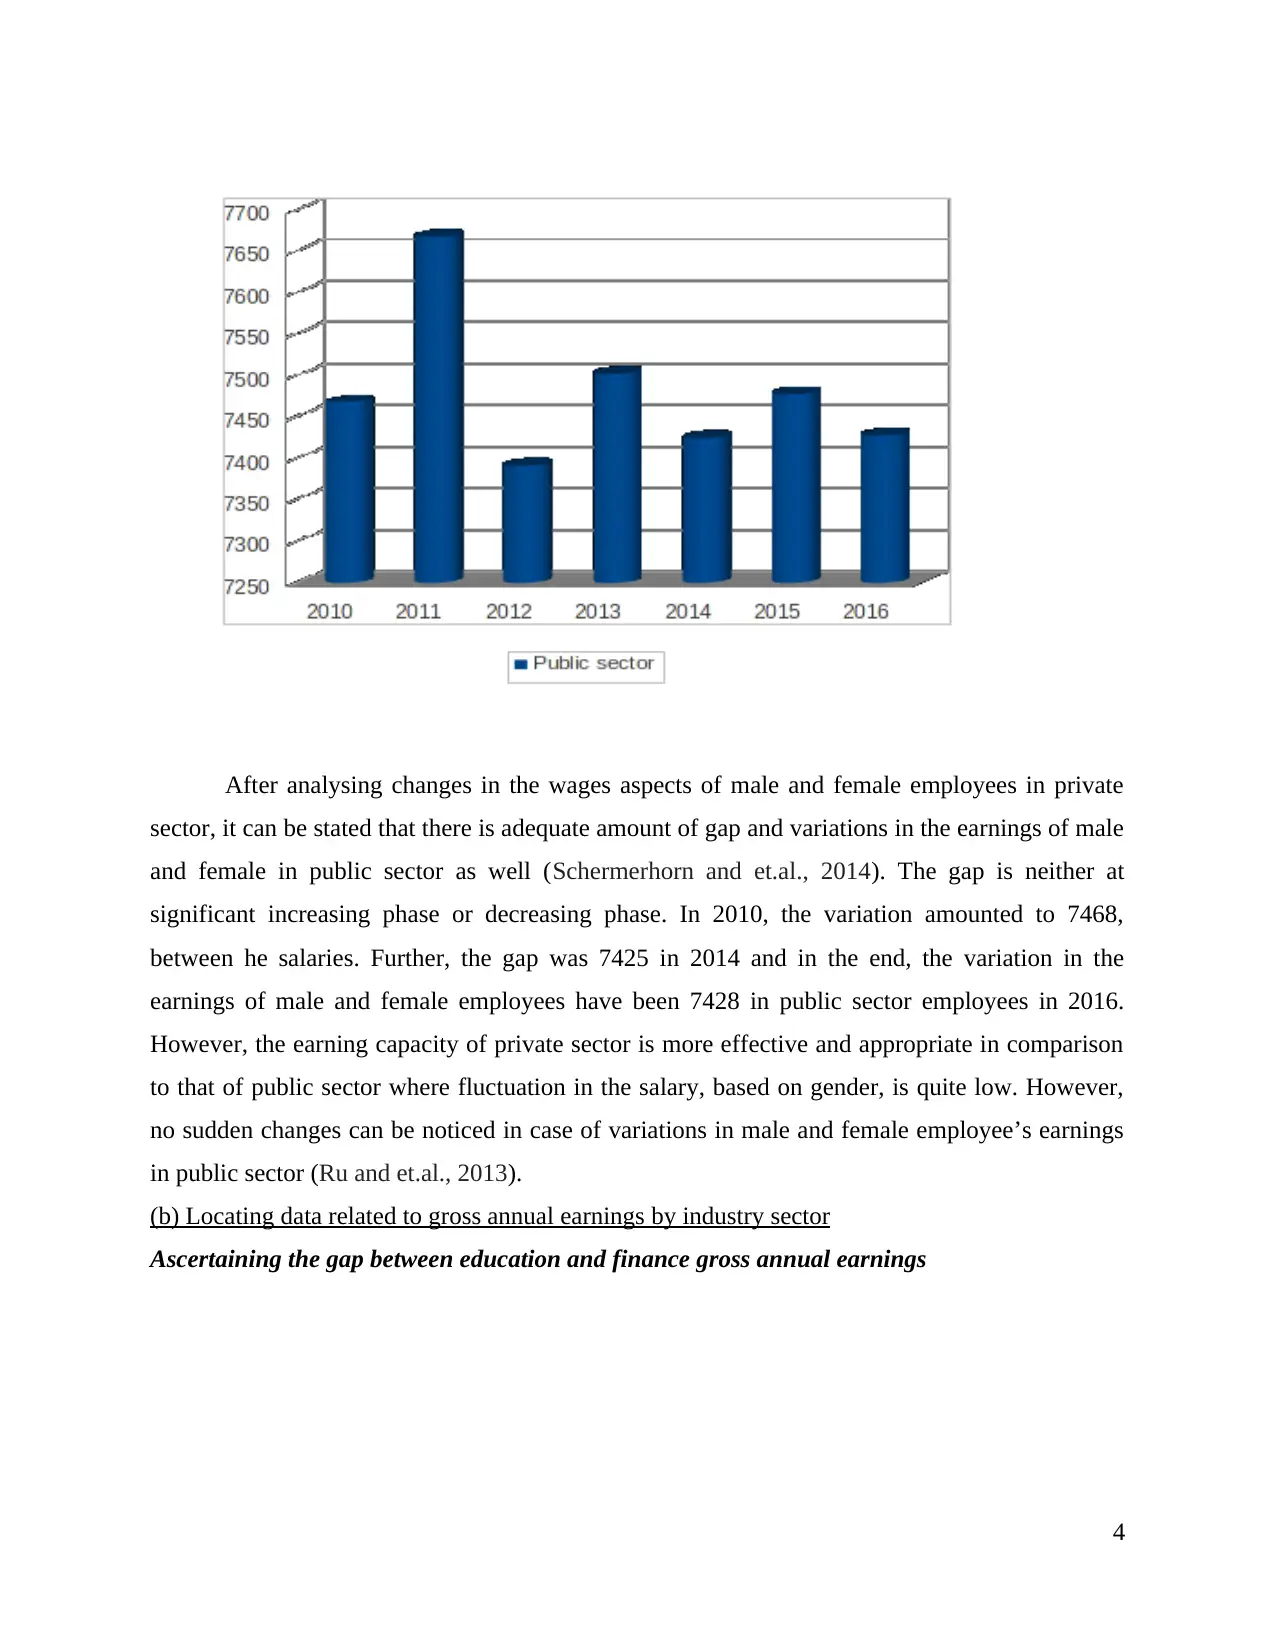
After analysing changes in the wages aspects of male and female employees in private
sector, it can be stated that there is adequate amount of gap and variations in the earnings of male
and female in public sector as well (Schermerhorn and et.al., 2014). The gap is neither at
significant increasing phase or decreasing phase. In 2010, the variation amounted to 7468,
between he salaries. Further, the gap was 7425 in 2014 and in the end, the variation in the
earnings of male and female employees have been 7428 in public sector employees in 2016.
However, the earning capacity of private sector is more effective and appropriate in comparison
to that of public sector where fluctuation in the salary, based on gender, is quite low. However,
no sudden changes can be noticed in case of variations in male and female employee’s earnings
in public sector (Ru and et.al., 2013).
(b) Locating data related to gross annual earnings by industry sector
Ascertaining the gap between education and finance gross annual earnings
4
⊘ This is a preview!⊘
Do you want full access?
Subscribe today to unlock all pages.
Trusted by 1+ million students worldwide
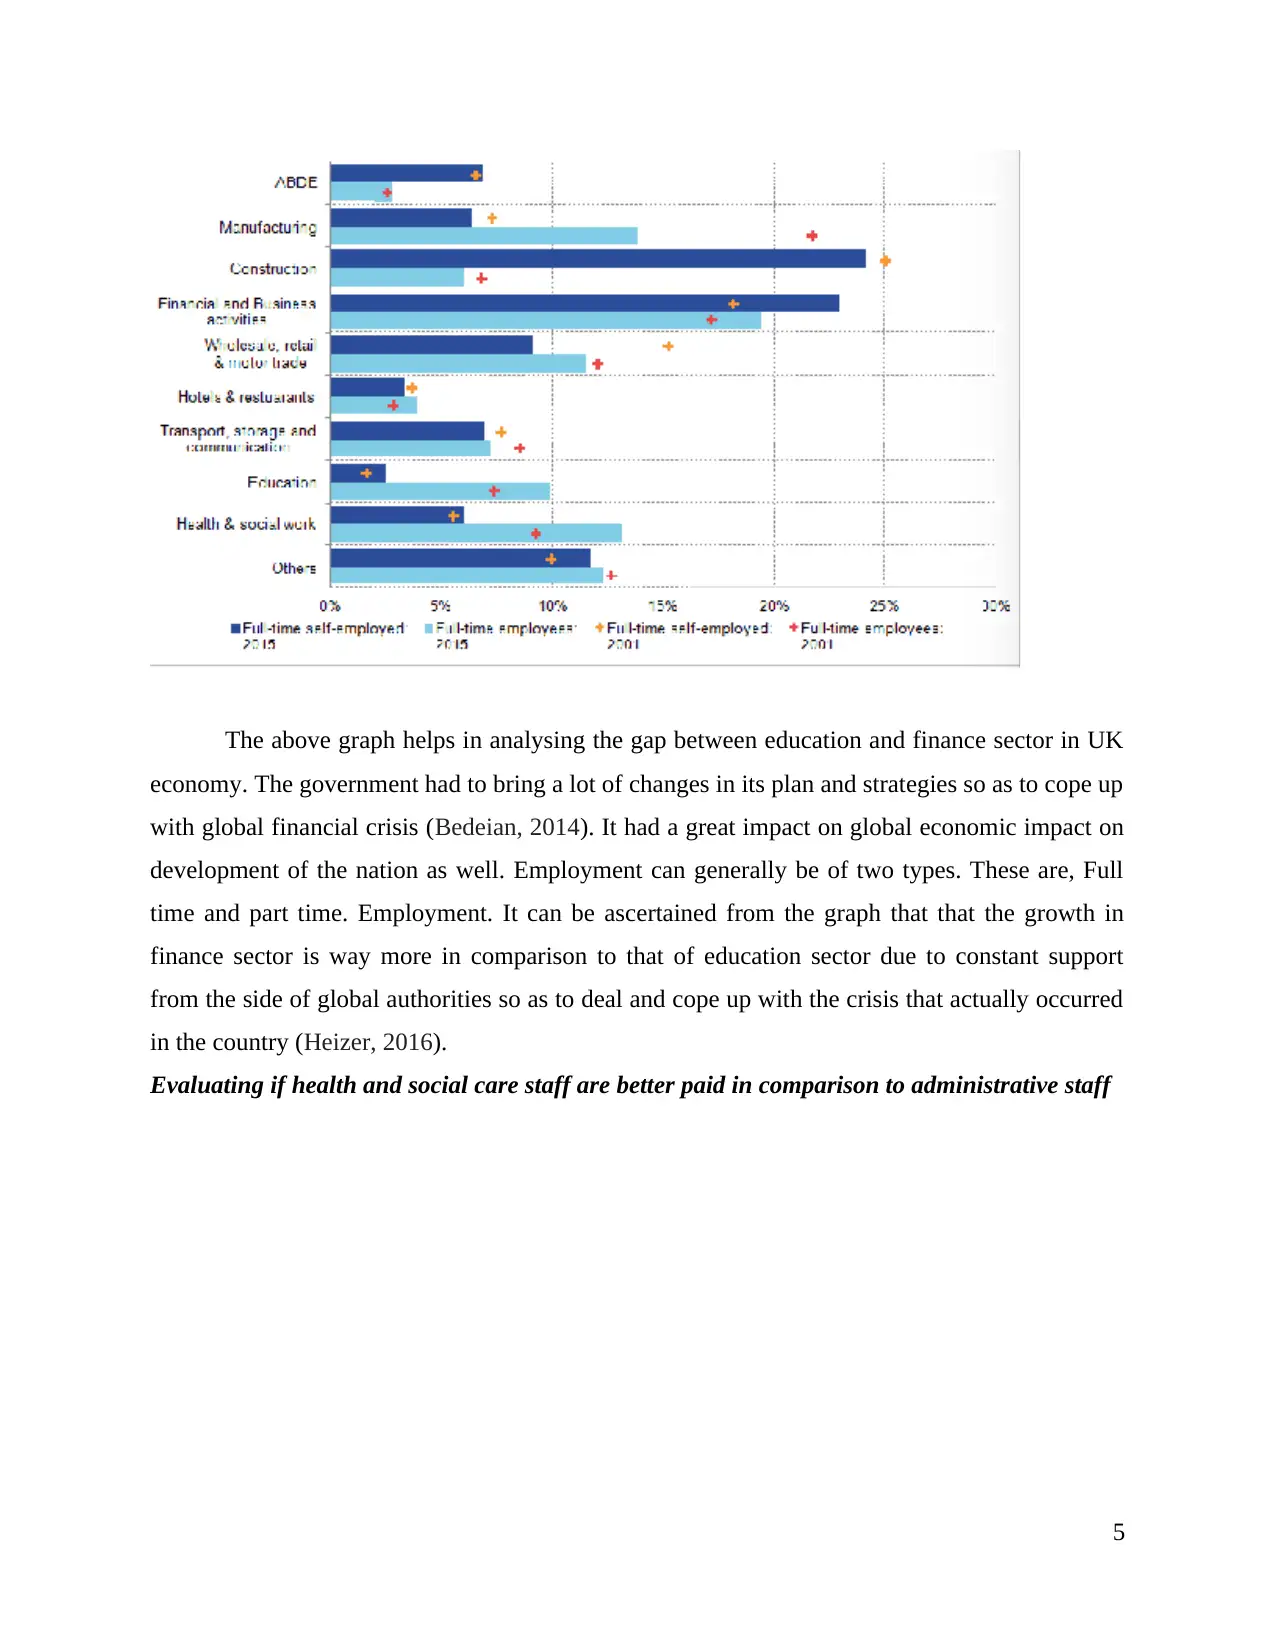
The above graph helps in analysing the gap between education and finance sector in UK
economy. The government had to bring a lot of changes in its plan and strategies so as to cope up
with global financial crisis (Bedeian, 2014). It had a great impact on global economic impact on
development of the nation as well. Employment can generally be of two types. These are, Full
time and part time. Employment. It can be ascertained from the graph that that the growth in
finance sector is way more in comparison to that of education sector due to constant support
from the side of global authorities so as to deal and cope up with the crisis that actually occurred
in the country (Heizer, 2016).
Evaluating if health and social care staff are better paid in comparison to administrative staff
5
Paraphrase This Document
Need a fresh take? Get an instant paraphrase of this document with our AI Paraphraser
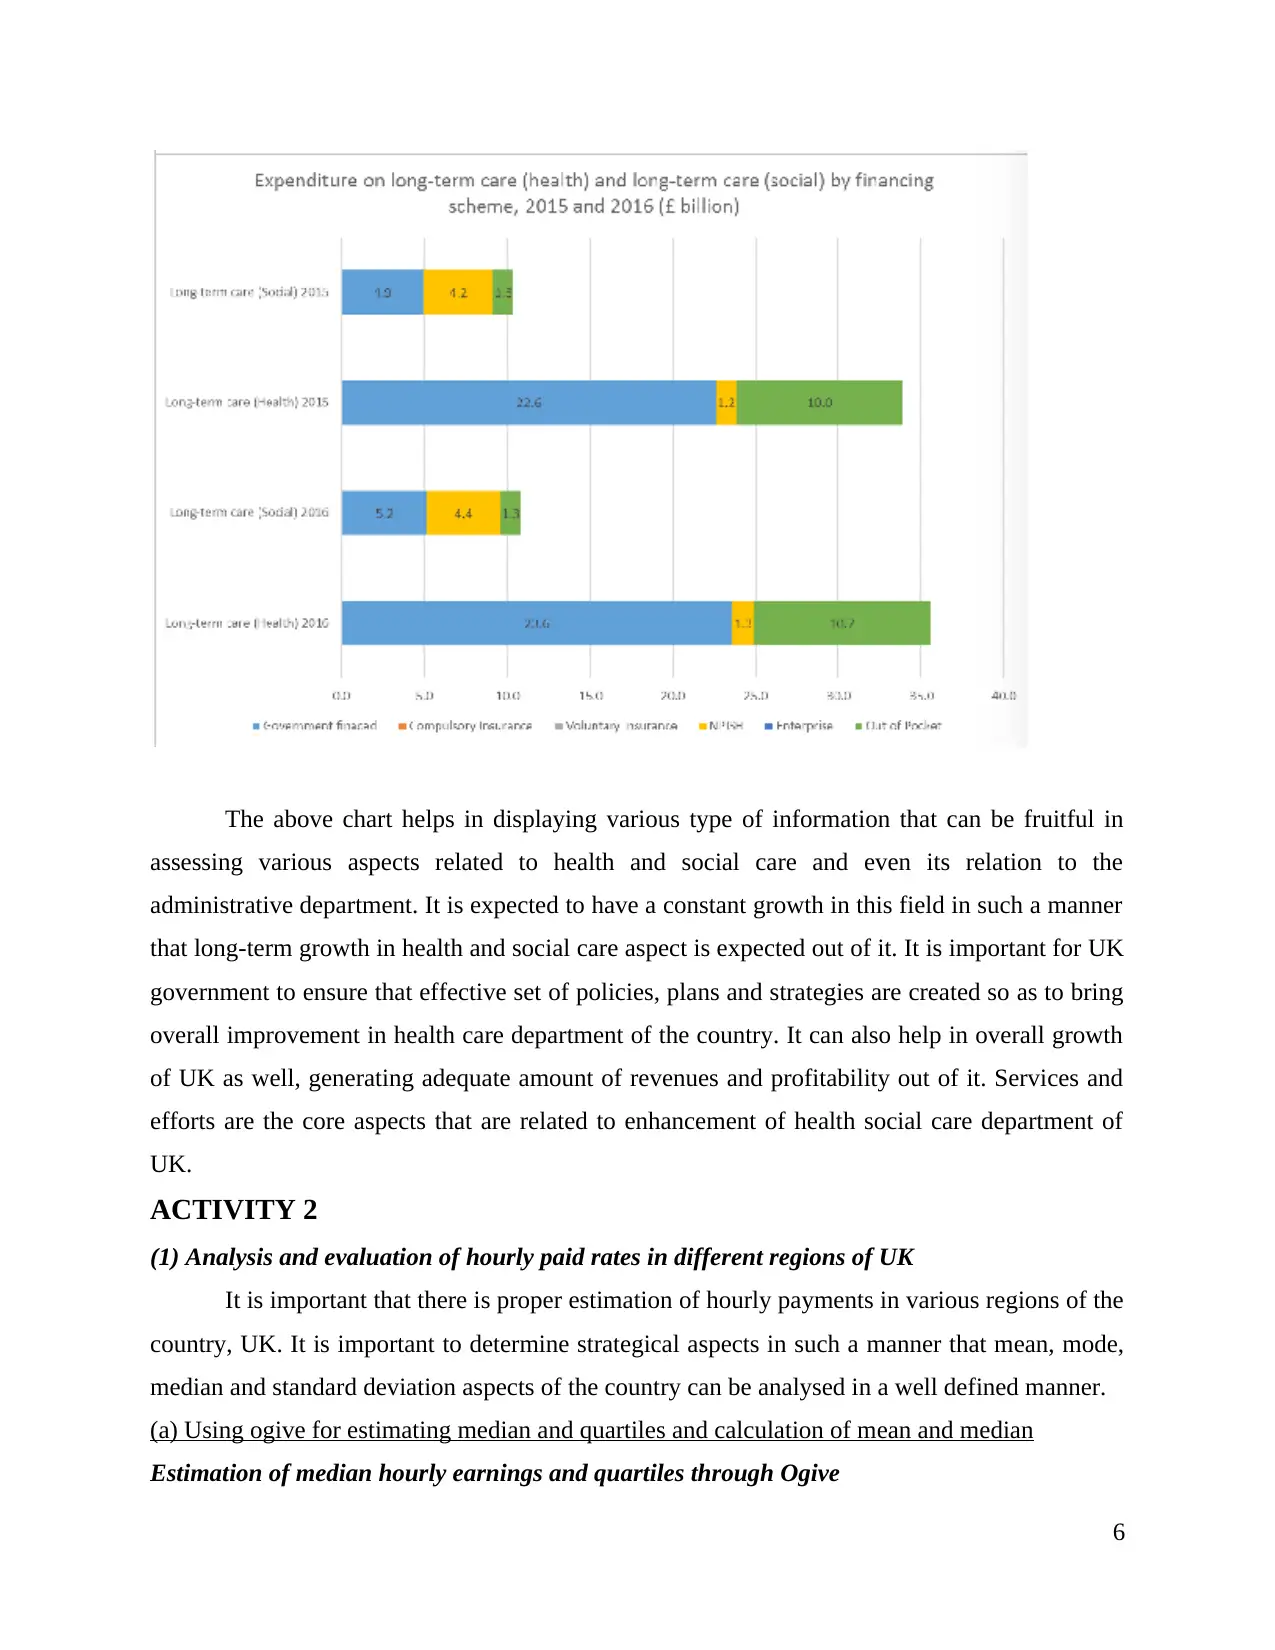
The above chart helps in displaying various type of information that can be fruitful in
assessing various aspects related to health and social care and even its relation to the
administrative department. It is expected to have a constant growth in this field in such a manner
that long-term growth in health and social care aspect is expected out of it. It is important for UK
government to ensure that effective set of policies, plans and strategies are created so as to bring
overall improvement in health care department of the country. It can also help in overall growth
of UK as well, generating adequate amount of revenues and profitability out of it. Services and
efforts are the core aspects that are related to enhancement of health social care department of
UK.
ACTIVITY 2
(1) Analysis and evaluation of hourly paid rates in different regions of UK
It is important that there is proper estimation of hourly payments in various regions of the
country, UK. It is important to determine strategical aspects in such a manner that mean, mode,
median and standard deviation aspects of the country can be analysed in a well defined manner.
(a) Using ogive for estimating median and quartiles and calculation of mean and median
Estimation of median hourly earnings and quartiles through Ogive
6
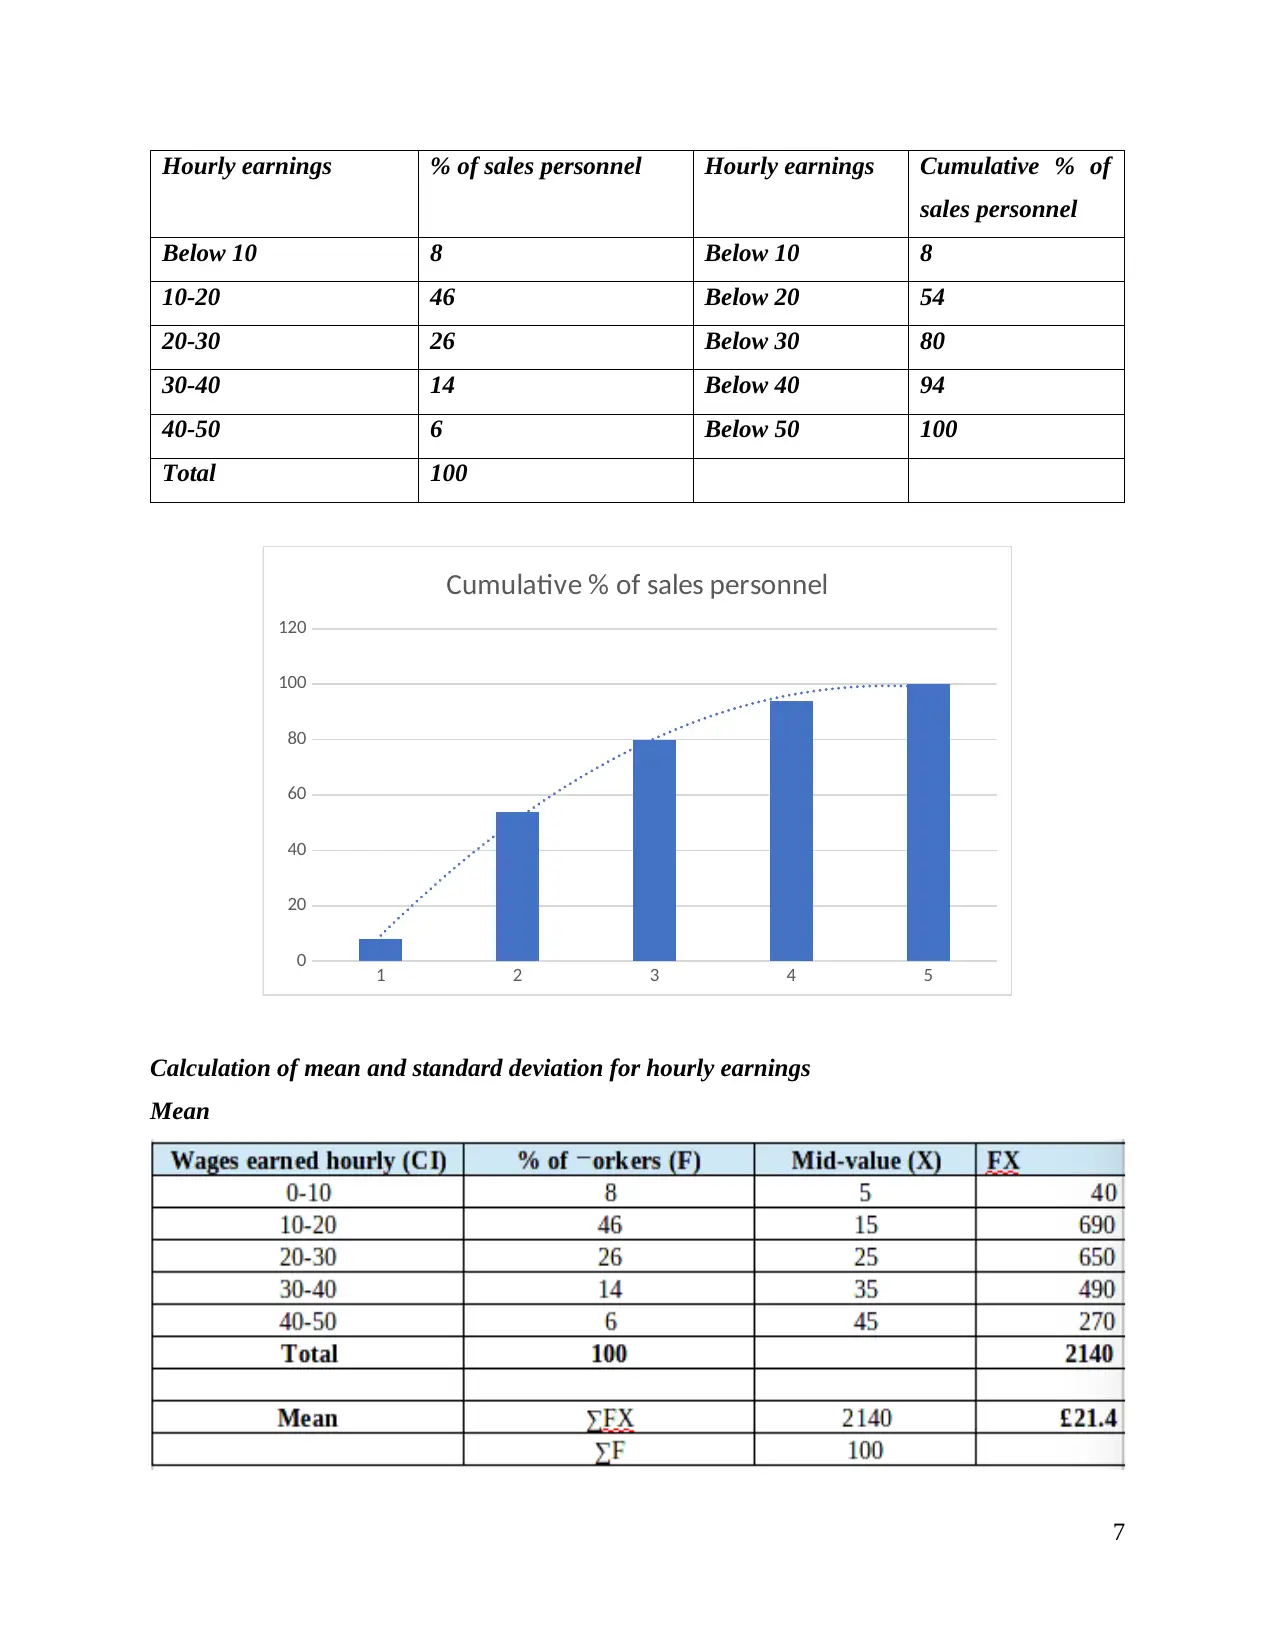
Hourly earnings % of sales personnel Hourly earnings Cumulative % of
sales personnel
Below 10 8 Below 10 8
10-20 46 Below 20 54
20-30 26 Below 30 80
30-40 14 Below 40 94
40-50 6 Below 50 100
Total 100
1 2 3 4 5
0
20
40
60
80
100
120
Cumulative % of sales personnel
Calculation of mean and standard deviation for hourly earnings
Mean
7
sales personnel
Below 10 8 Below 10 8
10-20 46 Below 20 54
20-30 26 Below 30 80
30-40 14 Below 40 94
40-50 6 Below 50 100
Total 100
1 2 3 4 5
0
20
40
60
80
100
120
Cumulative % of sales personnel
Calculation of mean and standard deviation for hourly earnings
Mean
7
⊘ This is a preview!⊘
Do you want full access?
Subscribe today to unlock all pages.
Trusted by 1+ million students worldwide
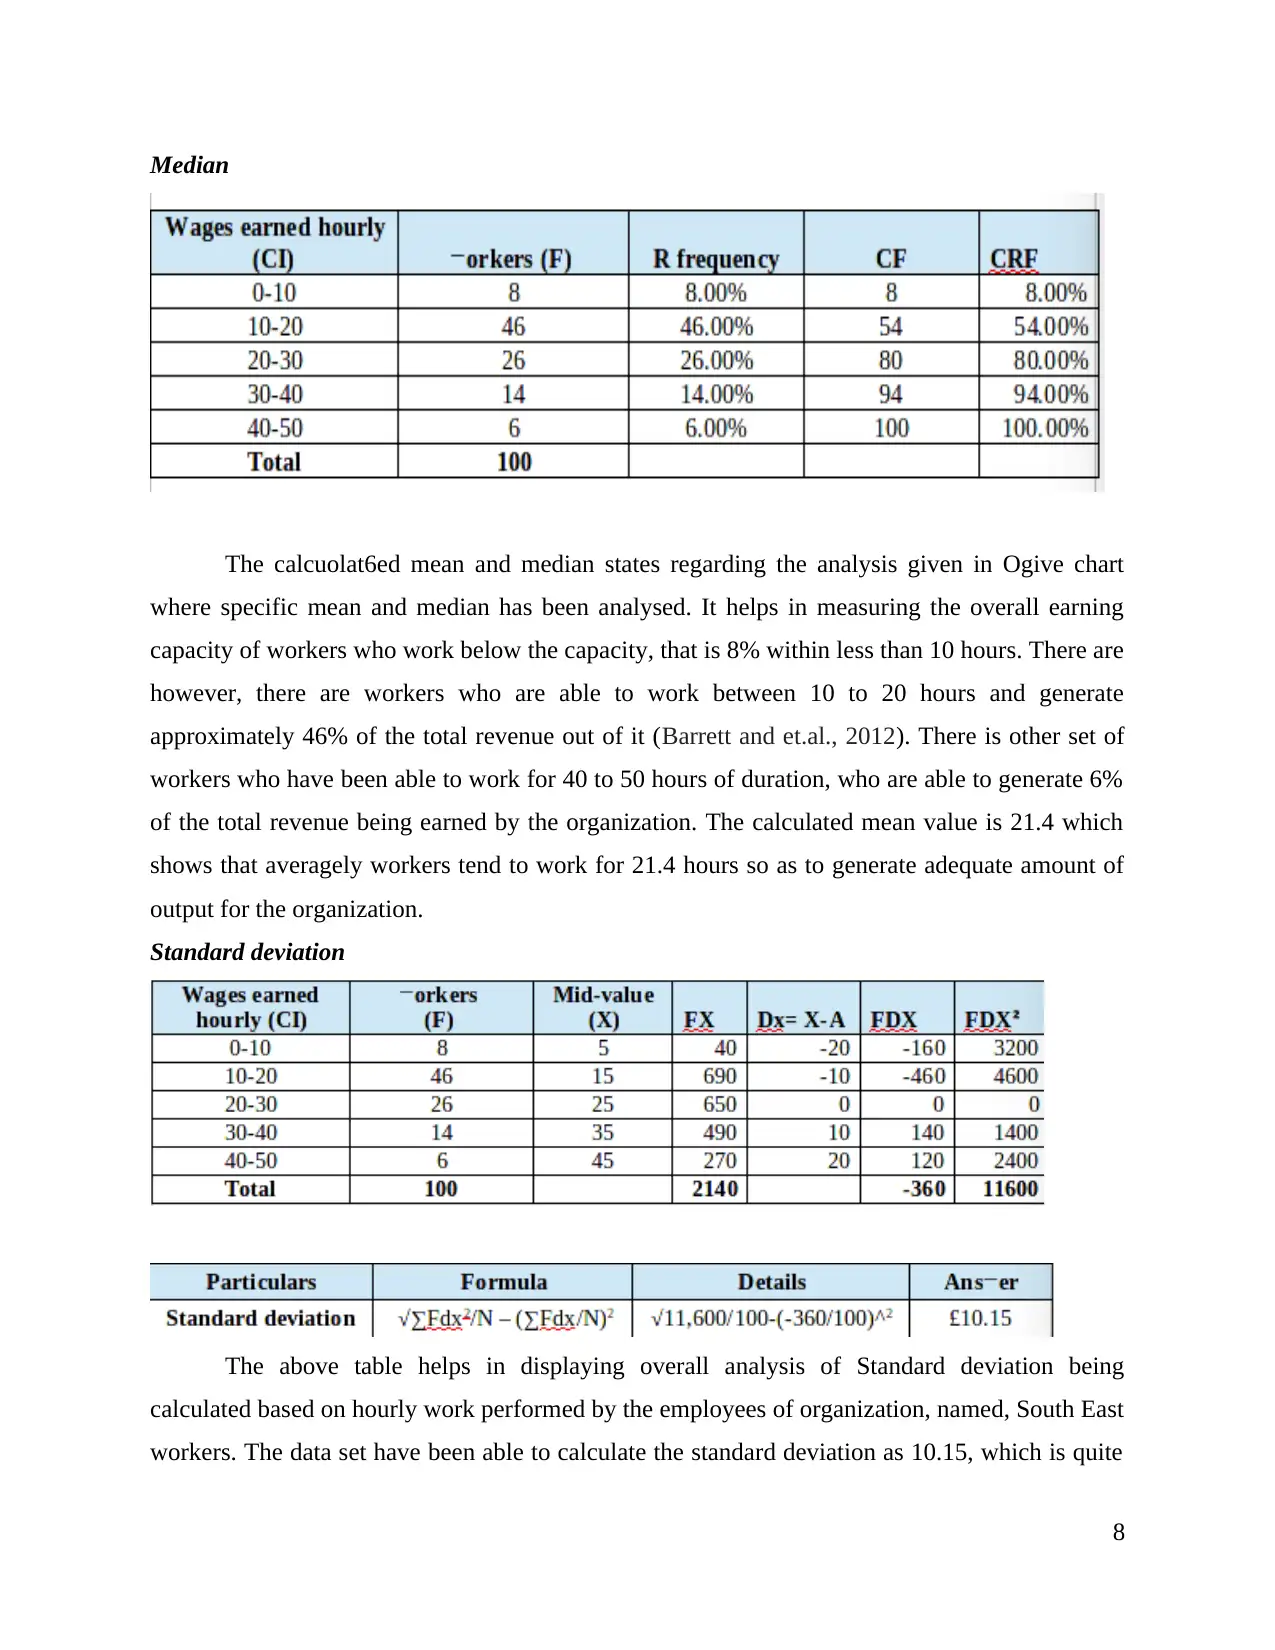
Median
The calcuolat6ed mean and median states regarding the analysis given in Ogive chart
where specific mean and median has been analysed. It helps in measuring the overall earning
capacity of workers who work below the capacity, that is 8% within less than 10 hours. There are
however, there are workers who are able to work between 10 to 20 hours and generate
approximately 46% of the total revenue out of it (Barrett and et.al., 2012). There is other set of
workers who have been able to work for 40 to 50 hours of duration, who are able to generate 6%
of the total revenue being earned by the organization. The calculated mean value is 21.4 which
shows that averagely workers tend to work for 21.4 hours so as to generate adequate amount of
output for the organization.
Standard deviation
The above table helps in displaying overall analysis of Standard deviation being
calculated based on hourly work performed by the employees of organization, named, South East
workers. The data set have been able to calculate the standard deviation as 10.15, which is quite
8
Paraphrase This Document
Need a fresh take? Get an instant paraphrase of this document with our AI Paraphraser
less in comparison to that of mean value, which is 21.40 in this scenario. Hence, it can be stated
that margin of labour force who are able to work on hourly basis, have been adequately
distributed (Hribar and Yang, 2016).
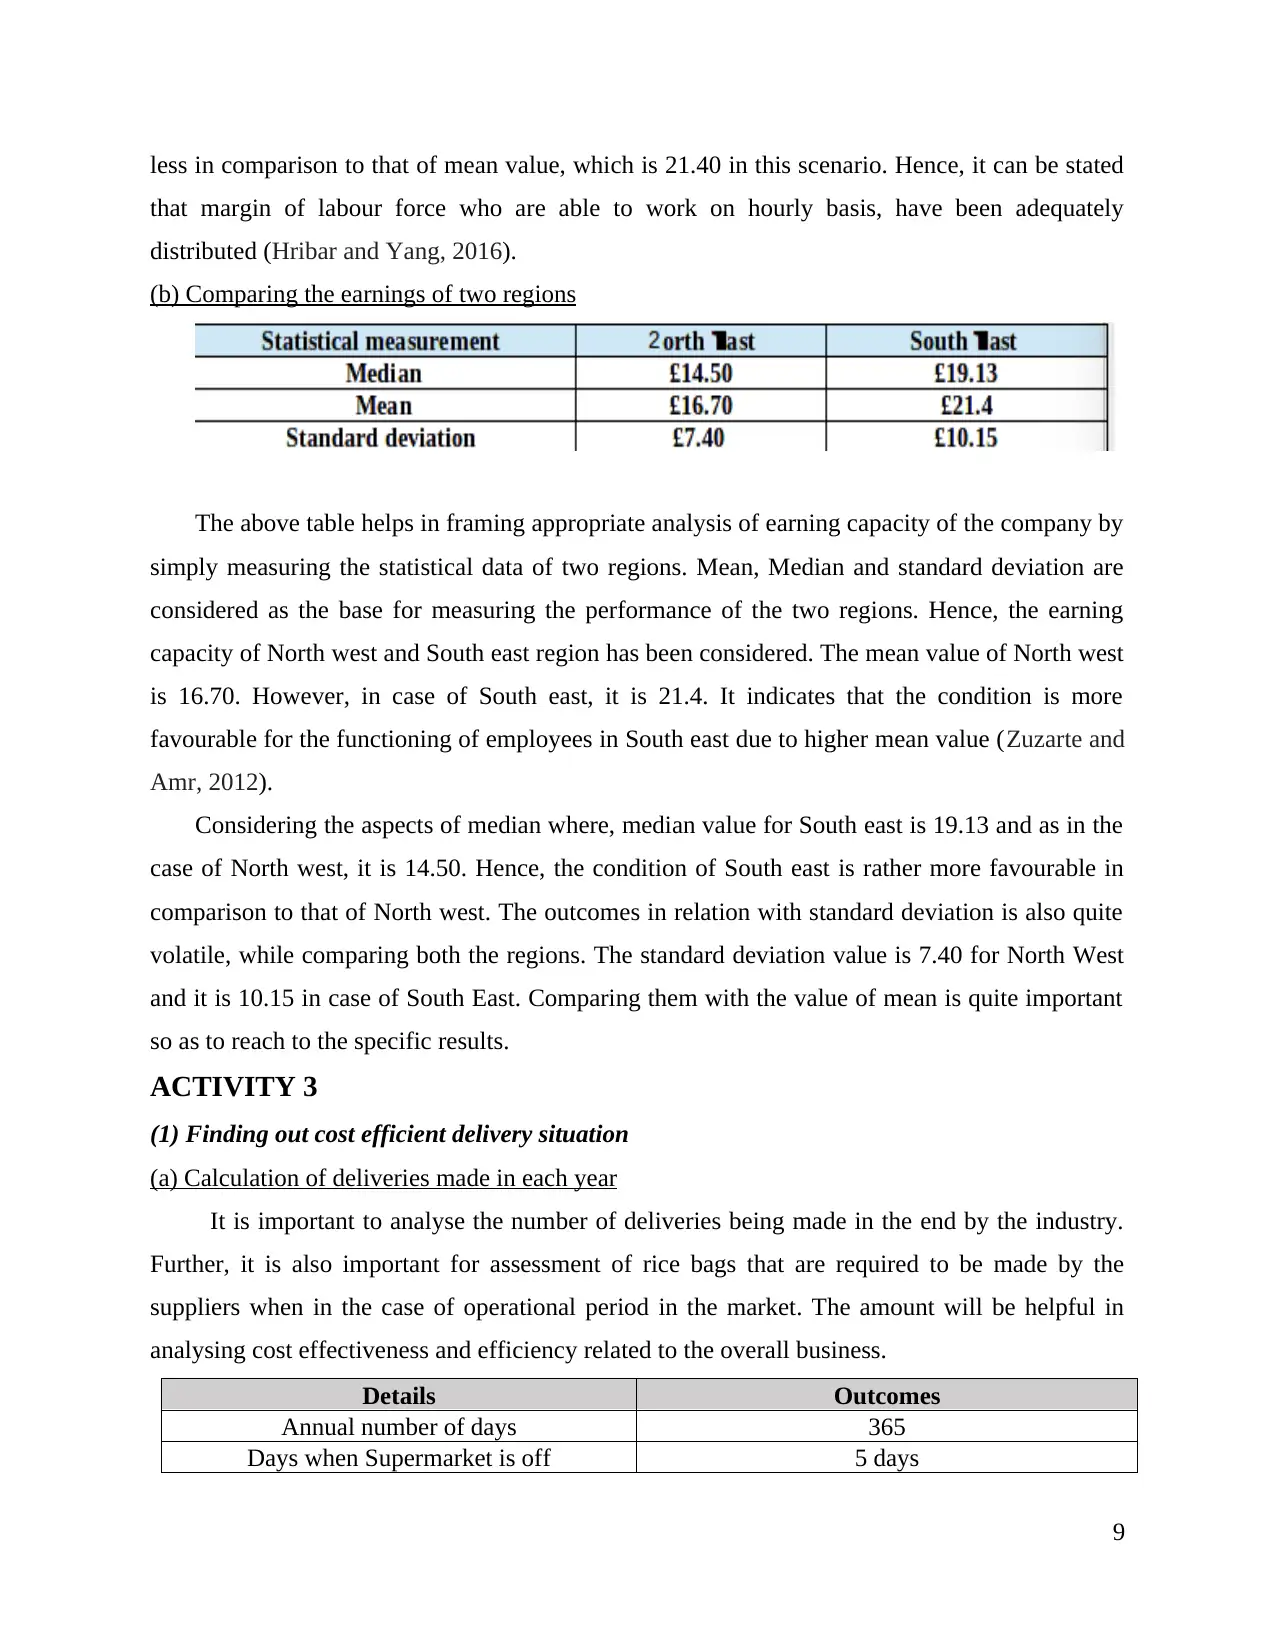
(b) Comparing the earnings of two regions
The above table helps in framing appropriate analysis of earning capacity of the company by
simply measuring the statistical data of two regions. Mean, Median and standard deviation are
considered as the base for measuring the performance of the two regions. Hence, the earning
capacity of North west and South east region has been considered. The mean value of North west
is 16.70. However, in case of South east, it is 21.4. It indicates that the condition is more
favourable for the functioning of employees in South east due to higher mean value (Zuzarte and
Amr, 2012).
Considering the aspects of median where, median value for South east is 19.13 and as in the
case of North west, it is 14.50. Hence, the condition of South east is rather more favourable in
comparison to that of North west. The outcomes in relation with standard deviation is also quite
volatile, while comparing both the regions. The standard deviation value is 7.40 for North West
and it is 10.15 in case of South East. Comparing them with the value of mean is quite important
so as to reach to the specific results.
ACTIVITY 3
(1) Finding out cost efficient delivery situation
(a) Calculation of deliveries made in each year
It is important to analyse the number of deliveries being made in the end by the industry.
Further, it is also important for assessment of rice bags that are required to be made by the
suppliers when in the case of operational period in the market. The amount will be helpful in
analysing cost effectiveness and efficiency related to the overall business.
Details Outcomes
Annual number of days 365
Days when Supermarket is off 5 days
9
that margin of labour force who are able to work on hourly basis, have been adequately
distributed (Hribar and Yang, 2016).
(b) Comparing the earnings of two regions
The above table helps in framing appropriate analysis of earning capacity of the company by
simply measuring the statistical data of two regions. Mean, Median and standard deviation are
considered as the base for measuring the performance of the two regions. Hence, the earning
capacity of North west and South east region has been considered. The mean value of North west
is 16.70. However, in case of South east, it is 21.4. It indicates that the condition is more
favourable for the functioning of employees in South east due to higher mean value (Zuzarte and
Amr, 2012).
Considering the aspects of median where, median value for South east is 19.13 and as in the
case of North west, it is 14.50. Hence, the condition of South east is rather more favourable in
comparison to that of North west. The outcomes in relation with standard deviation is also quite
volatile, while comparing both the regions. The standard deviation value is 7.40 for North West
and it is 10.15 in case of South East. Comparing them with the value of mean is quite important
so as to reach to the specific results.
ACTIVITY 3
(1) Finding out cost efficient delivery situation
(a) Calculation of deliveries made in each year
It is important to analyse the number of deliveries being made in the end by the industry.
Further, it is also important for assessment of rice bags that are required to be made by the
suppliers when in the case of operational period in the market. The amount will be helpful in
analysing cost effectiveness and efficiency related to the overall business.
Details Outcomes
Annual number of days 365
Days when Supermarket is off 5 days
9
Total annual delivery (deducting
supermarket off) 365 – 5 = 360 days
Remaining number of days delivered 12
Number of deliveries made by the industry
360 days /12 days = 30 deliveries
Since, number of delivery is the clear representation of effectiveness of the business,
presently the company has been able to deliver 30 rice bags in a year, when in operating period.
The analysis is important to consider the condition of 5 days where the supermarket is not
operational and remain closed. Hence, only 360 working days left for the organization soas to
supply its rice bags. Further, the company is able to deliver in 12 days only. Hence, it can be
stated that one rice bag is delivered to the market after every 12 days. Hence, only 30 deliveries
can be made by the suppliers in the end (Venables and Ripley, 2013).
(b) Calculation of number of bags delivered in each delivery
With respect to the analysis of number of deliveries to be made by the suppliers for rice
bags, it is important to analyse that the number of bags being delivered by the suppliers in total
or in each delivery. Hence, it is important to consider the number of deliveries made yearly, that
has already been calculated in the previous section.
Details Outcomes (In £)
Demand on yearly basis 450000
No. of deliveries 30
Demand on yearly basis / No. of bags
No. of bags (in each delivery) 15000
The above table indicates the calculation of number of bags ultimately delivered by the
suppliers to the supermarket. Since, the organization is able to make 30 supplies yearly, it can
help in calculating number of rice bags actually delivered. The demand that generates every year
for the rice bags is equal to 450000. The number of bags can then be calculated by dividing,
annual demand with that of number of deliveries made by the supplies annually. It has been able
to give number of bags being delivered by the supplier in each delivery.
(c) Assessing economic Order Quantity (EOQ)
EOQ helps in calculating overall operational efficiency of the organization and assess how
much deliveries can ultimately be made by the suppliers. It helps in calculating production
10
⊘ This is a preview!⊘
Do you want full access?
Subscribe today to unlock all pages.
Trusted by 1+ million students worldwide
1 out of 17
Related Documents


Your All-in-One AI-Powered Toolkit for Academic Success.
+13062052269
info@desklib.com
Available 24*7 on WhatsApp / Email
![[object Object]](/_next/static/media/star-bottom.7253800d.svg)
Unlock your academic potential
Copyright © 2020–2026 A2Z Services. All Rights Reserved. Developed and managed by ZUCOL.