University Statistics Assignment: Data Types, Sampling, and Analysis
VerifiedAdded on 2022/08/17
|11
|1028
|30
Homework Assignment
AI Summary
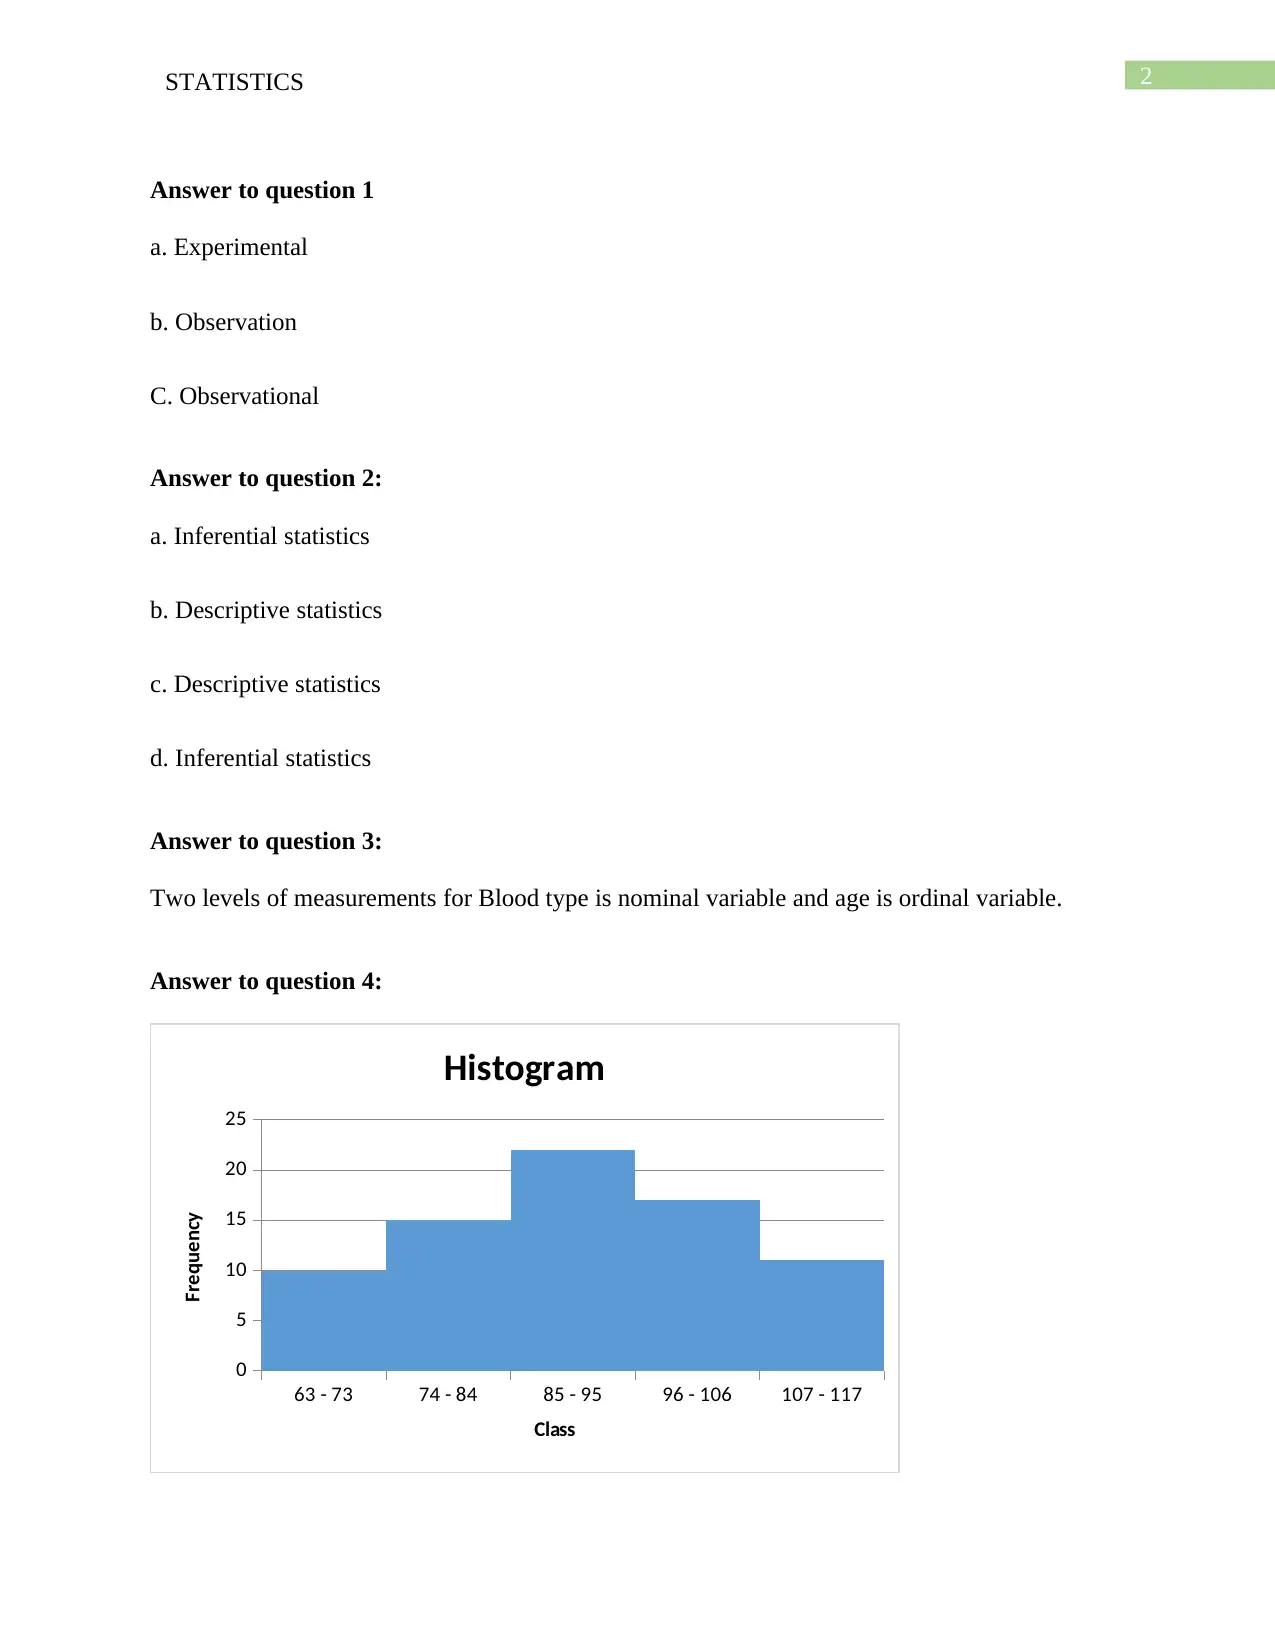
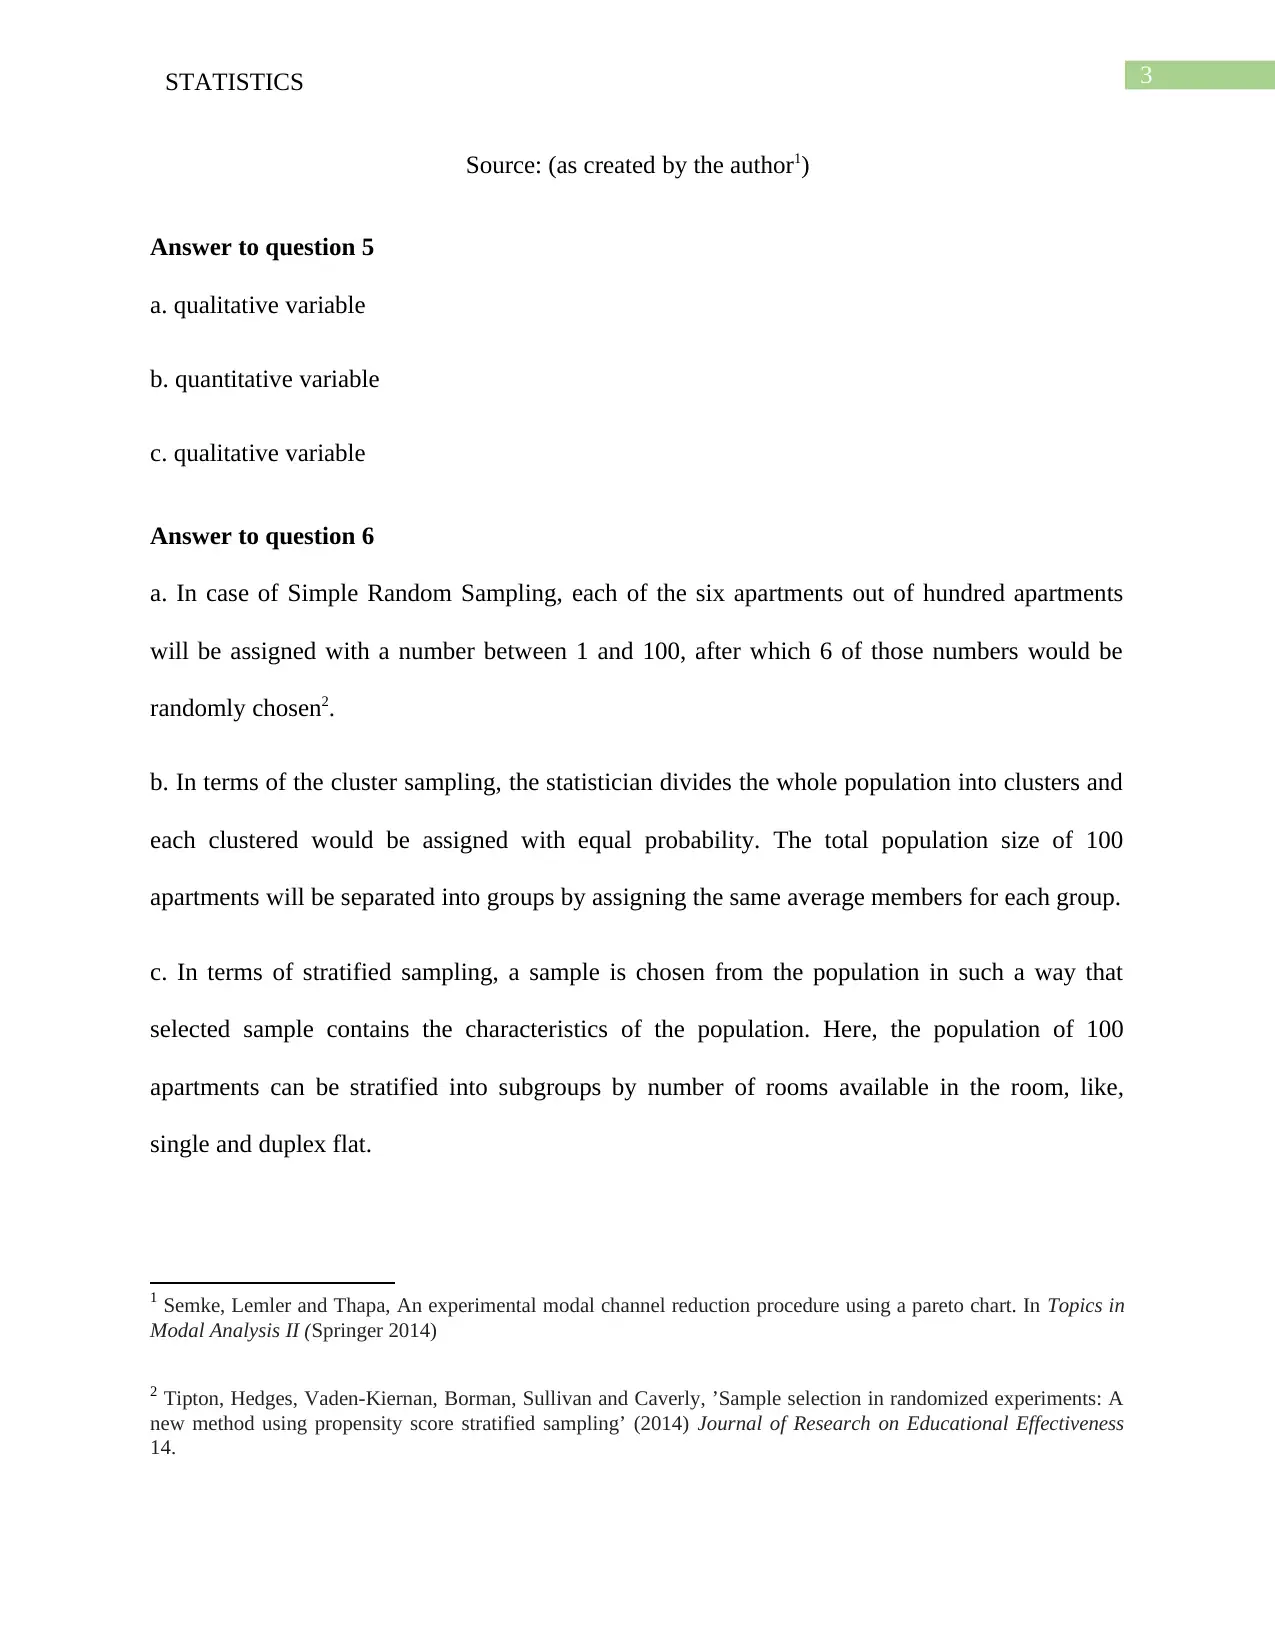
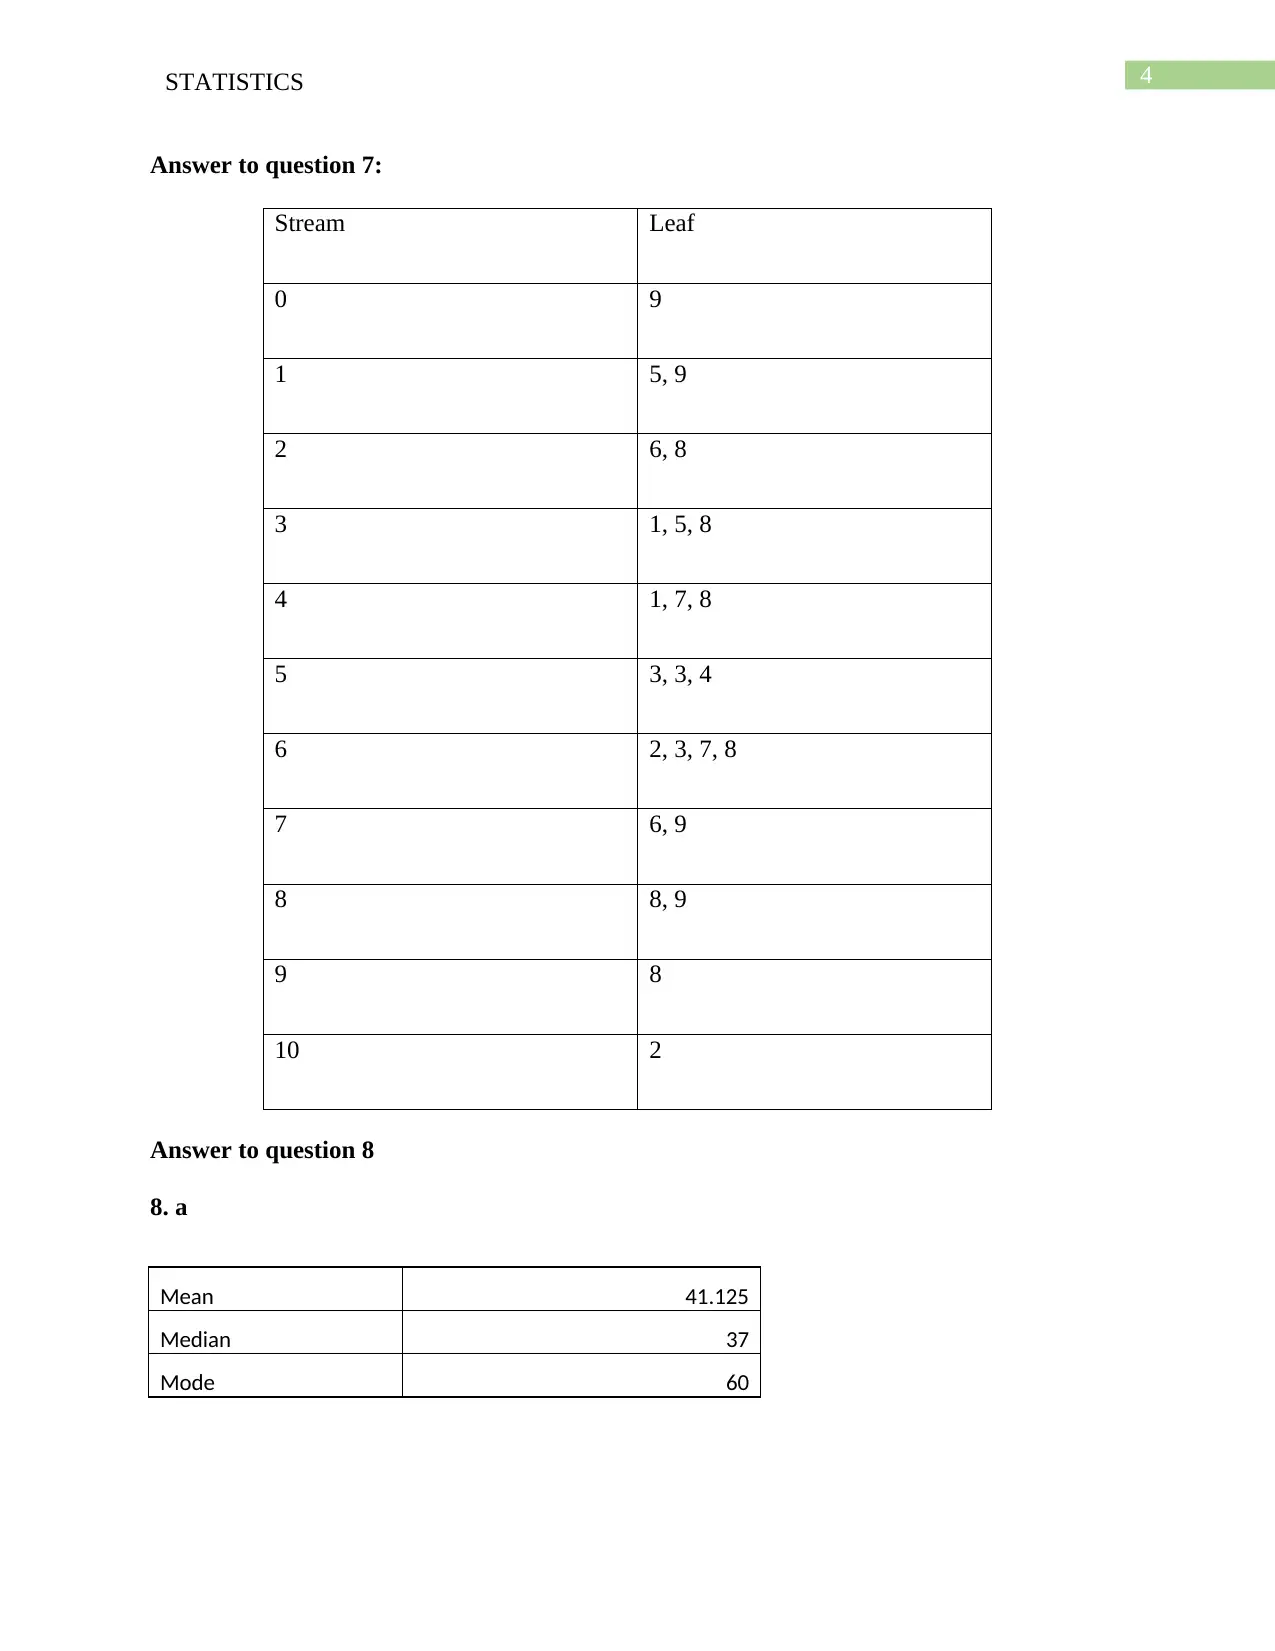
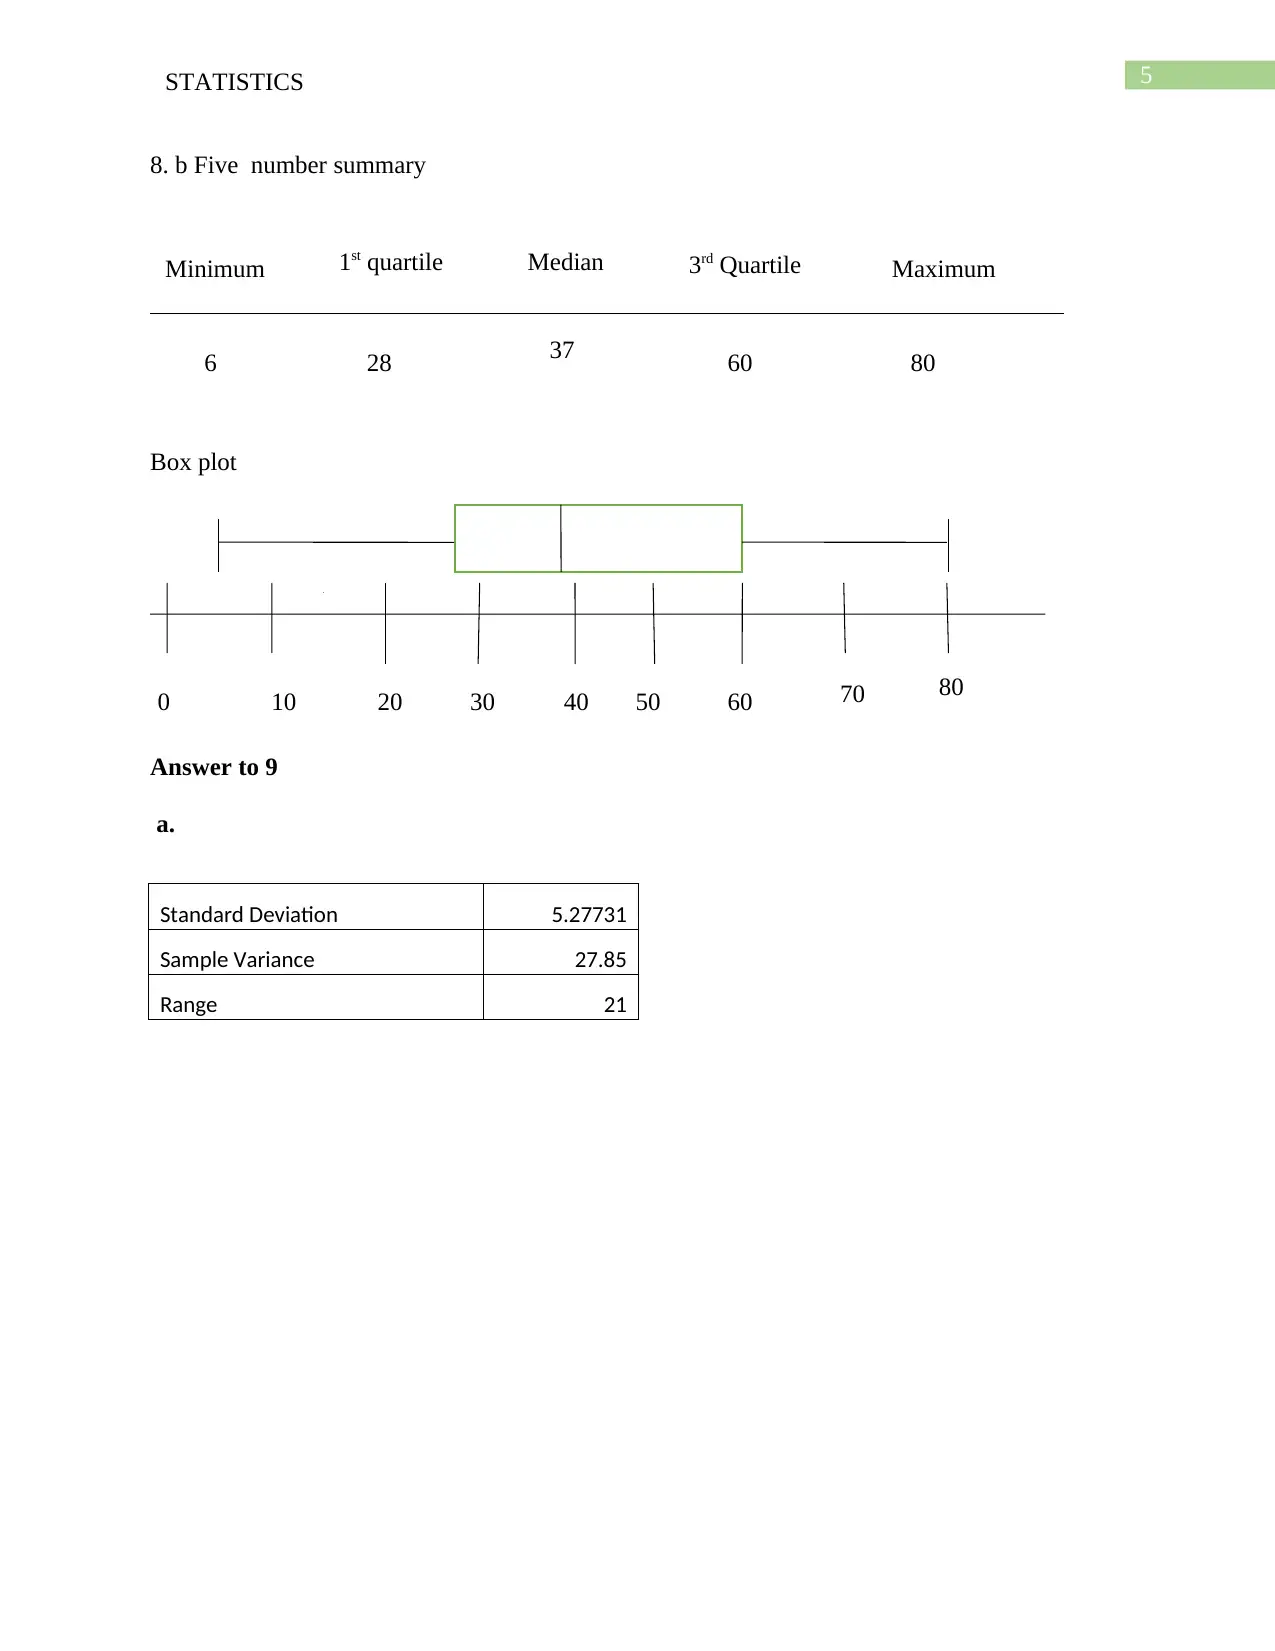
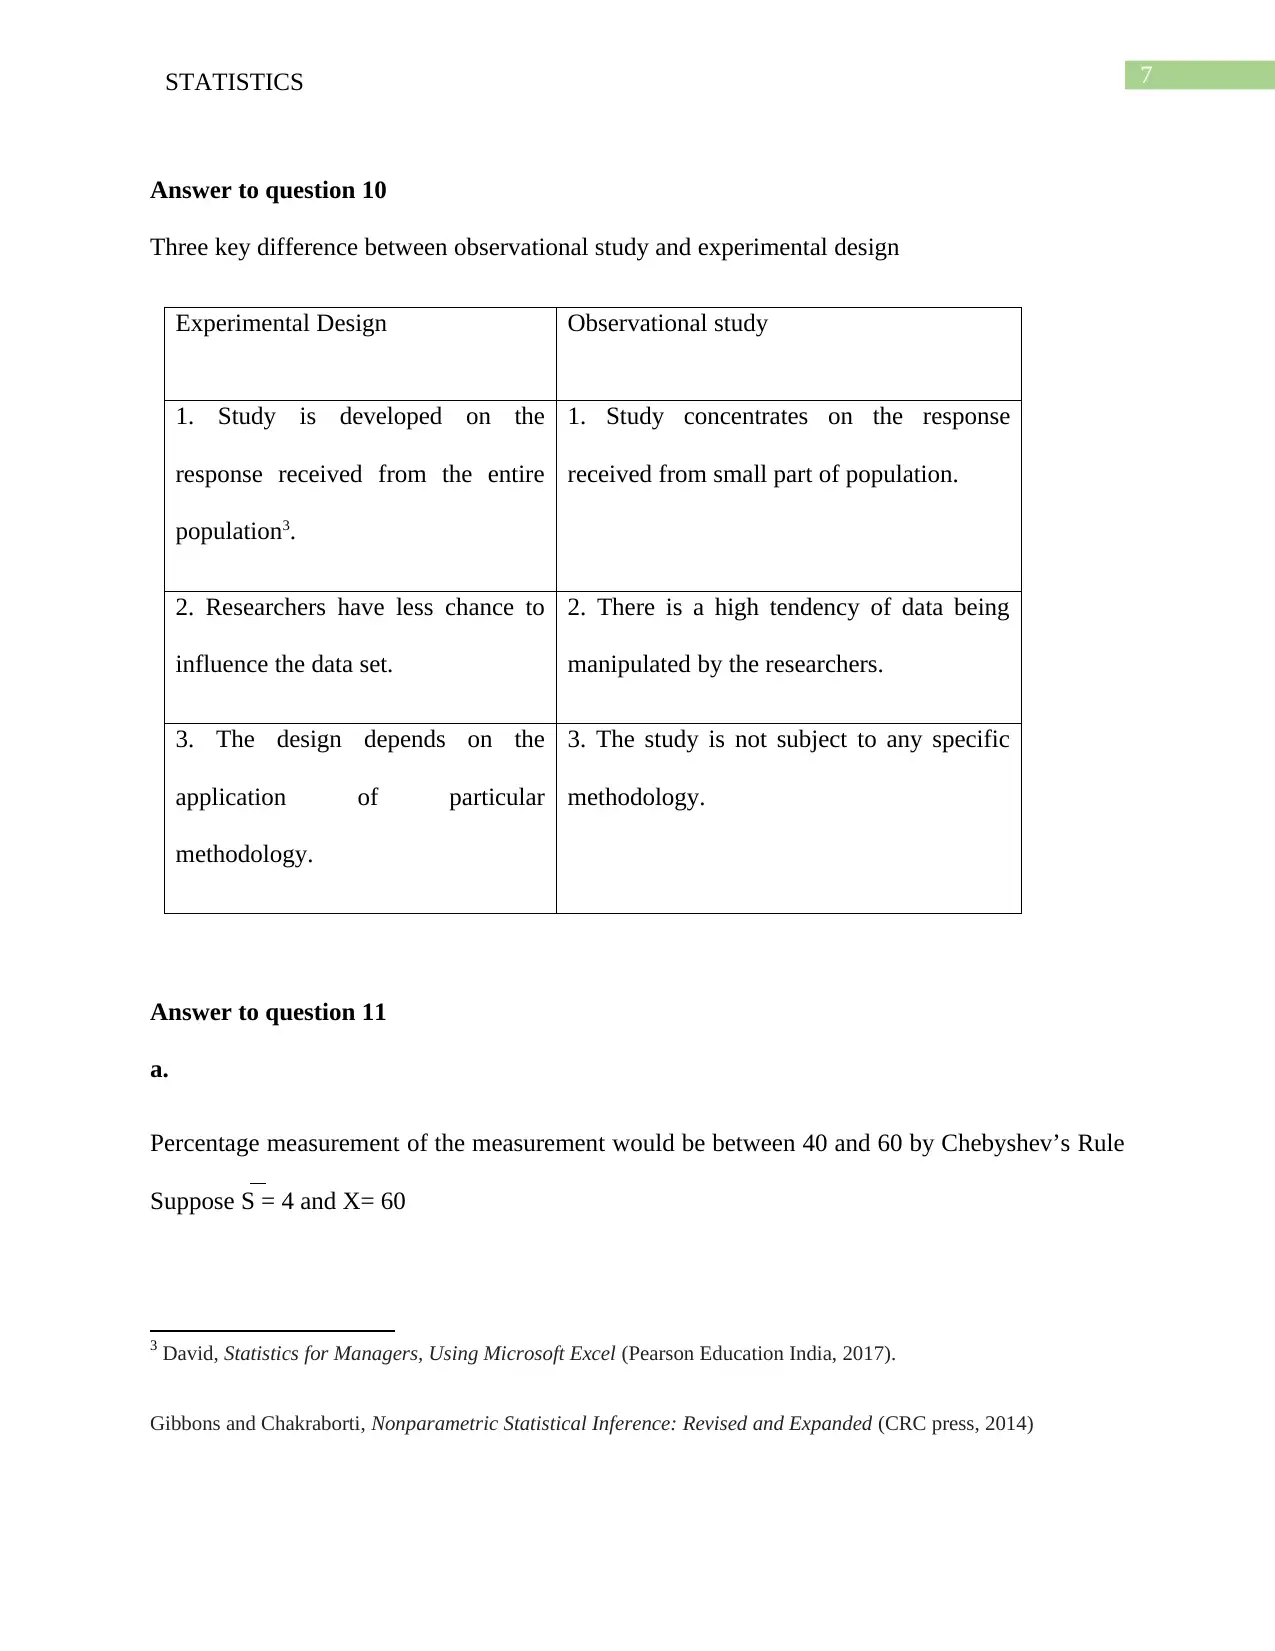
This statistics assignment provides solutions to various problems covering key statistical concepts. The assignment addresses topics including experimental versus observational studies, descriptive and inferential statistics, data types (nominal, ordinal, quantitative, and qualitative), sampling methods (simple random, cluster, and stratified), and data representation (stem-and-leaf plots, box plots, and Pareto charts). It also includes calculations for measures of central tendency (mean, median, mode), dispersion (standard deviation, variance, range), and application of Chebyshev's and Empirical rules. Furthermore, the assignment differentiates between observational studies and experimental designs and provides a bibliography of relevant statistical resources. This assignment is contributed by a student to be published on the website Desklib. Desklib is a platform which provides all the necessary AI based study tools for students.
1 out of 11
Related Documents


Your All-in-One AI-Powered Toolkit for Academic Success.
+13062052269
info@desklib.com
Available 24*7 on WhatsApp / Email
![[object Object]](/_next/static/media/star-bottom.7253800d.svg)
Copyright © 2020–2026 A2Z Services. All Rights Reserved. Developed and managed by ZUCOL.