Statistics Assignment: Binomial, Poisson, and Normal Distributions

Verified

Added on  2022/09/08

|5
|369
|21
Homework Assignment
AI Summary
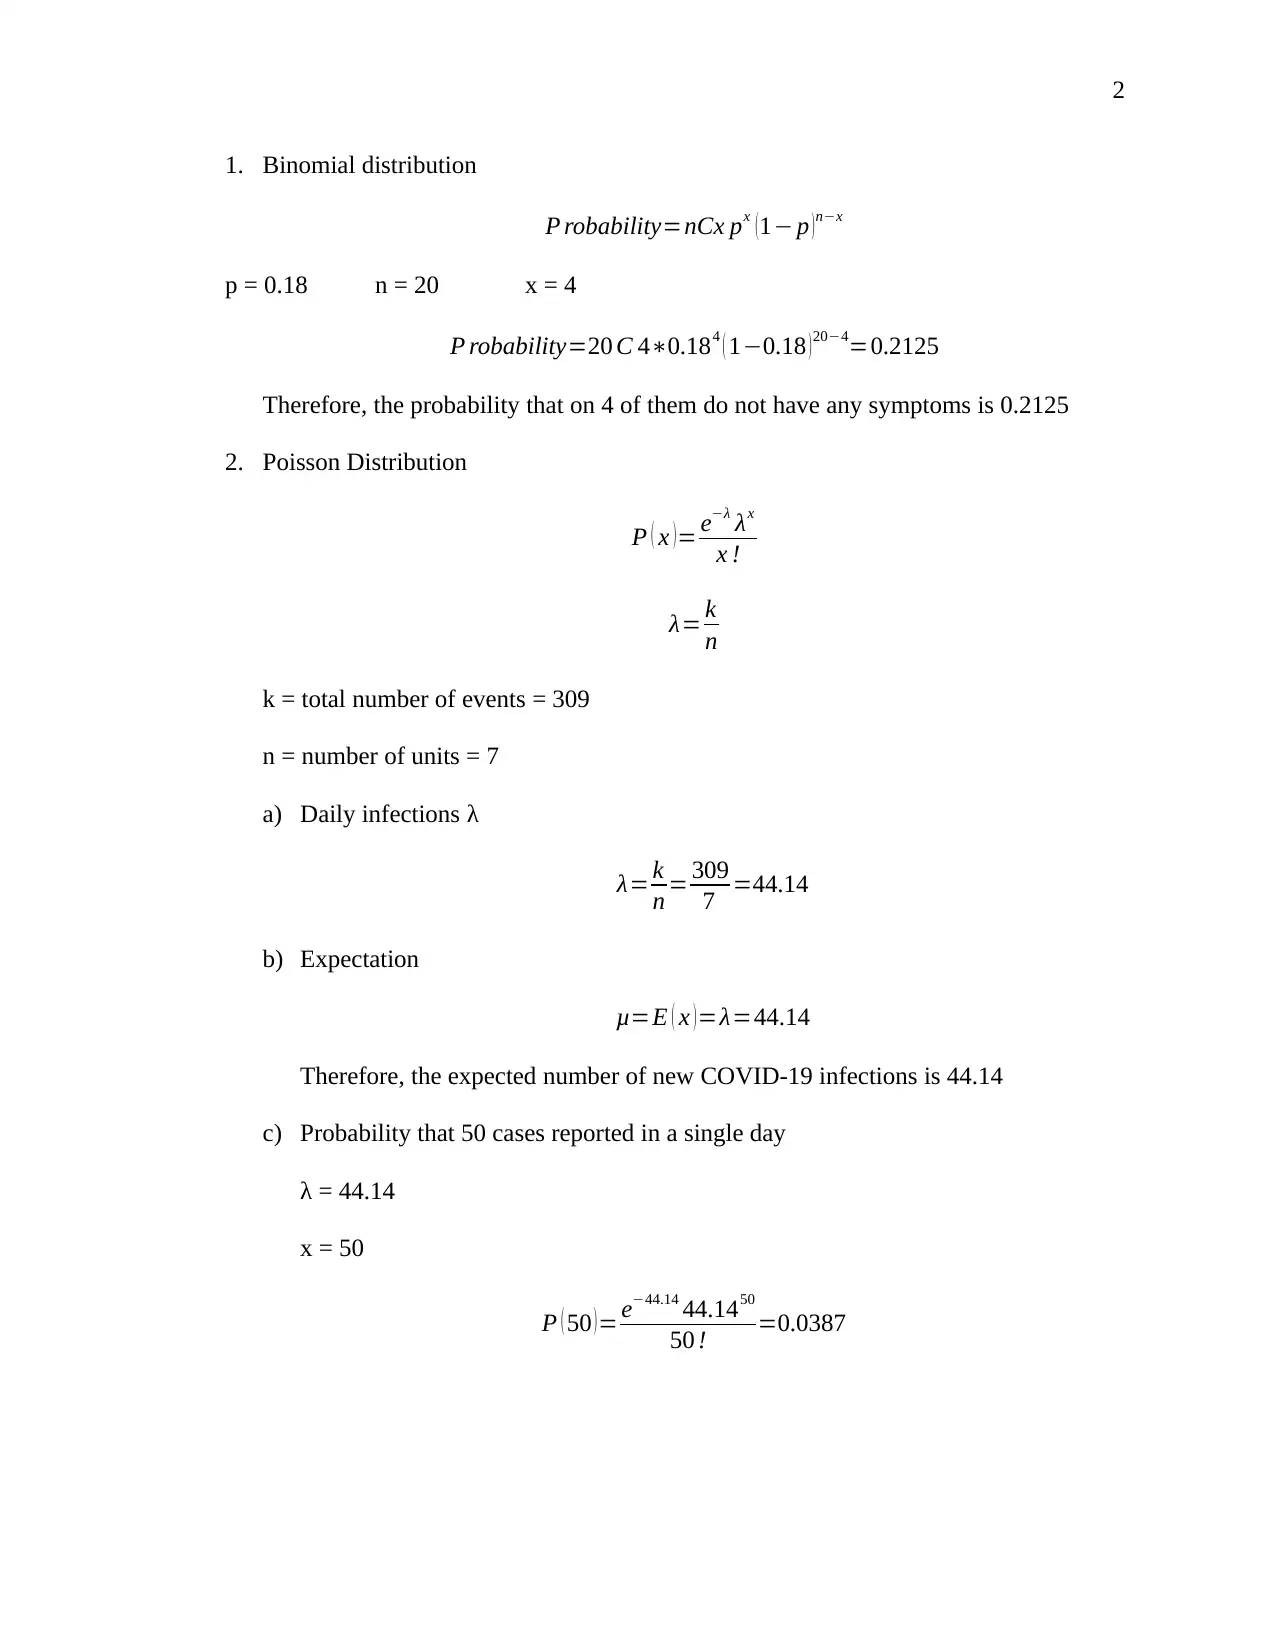
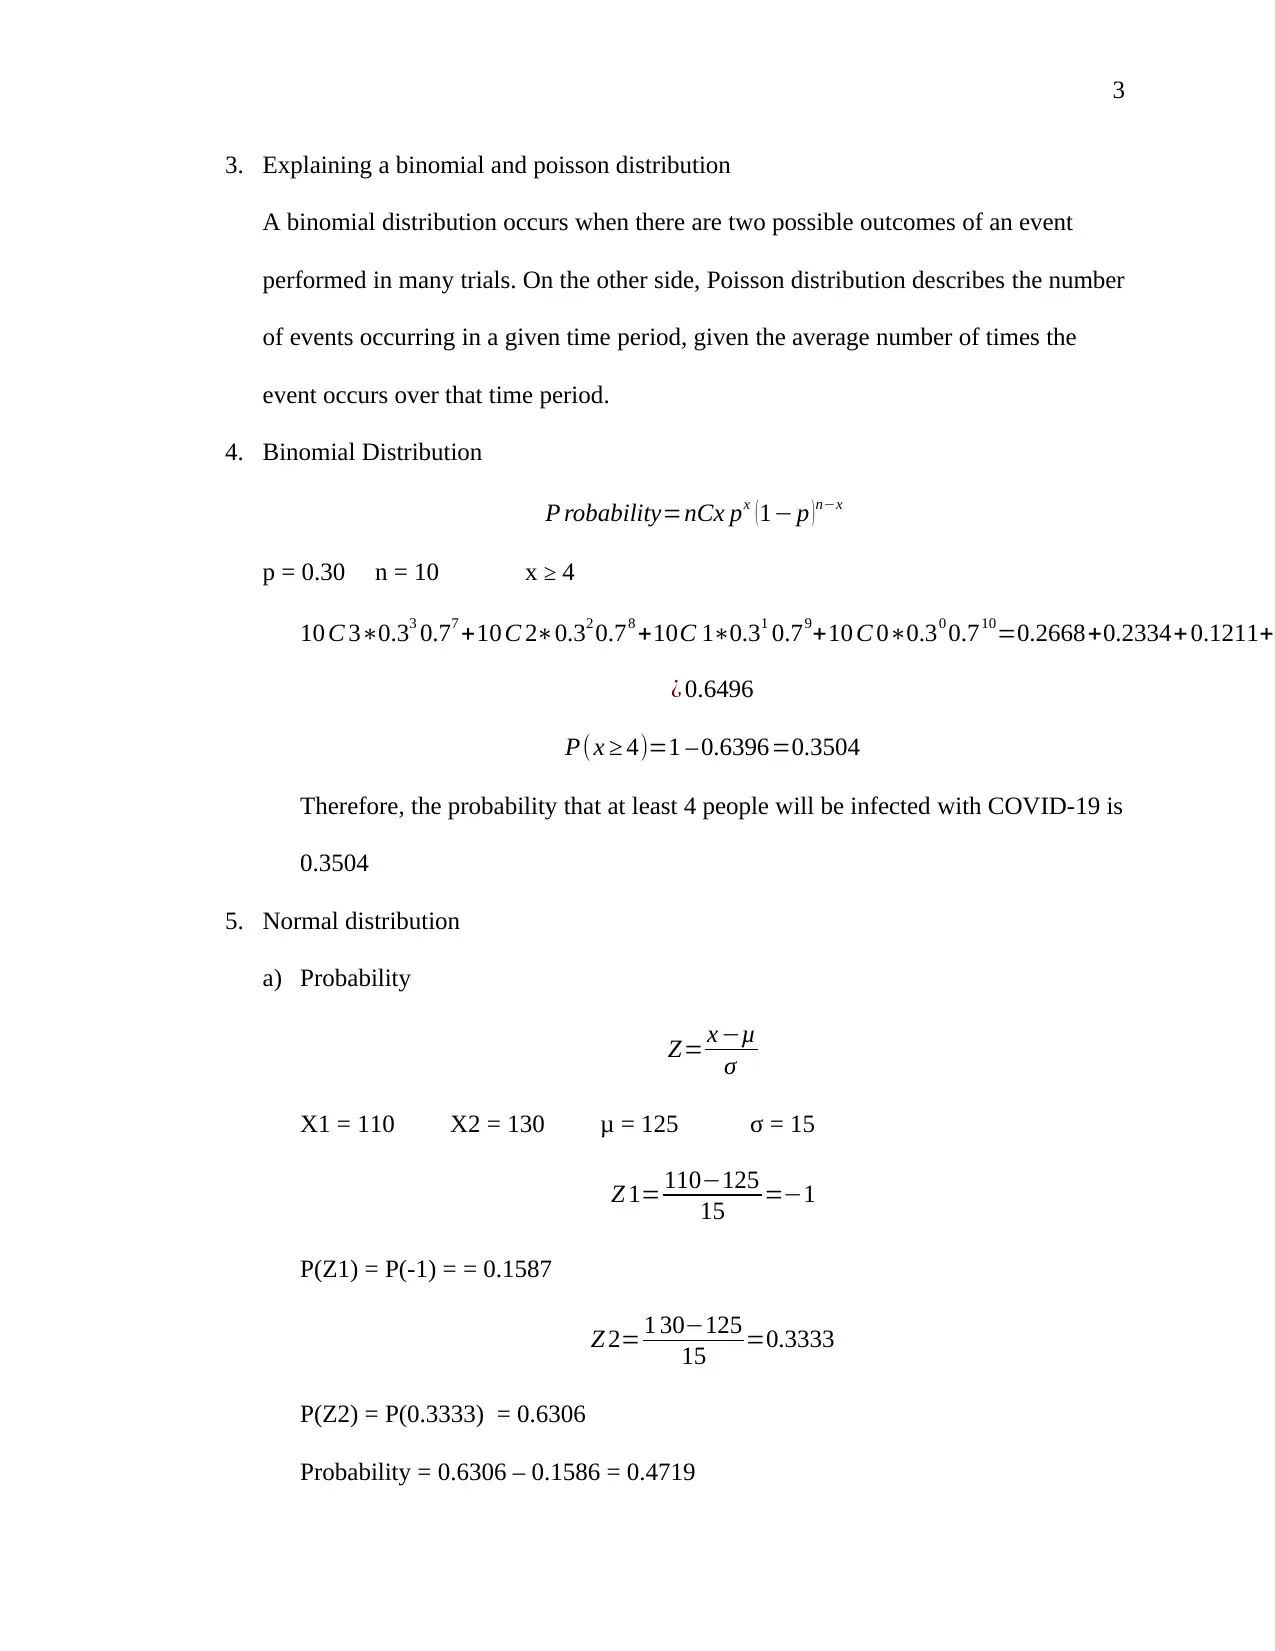
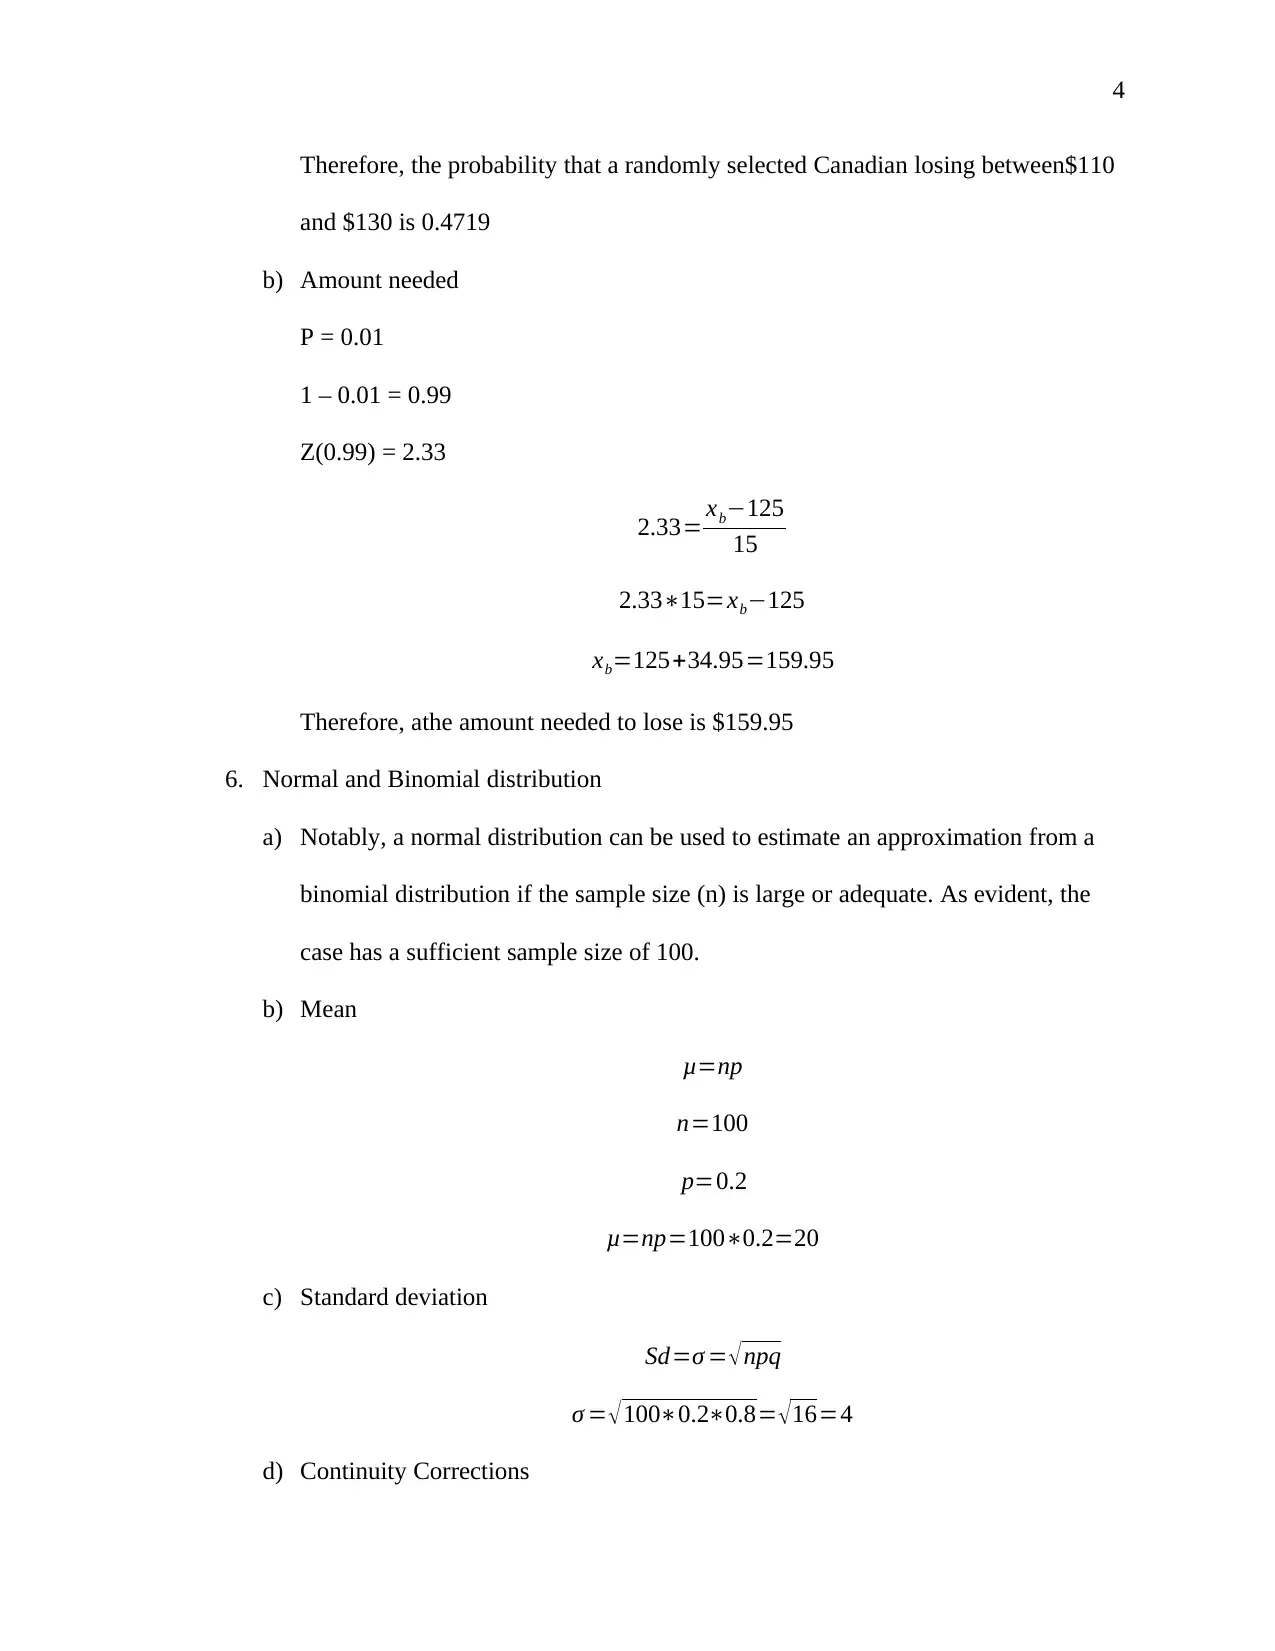
This assignment solution addresses problems related to binomial, Poisson, and normal distributions within a statistical context. It begins with a binomial distribution problem calculating the probability of asymptomatic COVID-19 cases in a sample. The solution then moves on to a Poisson distribution, calculating the daily rate and expected number of new COVID-19 infections and the probability of a specific number of cases. The assignment also explores normal distribution problems, including calculating probabilities within a range and determining a value based on a percentile. Finally, the solution demonstrates the approximation of a binomial distribution using a normal distribution, along with relevant calculations and interpretations. This document is a valuable resource for students seeking to understand and solve statistical problems involving these key distributions.
Document Page
1
Assignment
Name:
Institution:
tabler-icon-diamond-filled.svg

Paraphrase This Document

Need a fresh take? Get an instant paraphrase of this document with our AI Paraphraser
Document Page
2
1. Binomial distribution
P robability=nCx px ( 1 p ) nx
p = 0.18 n = 20 x = 4
P robability=20 C 40.184 ( 10.18 )204=0.2125
Therefore, the probability that on 4 of them do not have any symptoms is 0.2125
2. Poisson Distribution
P ( x )= eλ λx
x !
λ= k
n
k = total number of events = 309
n = number of units = 7
a) Daily infections λ
λ= k
n = 309
7 =44.14
b) Expectation
μ=E ( x ) =λ=44.14
Therefore, the expected number of new COVID-19 infections is 44.14
c) Probability that 50 cases reported in a single day
λ = 44.14
x = 50
P ( 50 )= e44.14 44.1450
50 ! =0.0387
Document Page
3
3. Explaining a binomial and poisson distribution
A binomial distribution occurs when there are two possible outcomes of an event
performed in many trials. On the other side, Poisson distribution describes the number
of events occurring in a given time period, given the average number of times the
event occurs over that time period.
4. Binomial Distribution
P robability=nCx px ( 1 p ) nx
p = 0.30 n = 10 x 4
10 C 30.33 0.77 +10 C 20.32 0.78 +10C 10.31 0.79+10 C 00.30 0.710=0.2668+0.2334+ 0.1211+
¿ 0.6496
P( x 4)=1 0.6396=0.3504
Therefore, the probability that at least 4 people will be infected with COVID-19 is
0.3504
5. Normal distribution
a) Probability
Z= x μ
σ
X1 = 110 X2 = 130 μ = 125 σ = 15
Z 1= 110125
15 =1
P(Z1) = P(-1) = = 0.1587
Z 2= 1 30125
15 =0.3333
P(Z2) = P(0.3333) = 0.6306
Probability = 0.6306 – 0.1586 = 0.4719
Document Page
4
Therefore, the probability that a randomly selected Canadian losing between$110
and $130 is 0.4719
b) Amount needed
P = 0.01
1 – 0.01 = 0.99
Z(0.99) = 2.33
2.33= xb125
15
2.3315=xb125
xb=125+34.95=159.95
Therefore, athe amount needed to lose is $159.95
6. Normal and Binomial distribution
a) Notably, a normal distribution can be used to estimate an approximation from a
binomial distribution if the sample size (n) is large or adequate. As evident, the
case has a sufficient sample size of 100.
b) Mean
μ=np
n=100
p=0.2
μ=np=1000.2=20
c) Standard deviation
Sd=σ = npq
σ = 1000.20.8= 16=4
d) Continuity Corrections
tabler-icon-diamond-filled.svg

Paraphrase This Document

Need a fresh take? Get an instant paraphrase of this document with our AI Paraphraser
Document Page
5
P( X=n)use P(n 0.5< X <n+0.5)
X 1=10
Cc=10 0.5=9.5
X 2=30
Cc=30+0.5=30.5
e) Z score
Z= x μ
σ
X1 = 9.5 X2 = 30.5 μ = 20 σ = 4
z1= 9.520
4 =2.625
z2= 30.520
4 =2.625
f) Probabilities in Z score
P(Z1) = P(-2.625) = = 0.0043
P(Z2) = P(2.625) = 0.9957
g) Probability
Probability = 0.9957 – 0.0043 = 0.9914
Therefore, the probability that test results in between 10 and 30 false positives is
0.9914.
chevron_up_icon
1 out of 5
circle_padding
hide_on_mobile
zoom_out_icon
[object Object]