Statistics for Management: Analysis of Earnings and Turnover Report

Verified

Added on  2020/06/04

|21
|4367
|114
Report
AI Summary
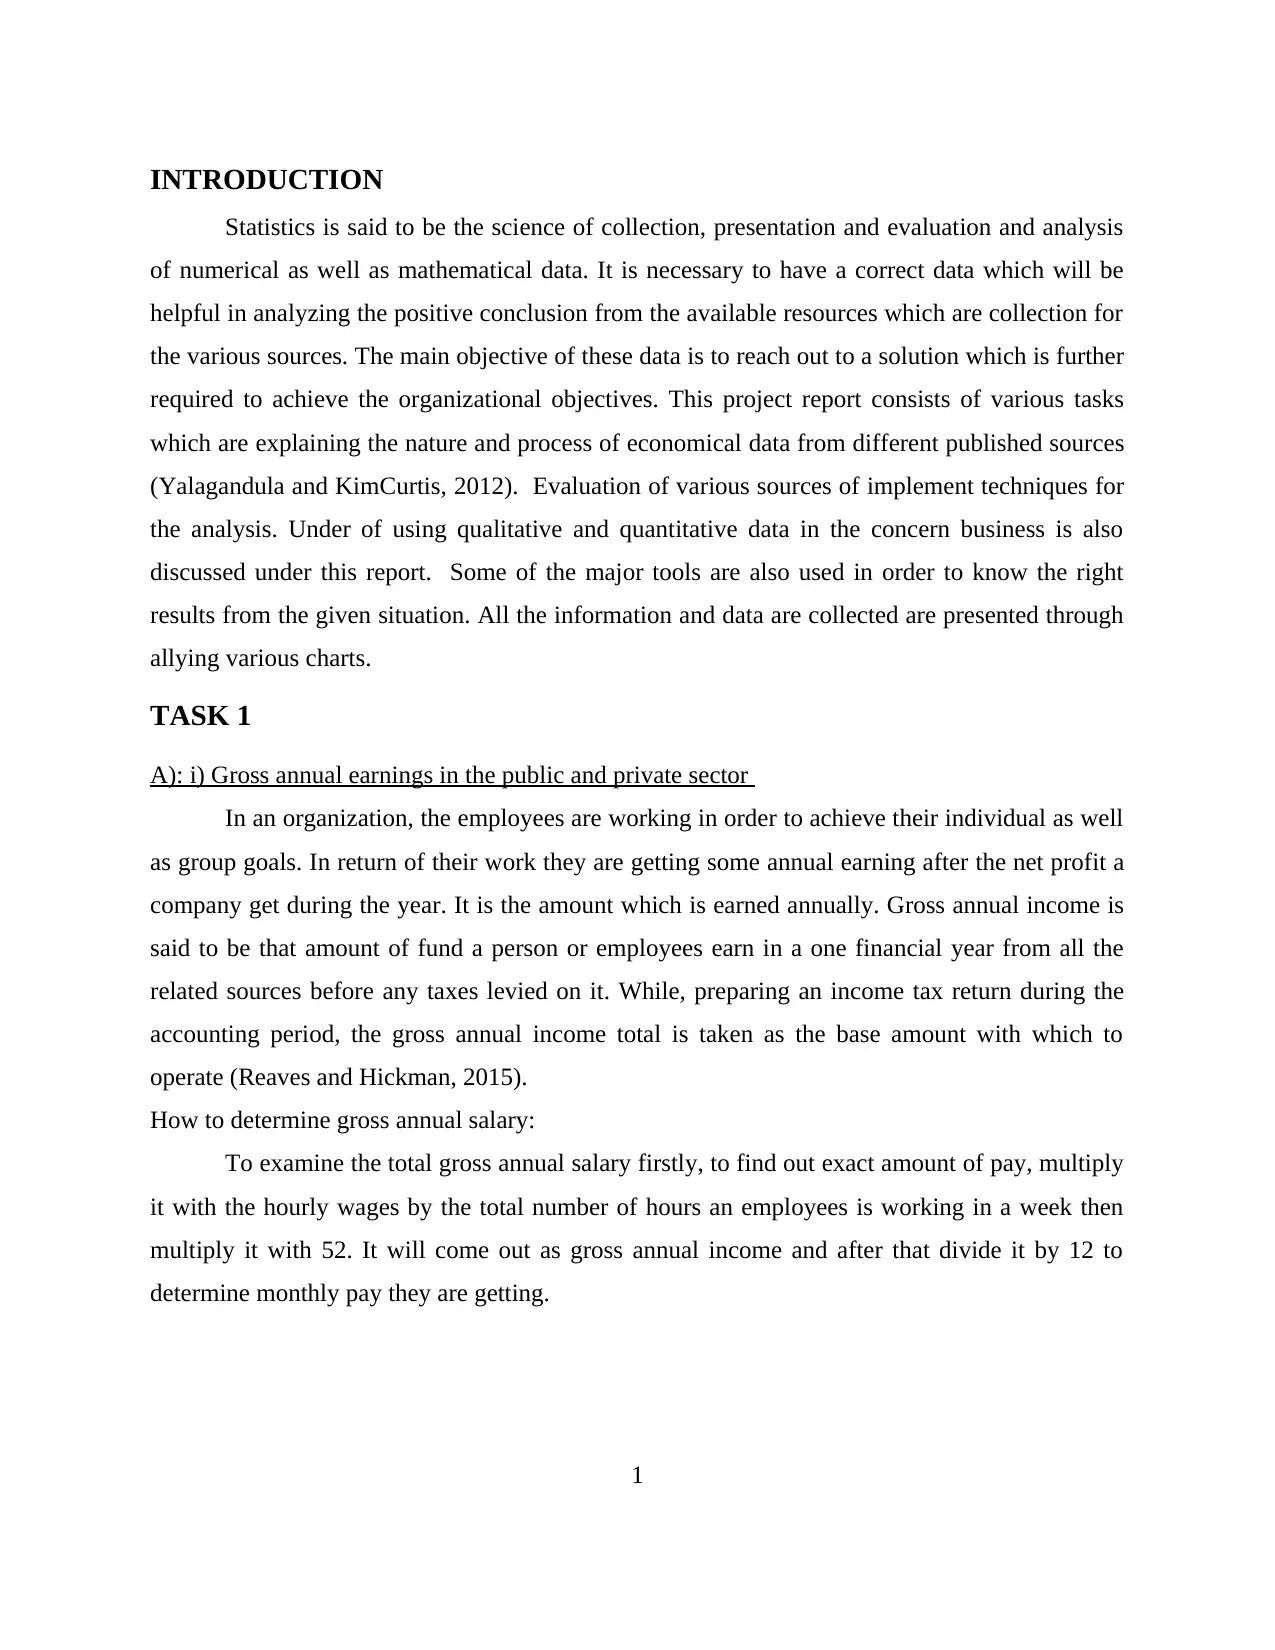
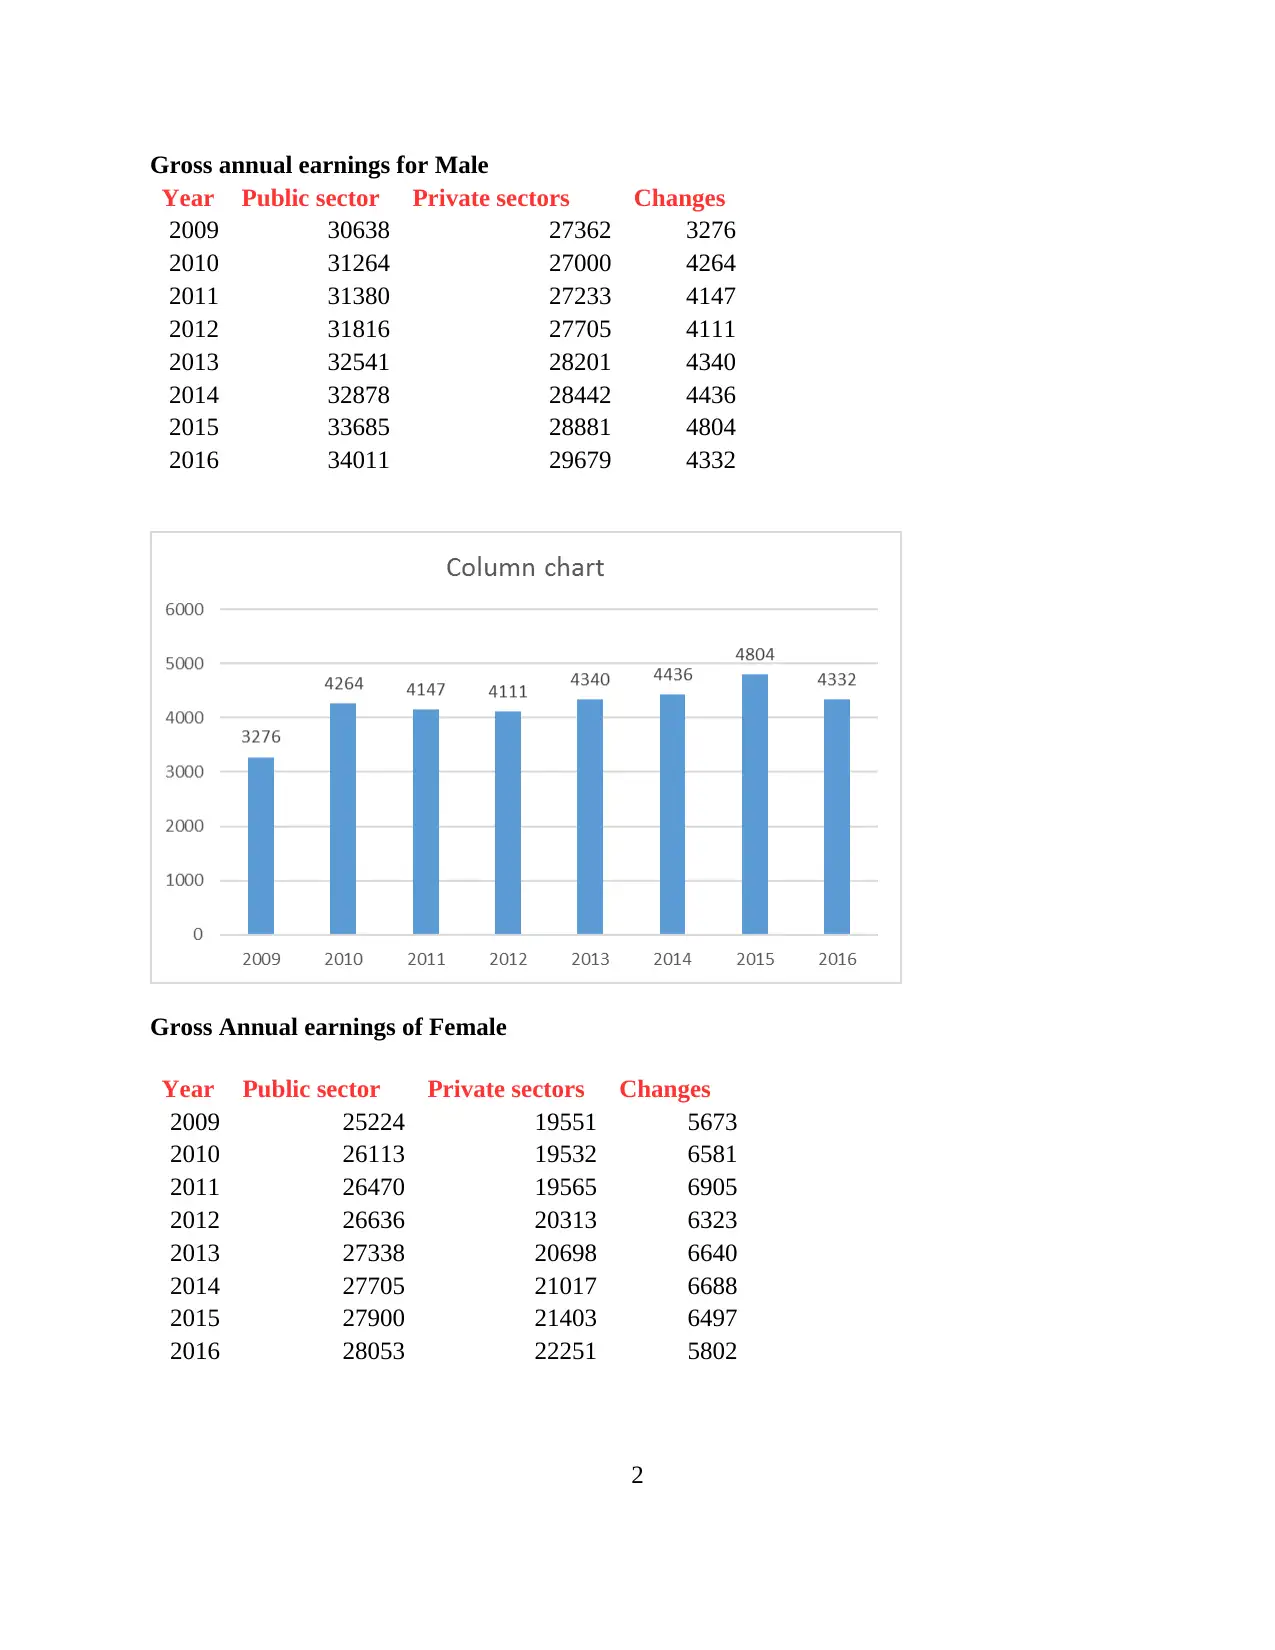
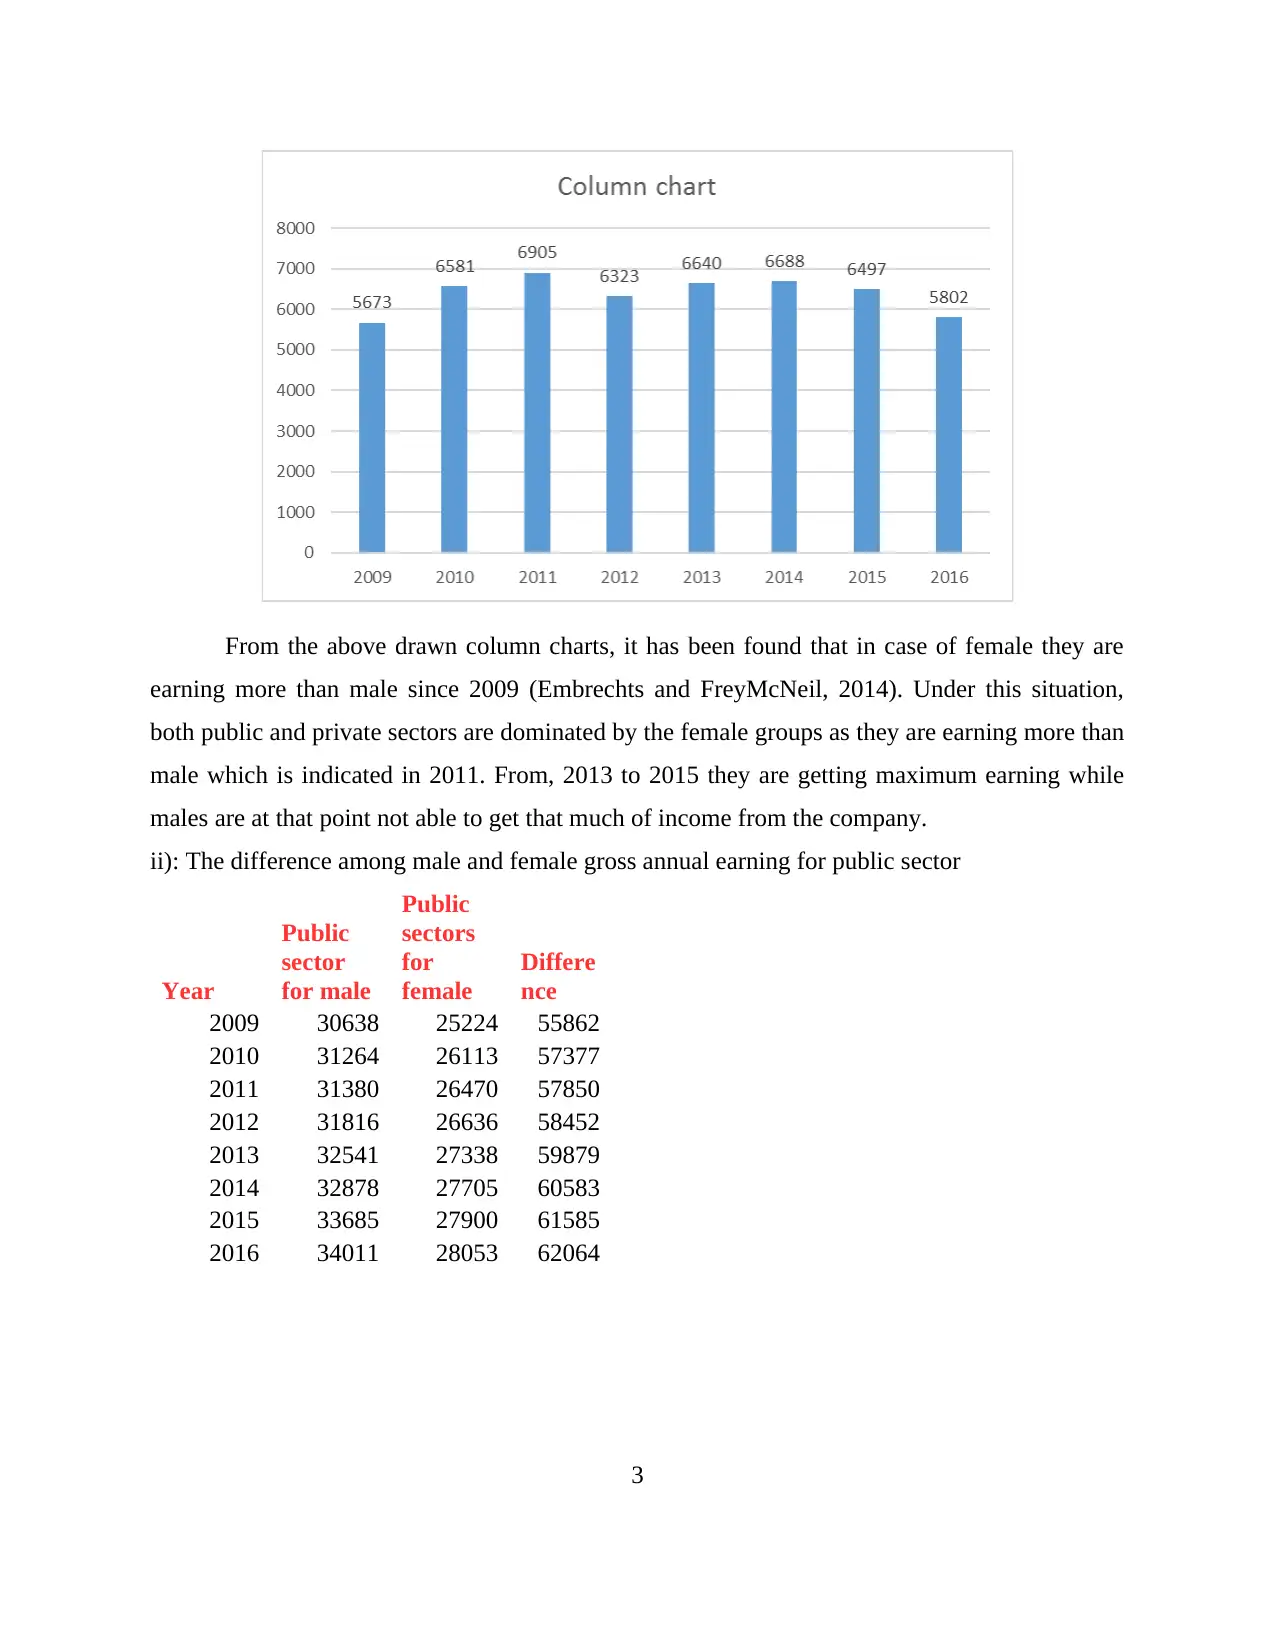
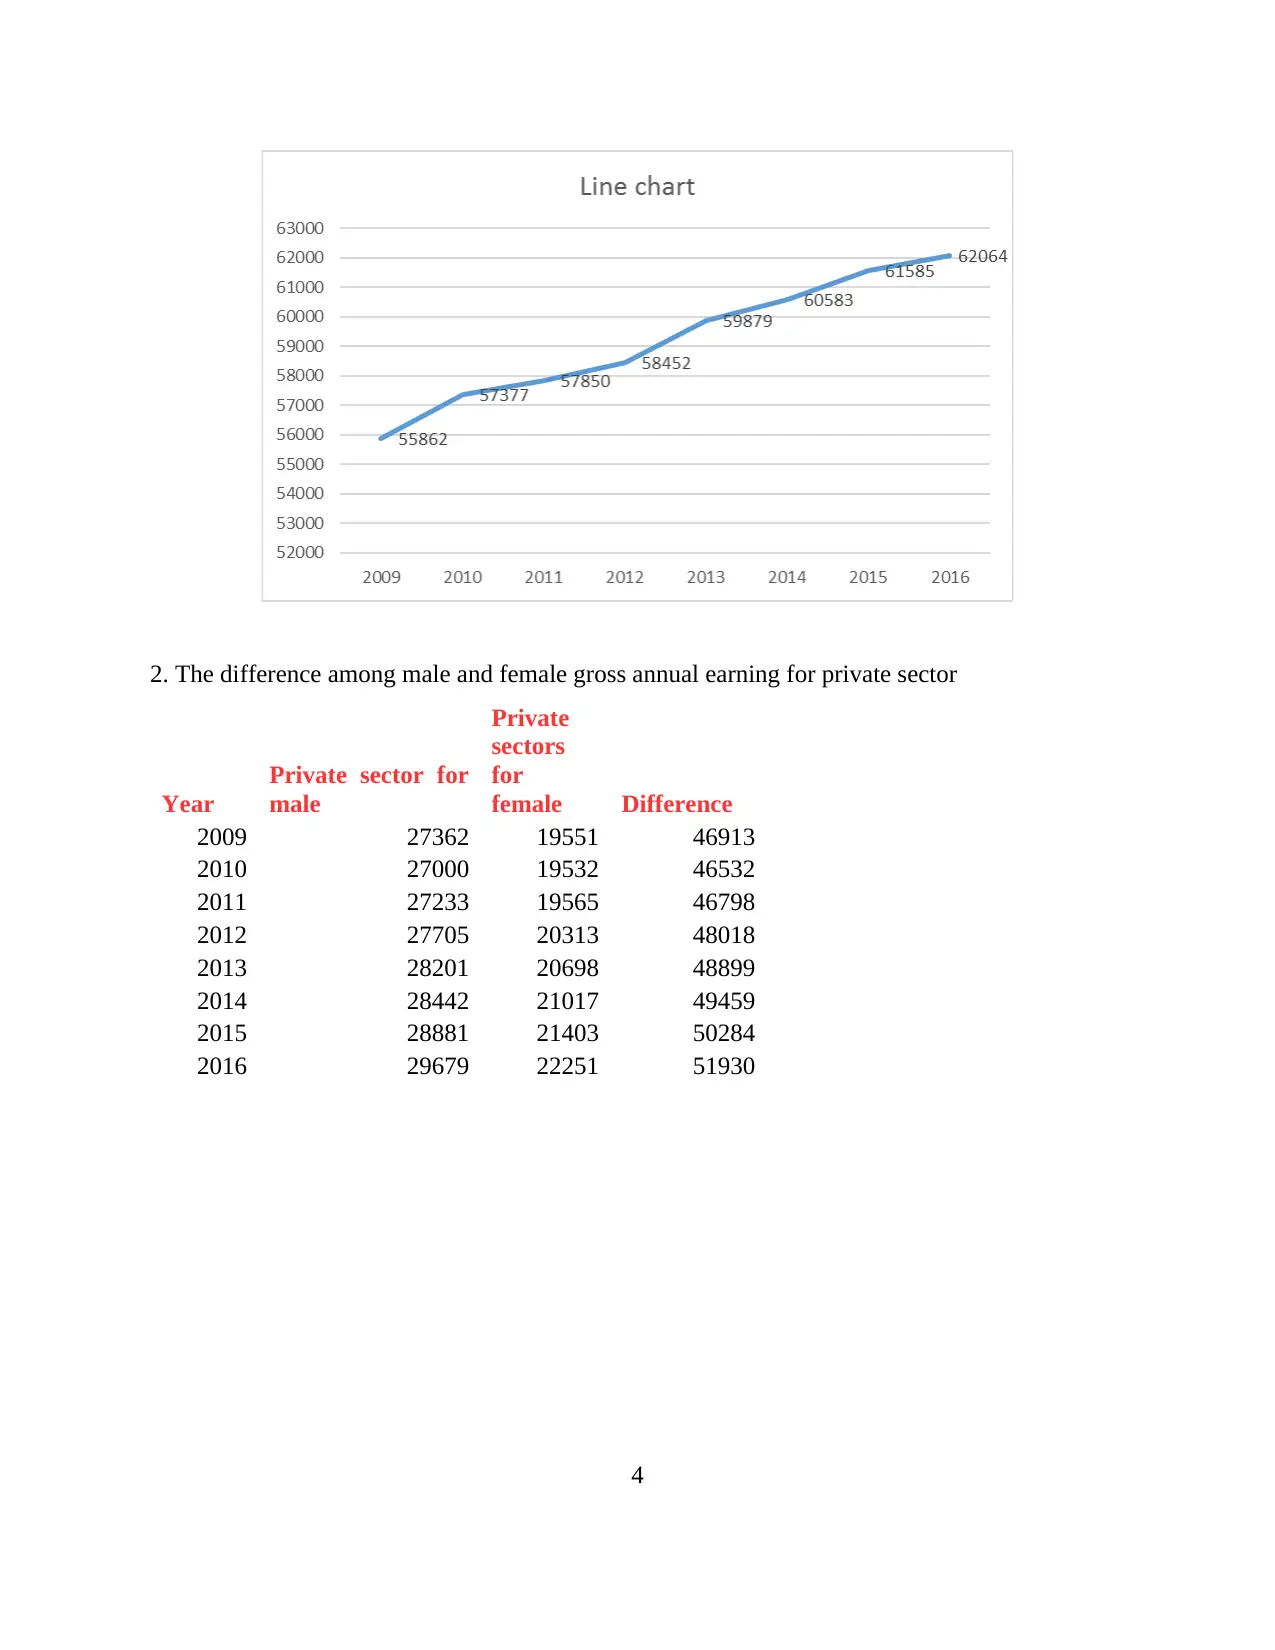
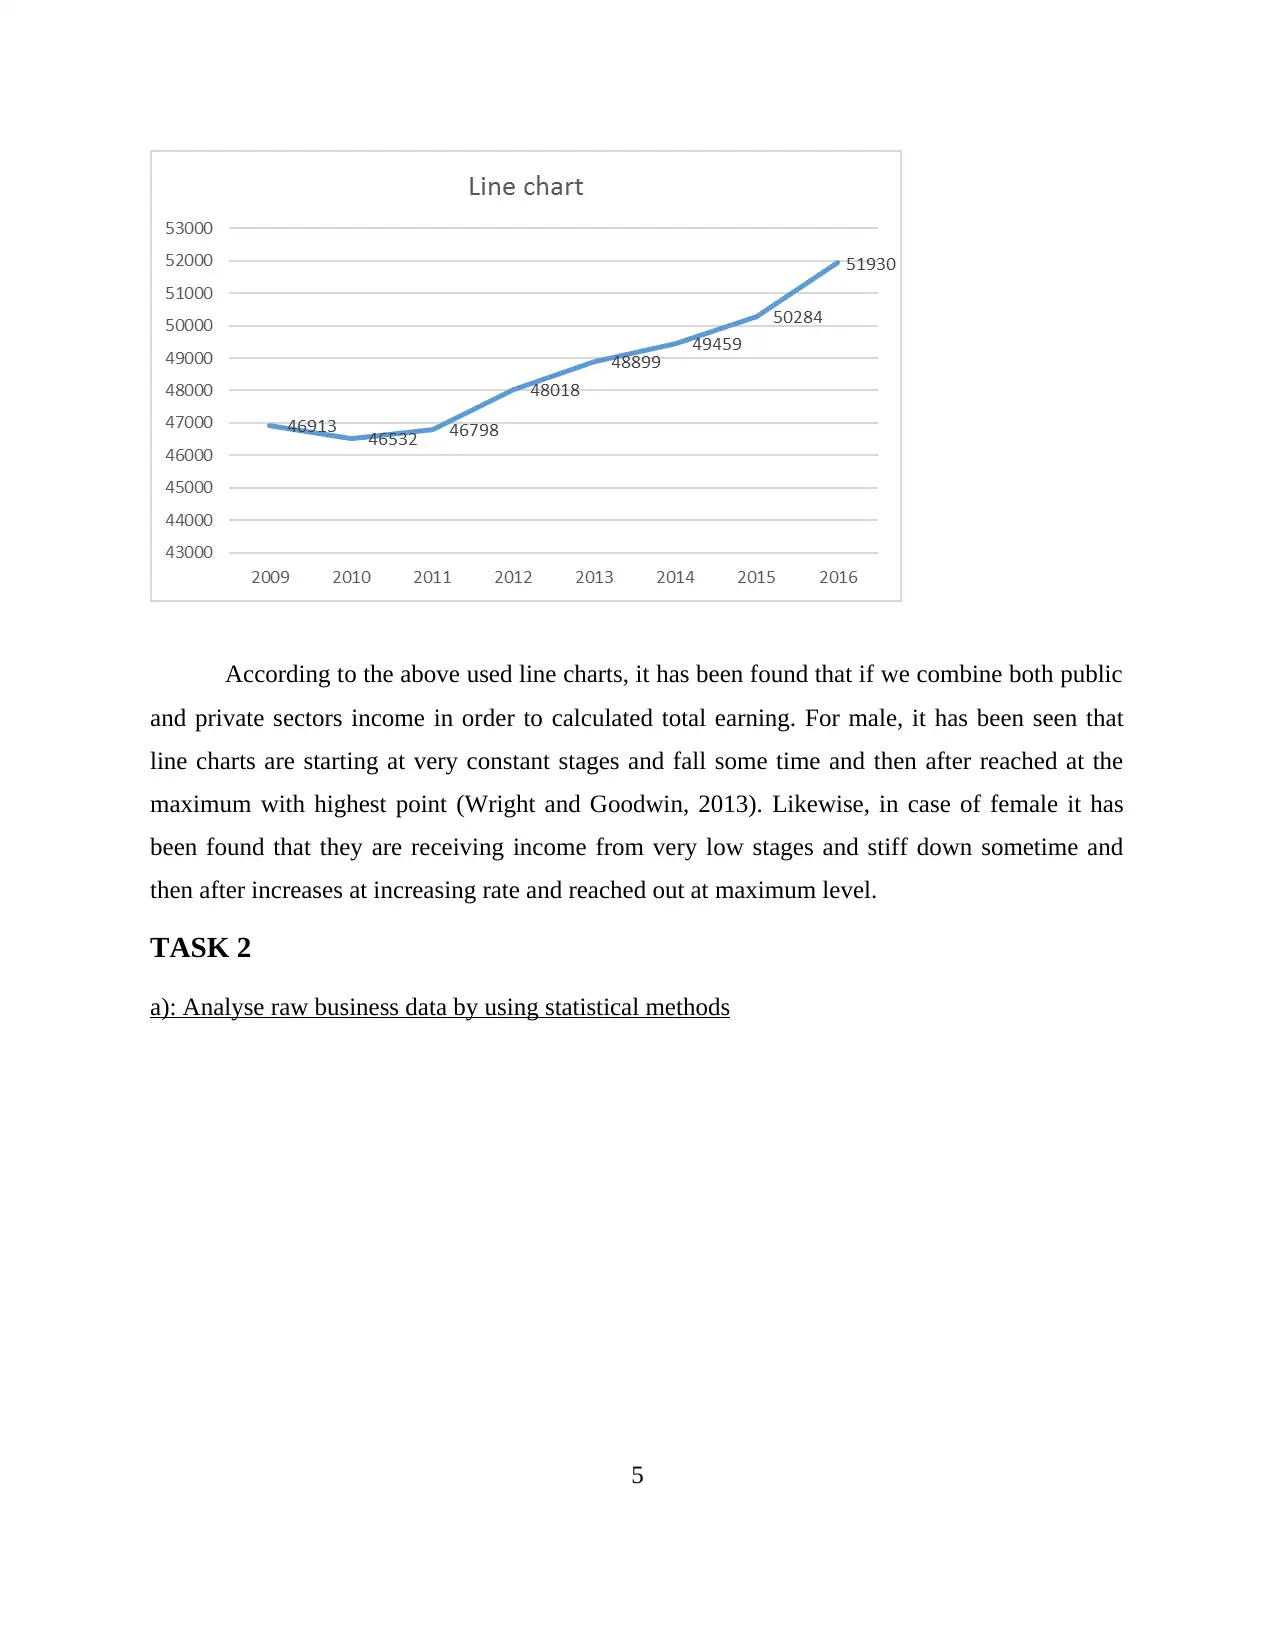
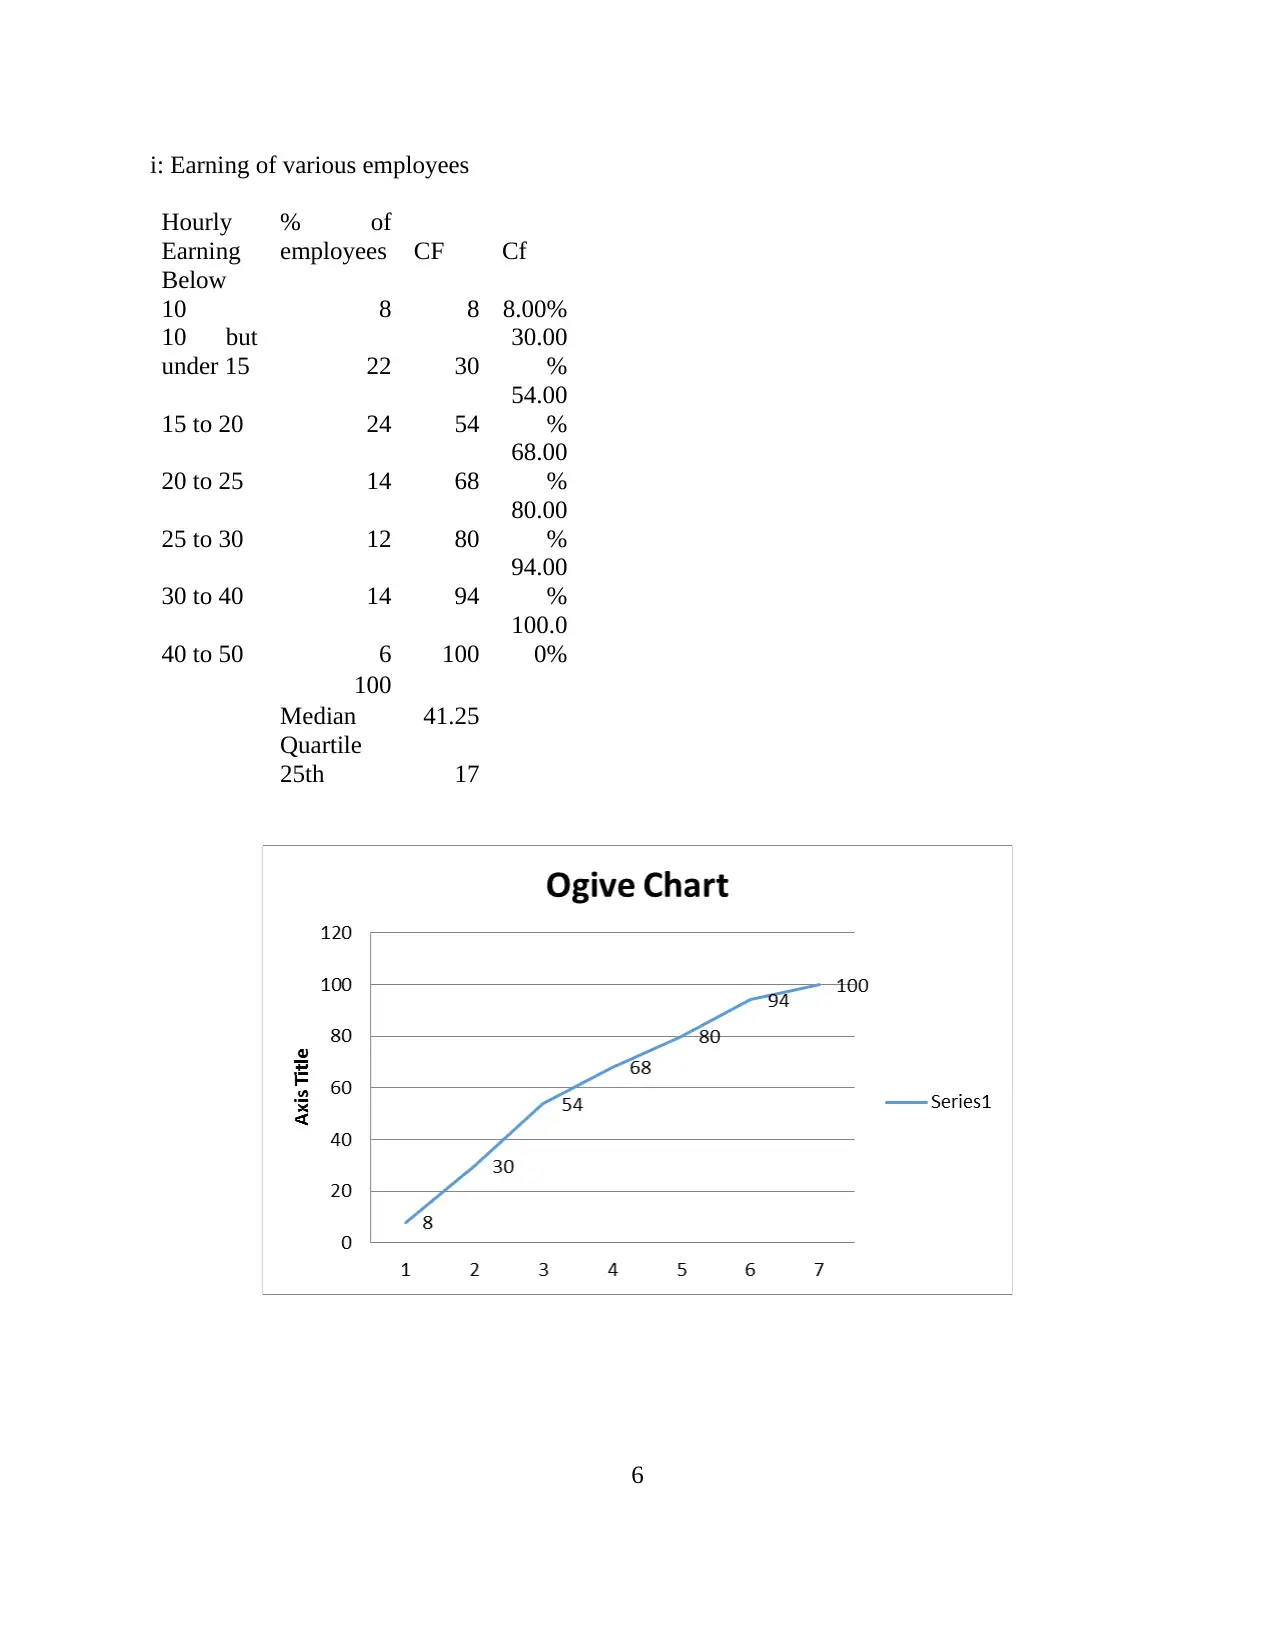
This report provides a comprehensive statistical analysis of various business data. It begins with an introduction to statistics and its importance in data collection, presentation, and evaluation. The report includes several tasks, such as analyzing gross annual earnings in the public and private sectors, calculating differences between male and female earnings, and analyzing raw business data using statistical methods. The analysis involves calculating medians, quartiles, standard deviations, and means to interpret employee earnings and compare results. The report also includes scattered diagrams to analyze the relationship between outlet size and turnover, calculates a correlation coefficient, and discusses the concept of statistical validity. Charts and tables are used to effectively communicate the findings, providing a detailed understanding of the data and its implications.
Document Page
Statistics for Management
tabler-icon-diamond-filled.svg

Paraphrase This Document

Need a fresh take? Get an instant paraphrase of this document with our AI Paraphraser
Document Page
Table of Contents
INTRODUCTION...........................................................................................................................1
TASK 1............................................................................................................................................1
A): i) Gross annual earnings in the public and private sector ...............................................1
TASK 2............................................................................................................................................5
a): Analyse raw business data by using statistical methods...................................................5
TASK 3..........................................................................................................................................12
Statistical methods used in business planning......................................................................12
TASK 4..........................................................................................................................................14
Communicating finding though using charts and tables......................................................14
CONCLUSION..............................................................................................................................18
REFERENCES..............................................................................................................................19
Document Page
INTRODUCTION
Statistics is said to be the science of collection, presentation and evaluation and analysis
of numerical as well as mathematical data. It is necessary to have a correct data which will be
helpful in analyzing the positive conclusion from the available resources which are collection for
the various sources. The main objective of these data is to reach out to a solution which is further
required to achieve the organizational objectives. This project report consists of various tasks
which are explaining the nature and process of economical data from different published sources
(Yalagandula and KimCurtis, 2012). Evaluation of various sources of implement techniques for
the analysis. Under of using qualitative and quantitative data in the concern business is also
discussed under this report. Some of the major tools are also used in order to know the right
results from the given situation. All the information and data are collected are presented through
allying various charts.
TASK 1
A): i) Gross annual earnings in the public and private sector
In an organization, the employees are working in order to achieve their individual as well
as group goals. In return of their work they are getting some annual earning after the net profit a
company get during the year. It is the amount which is earned annually. Gross annual income is
said to be that amount of fund a person or employees earn in a one financial year from all the
related sources before any taxes levied on it. While, preparing an income tax return during the
accounting period, the gross annual income total is taken as the base amount with which to
operate (Reaves and Hickman, 2015).
How to determine gross annual salary:
To examine the total gross annual salary firstly, to find out exact amount of pay, multiply
it with the hourly wages by the total number of hours an employees is working in a week then
multiply it with 52. It will come out as gross annual income and after that divide it by 12 to
determine monthly pay they are getting.
1
Document Page
Gross annual earnings for Male
Year Public sector Private sectors Changes
2009 30638 27362 3276
2010 31264 27000 4264
2011 31380 27233 4147
2012 31816 27705 4111
2013 32541 28201 4340
2014 32878 28442 4436
2015 33685 28881 4804
2016 34011 29679 4332
Gross Annual earnings of Female
Year Public sector Private sectors Changes
2009 25224 19551 5673
2010 26113 19532 6581
2011 26470 19565 6905
2012 26636 20313 6323
2013 27338 20698 6640
2014 27705 21017 6688
2015 27900 21403 6497
2016 28053 22251 5802
2
tabler-icon-diamond-filled.svg

Paraphrase This Document

Need a fresh take? Get an instant paraphrase of this document with our AI Paraphraser
Document Page
From the above drawn column charts, it has been found that in case of female they are
earning more than male since 2009 (Embrechts and FreyMcNeil, 2014). Under this situation,
both public and private sectors are dominated by the female groups as they are earning more than
male which is indicated in 2011. From, 2013 to 2015 they are getting maximum earning while
males are at that point not able to get that much of income from the company.
ii): The difference among male and female gross annual earning for public sector
Year
Public
sector
for male
Public
sectors
for
female
Differe
nce
2009 30638 25224 55862
2010 31264 26113 57377
2011 31380 26470 57850
2012 31816 26636 58452
2013 32541 27338 59879
2014 32878 27705 60583
2015 33685 27900 61585
2016 34011 28053 62064
3
Document Page
2. The difference among male and female gross annual earning for private sector
Year
Private sector for
male
Private
sectors
for
female Difference
2009 27362 19551 46913
2010 27000 19532 46532
2011 27233 19565 46798
2012 27705 20313 48018
2013 28201 20698 48899
2014 28442 21017 49459
2015 28881 21403 50284
2016 29679 22251 51930
4
Document Page
According to the above used line charts, it has been found that if we combine both public
and private sectors income in order to calculated total earning. For male, it has been seen that
line charts are starting at very constant stages and fall some time and then after reached at the
maximum with highest point (Wright and Goodwin, 2013). Likewise, in case of female it has
been found that they are receiving income from very low stages and stiff down sometime and
then after increases at increasing rate and reached out at maximum level.
TASK 2
a): Analyse raw business data by using statistical methods
5
tabler-icon-diamond-filled.svg

Paraphrase This Document

Need a fresh take? Get an instant paraphrase of this document with our AI Paraphraser
Document Page
i: Earning of various employees
Hourly
Earning
% of
employees CF Cf
Below
10 8 8 8.00%
10 but
under 15 22 30
30.00
%
15 to 20 24 54
54.00
%
20 to 25 14 68
68.00
%
25 to 30 12 80
80.00
%
30 to 40 14 94
94.00
%
40 to 50 6 100
100.0
0%
100
Median 41.25
Quartile
25th 17
6
Document Page
Median= L1 + (N/2) – C/ F* I
Mean= Number of frequency / 2 = 100/2= 50
It falls into the range of 15-20
Median: 15 + [(50-8) / 24*15]
: 15+(42/24*15)=41.25
Q1 = 100/4 = 25 which is fall under the category of 10-15
Q1= 10+(25-8)/22*10
= 10+17/22*10=17
Q3= 3(N/4)
= 3(100/4)=75 fall under the category of 25-30
=25+ (75-54)/ 12*10 =42.5
According to the calculated results, median of hourly earning is 41.25. while quartile first
was determined to 17 and Q3 is found 42.5. It seems to be that reaction which indicate that only
6employes are less paid those are linked to 40-50 class.
ii) calculation of standard deviation and mean
Hourly Earning
Frequenc
y Mid value F* M
Below 10 8 5 40
10 but under 15 22 12.5 275
15 to 20 24 17.5 420
20 to 25 14 22.5 315
25 to 30 12 27.5 330
30 to 40 14 35 490
40 to 50 6 45 270
Total 2140
Mean 21.4
7
Document Page
Working note:
The above calculation is done through using below mentioned formula:
Mean: = ∑F*x /∑F
= 2140 /10
= 21.40
Calculation for standard deviation
Hourly Earning Frequency Mid value F* M Dx = X-A Fdx Fdx2
Below 10 8 5 40 -17.5 -140 19600
10 but under 15 22 12.5 275 -10 -220 48400
15 to 20 24 17.5 420 -5 -120 14400
20 to 25 14 22.5 315 0 0 0
25 to 30 12 27.5 330 5 60 3600
30 to 40 14 35 490 12.5 175 30625
40to 50 6 45 270 22.5 135 18225
100 2140 -110 134850
Assume mean 22.5
Standard deviation: √ ∑Fdx2/N – (∑F d*x/N)2
= √ 134850 / 100 - (- 110/100)^2
= √ 1348.5- 12100 / 10000
= √ 1348.5-1.21 =√1347.29= 36.7
b) Comparison of two results:
In case of A In case of B
In the above mentioned case of A it has been found
that median of following data are £68.
But in the other situation of north east health
professional it was come out to be £14.55. Which is
8
tabler-icon-diamond-filled.svg

Paraphrase This Document

Need a fresh take? Get an instant paraphrase of this document with our AI Paraphraser
Document Page
very much low as compare to the A situation.
Mean values from the given observation in which the
employees are hourly paid are 21.4 of the total.
While in case of B, it low with 16.75 which means
that the company is paying very less amount to them
for their work.
If we look into the standard deviation it has more
risk with 141 to the company.
In case of Company B, they are recorded very less
risk as their standard deviation is much lower with
only 7.14.
According to the above comparison it has been found that in case of A they are much
satisfying with the facilities from that of the company. They are earning more than as compare to
other company. The best result is provided from the A (Ripley and Venables, 2014). The quartile
ranges at 25th percentage is around 8 which is again a positive sign for the company. The
statistical data of A is more effective from that of B. The information which are collected in
order to determine the total changes and impacts on the company as well as employee’s
performance through changes in the earning. This survey from the health professionals is more
effective to analyses the best alternative which is providing more accurate results to the
employees of an organization.
B):
a): Scattered diagram: It is refers as the study and determine best possible relationship among
the changes that are observed in various two sets of variables. It is that value which indicates the
two variables those are plotted on the two axes, this pattern is used to identify correlation
present. It consists of numerical data, the point on that graphs are either fall along the line or in
curve manner.
Outlet size(S) Turnover(T)
A 22 3.3
B 12 2
C 15 2.5
D 20 3.8
E 25 4.1
F 24 3.5
G 10 1.8
H 26 5
I 12 2.5
9
Document Page
J 18 2.5
From the above scattered diagram, it has been found the size of flour areas is much
higher side as compare to that of average weekly turnover (Cochran and et. al., 2011). It means
the most of the clusters are observed in above in the graphs. The turnover is summarized at the
same point with various sizes at the common level. The diagram is perfect to demonstrate the
changes which are seen in the flour or average weekly turnover. Both are gather in their
respective places.
b): Equation on scatter line
10
chevron_up_icon
1 out of 21
circle_padding
hide_on_mobile
zoom_out_icon
[object Object]