Statistics for Management: Report on Statistical Data and Analysis
VerifiedAdded on 2020/10/22
|17
|4149
|75
Report
AI Summary
This report provides a comprehensive analysis of statistical data relevant to management, covering various aspects of economic and business data. It begins with an introduction to statistical concepts and their importance in decision-making. The report then delves into the calculation and evaluation of economic data, focusing on different types of price indices, including CPI, CPIH, and RPI, and their significance in understanding inflation. The report also explores the relationship between hot drinks sales and average temperature using scatter diagrams, determining correlation coefficients, and developing equations for sales prediction. Furthermore, the report covers inventory management concepts such as economic order quantity and reorder levels. The analysis includes the use of suitable charts and diagrams to represent the data effectively, concluding with a summary of the findings and references.
Statistics for Management
Paraphrase This Document
Need a fresh take? Get an instant paraphrase of this document with our AI Paraphraser
Table of Contents
INTRODUCTION...........................................................................................................................2
LO1..................................................................................................................................................2
1. Calculation and evaluation of economic and business data.....................................................2
A & B) Different type of price index...........................................................................................2
C). Differences Between CPI, CPIH and RPI..............................................................................6
D). Importance of CPI in calculation of inflation rate.................................................................7
E). Importance to have information about inflation.....................................................................7
LO2..................................................................................................................................................7
A). Scatter diagram and link between hot drinks and average temperature of different week....7
B. Determination of correlation and coefficient of determination...............................................9
C). Equations for prediction of sales for future time period......................................................10
D). Forecasted of sales at a given..............................................................................................10
E) Reliability of Predictions.......................................................................................................11
LO3................................................................................................................................................11
A Economic order quantity........................................................................................................11
B. Re order Level.......................................................................................................................11
C. Inventory policy cost.............................................................................................................12
D. Actual Service level to consumer.........................................................................................12
E. Re order level at desirable work level...................................................................................12
LO4................................................................................................................................................12
A). Uses of suitable charts finding,............................................................................................12
B. Scatter diagrams that represent the data for hot drinks.........................................................14
CONCLUSION..............................................................................................................................15
REFRENCES.................................................................................................................................16
1
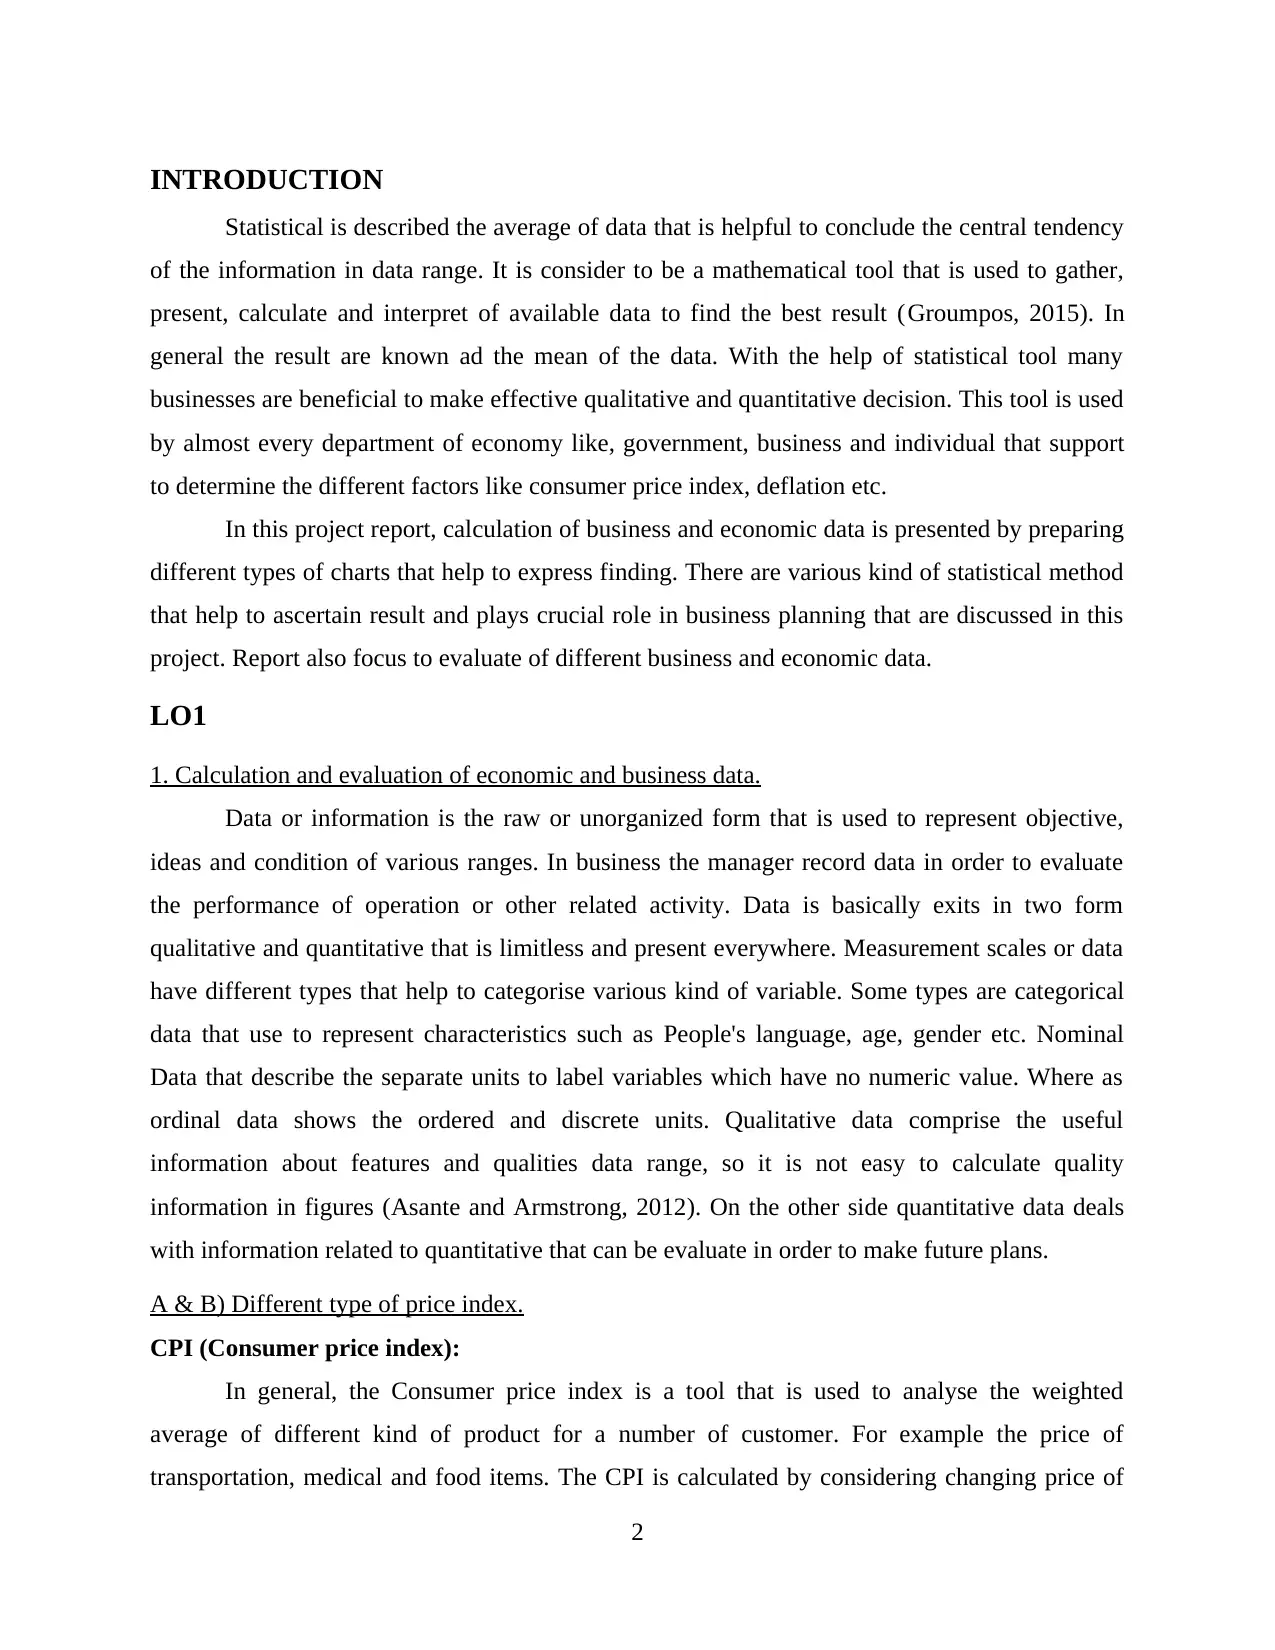
INTRODUCTION
Statistical is described the average of data that is helpful to conclude the central tendency
of the information in data range. It is consider to be a mathematical tool that is used to gather,
present, calculate and interpret of available data to find the best result (Groumpos, 2015). In
general the result are known ad the mean of the data. With the help of statistical tool many
businesses are beneficial to make effective qualitative and quantitative decision. This tool is used
by almost every department of economy like, government, business and individual that support
to determine the different factors like consumer price index, deflation etc.
In this project report, calculation of business and economic data is presented by preparing
different types of charts that help to express finding. There are various kind of statistical method
that help to ascertain result and plays crucial role in business planning that are discussed in this
project. Report also focus to evaluate of different business and economic data.
LO1
1. Calculation and evaluation of economic and business data.
Data or information is the raw or unorganized form that is used to represent objective,
ideas and condition of various ranges. In business the manager record data in order to evaluate
the performance of operation or other related activity. Data is basically exits in two form
qualitative and quantitative that is limitless and present everywhere. Measurement scales or data
have different types that help to categorise various kind of variable. Some types are categorical
data that use to represent characteristics such as People's language, age, gender etc. Nominal
Data that describe the separate units to label variables which have no numeric value. Where as
ordinal data shows the ordered and discrete units. Qualitative data comprise the useful
information about features and qualities data range, so it is not easy to calculate quality
information in figures (Asante and Armstrong, 2012). On the other side quantitative data deals
with information related to quantitative that can be evaluate in order to make future plans.
A & B) Different type of price index.
CPI (Consumer price index):
In general, the Consumer price index is a tool that is used to analyse the weighted
average of different kind of product for a number of customer. For example the price of
transportation, medical and food items. The CPI is calculated by considering changing price of
2
⊘ This is a preview!⊘
Do you want full access?
Subscribe today to unlock all pages.
Trusted by 1+ million students worldwide
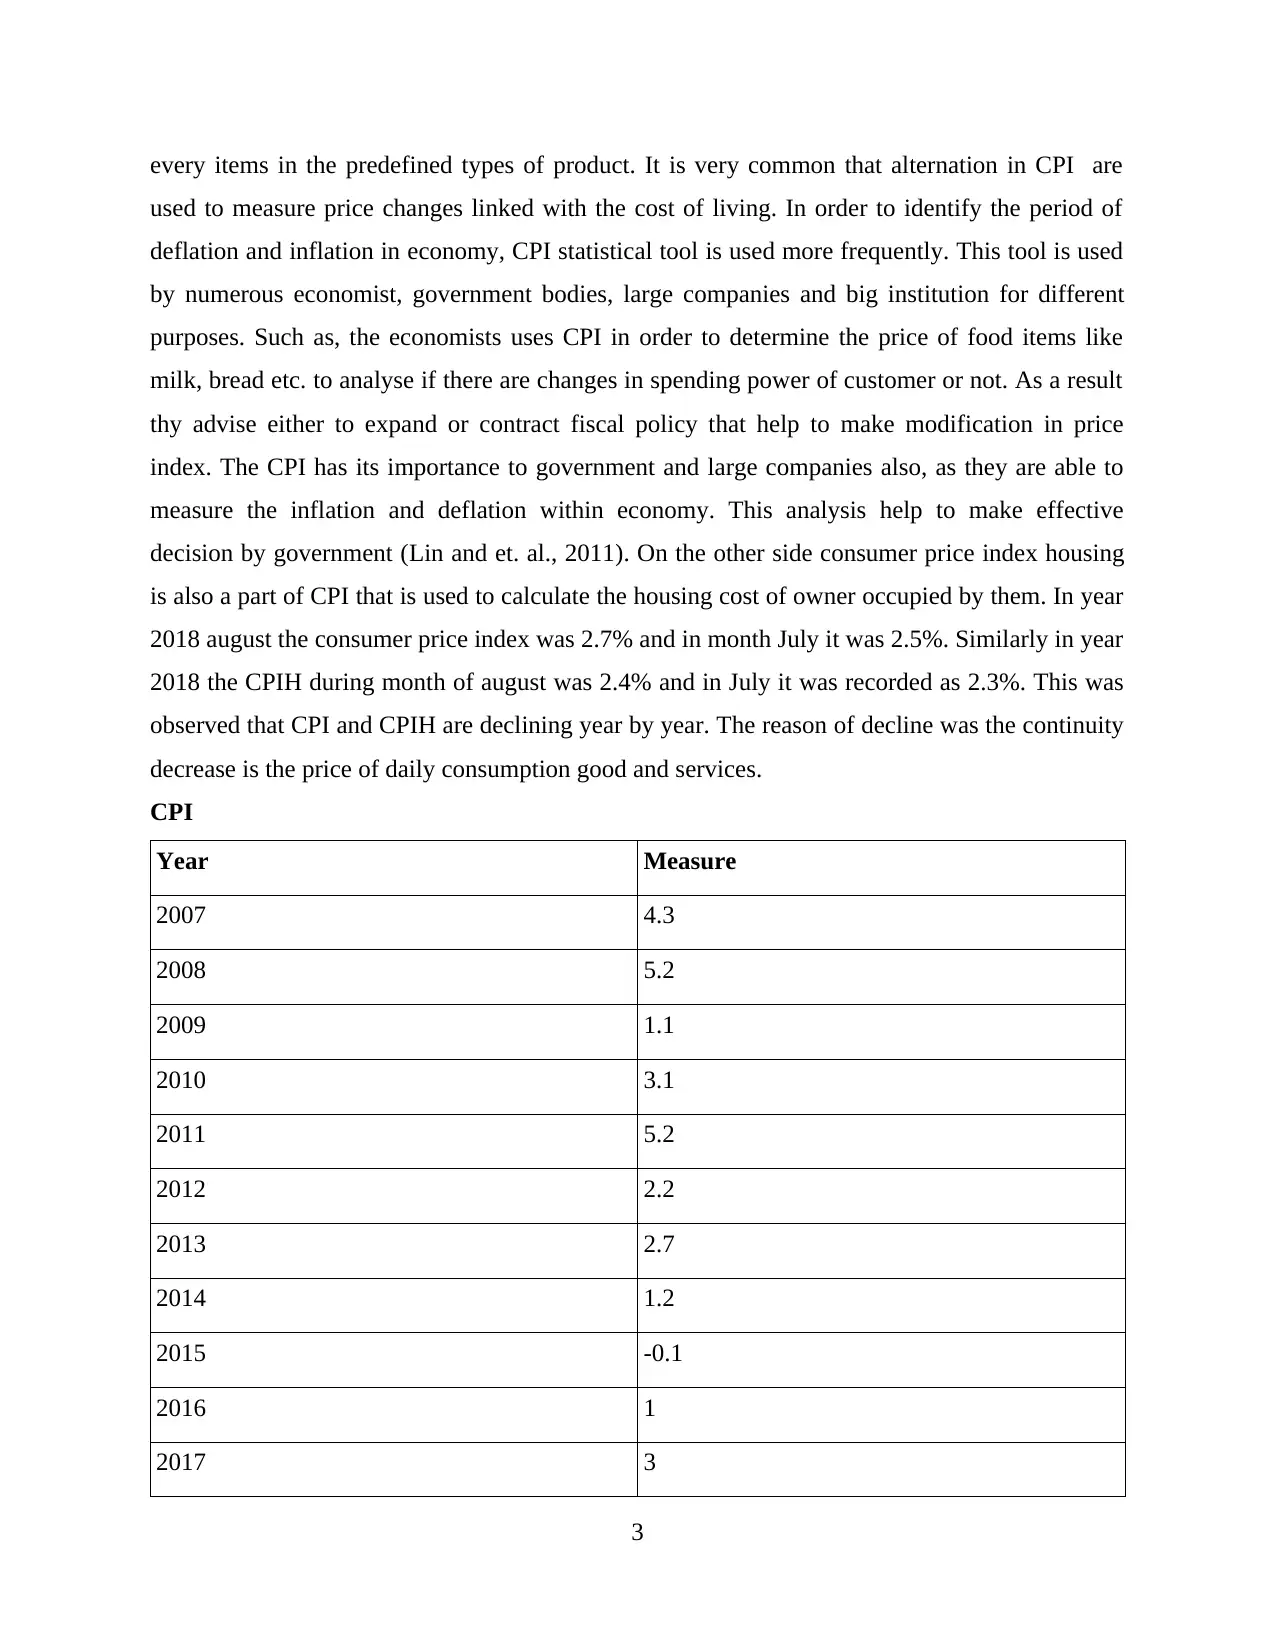
every items in the predefined types of product. It is very common that alternation in CPI are
used to measure price changes linked with the cost of living. In order to identify the period of
deflation and inflation in economy, CPI statistical tool is used more frequently. This tool is used
by numerous economist, government bodies, large companies and big institution for different
purposes. Such as, the economists uses CPI in order to determine the price of food items like
milk, bread etc. to analyse if there are changes in spending power of customer or not. As a result
thy advise either to expand or contract fiscal policy that help to make modification in price
index. The CPI has its importance to government and large companies also, as they are able to
measure the inflation and deflation within economy. This analysis help to make effective
decision by government (Lin and et. al., 2011). On the other side consumer price index housing
is also a part of CPI that is used to calculate the housing cost of owner occupied by them. In year
2018 august the consumer price index was 2.7% and in month July it was 2.5%. Similarly in year
2018 the CPIH during month of august was 2.4% and in July it was recorded as 2.3%. This was
observed that CPI and CPIH are declining year by year. The reason of decline was the continuity
decrease is the price of daily consumption good and services.
CPI
Year Measure
2007 4.3
2008 5.2
2009 1.1
2010 3.1
2011 5.2
2012 2.2
2013 2.7
2014 1.2
2015 -0.1
2016 1
2017 3
3
Paraphrase This Document
Need a fresh take? Get an instant paraphrase of this document with our AI Paraphraser
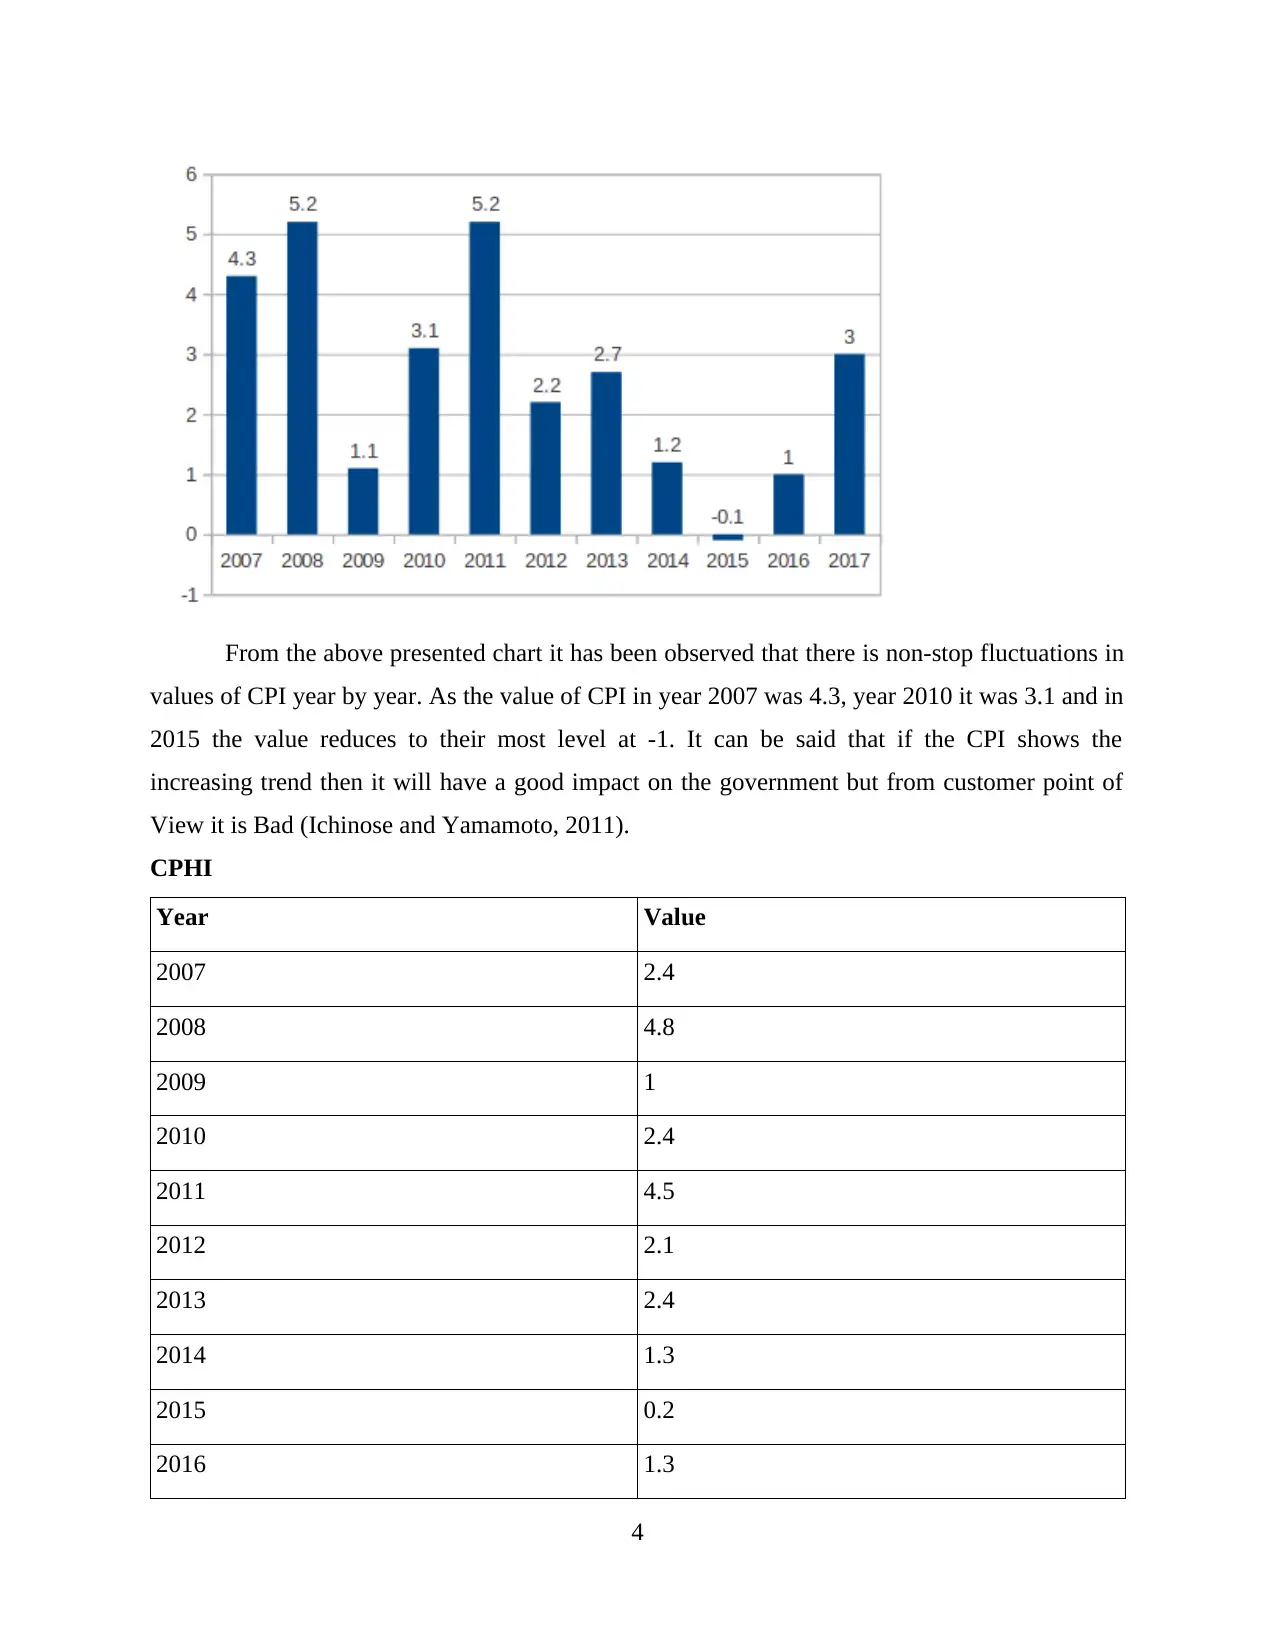
From the above presented chart it has been observed that there is non-stop fluctuations in
values of CPI year by year. As the value of CPI in year 2007 was 4.3, year 2010 it was 3.1 and in
2015 the value reduces to their most level at -1. It can be said that if the CPI shows the
increasing trend then it will have a good impact on the government but from customer point of
View it is Bad (Ichinose and Yamamoto, 2011).
CPHI
Year Value
2007 2.4
2008 4.8
2009 1
2010 2.4
2011 4.5
2012 2.1
2013 2.4
2014 1.3
2015 0.2
2016 1.3
4

2017 2.8
5
5
⊘ This is a preview!⊘
Do you want full access?
Subscribe today to unlock all pages.
Trusted by 1+ million students worldwide
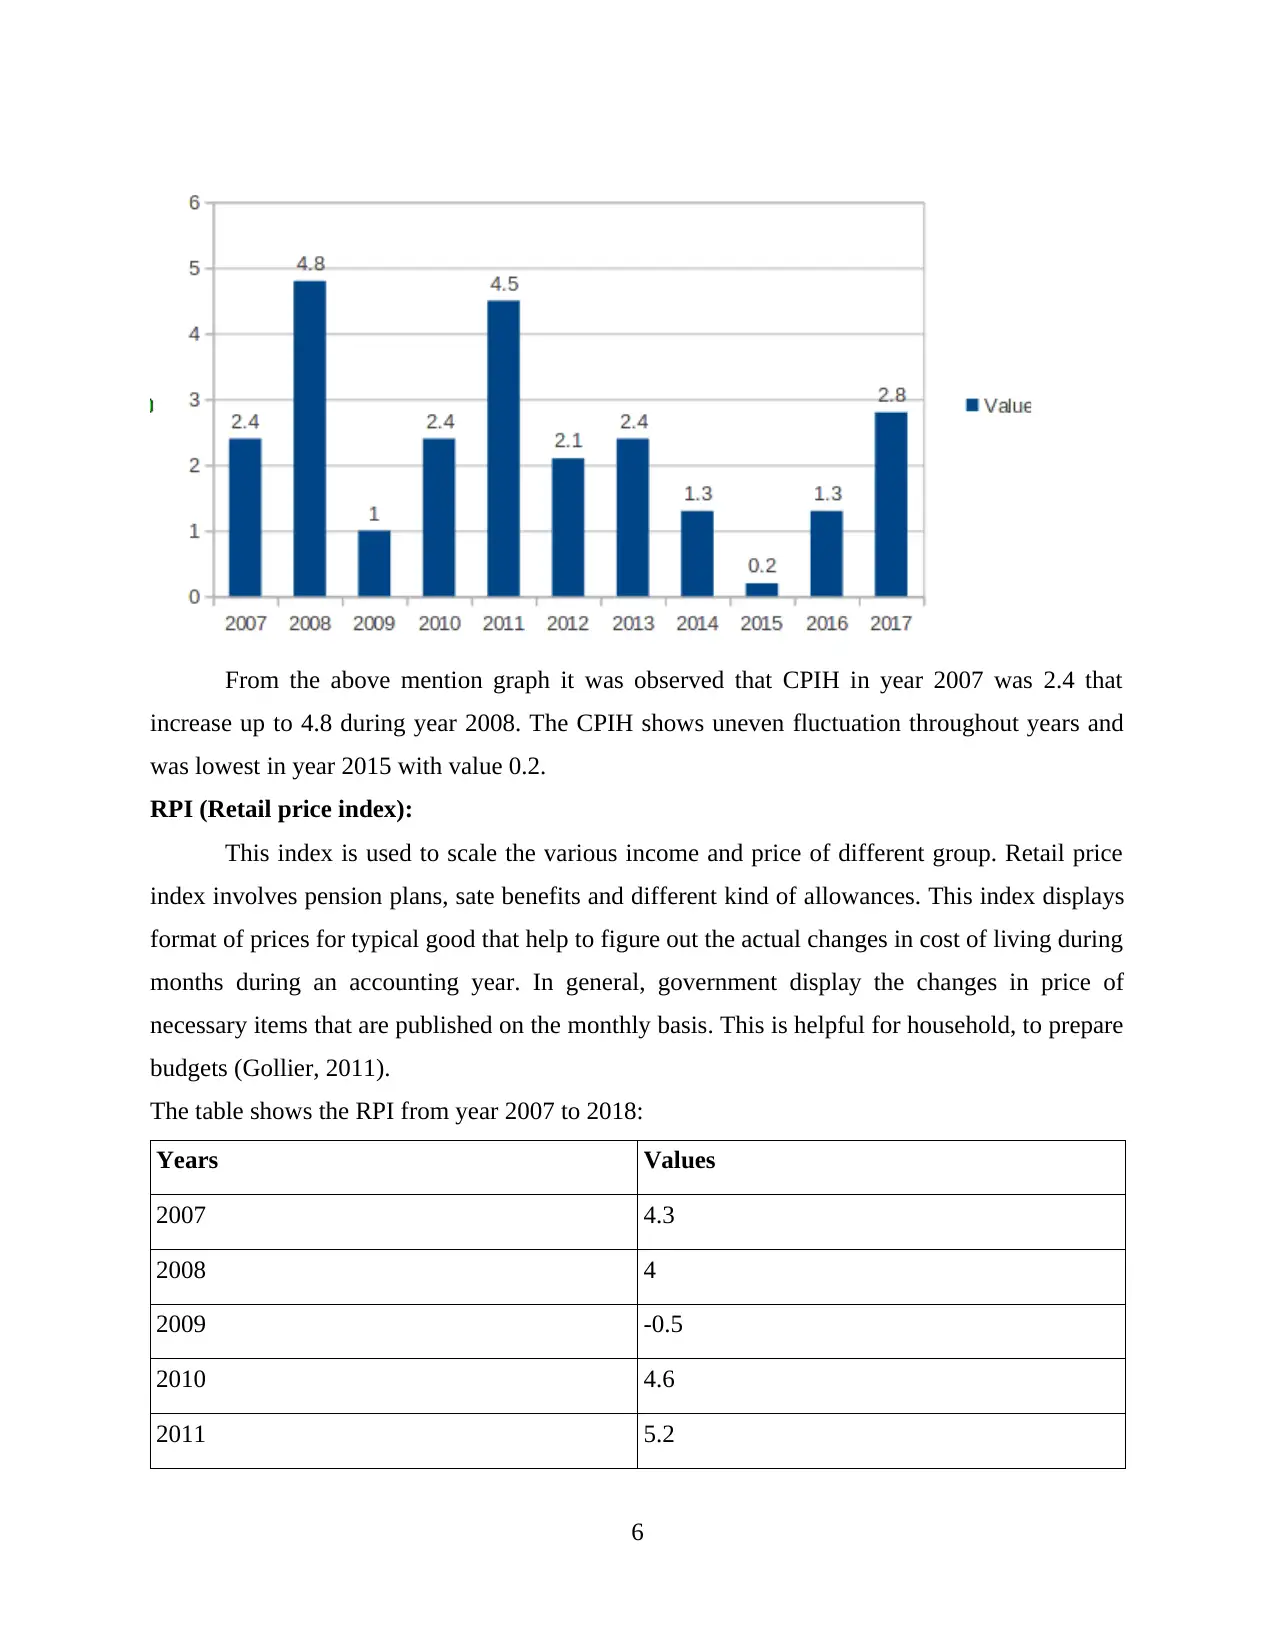
From the above mention graph it was observed that CPIH in year 2007 was 2.4 that
increase up to 4.8 during year 2008. The CPIH shows uneven fluctuation throughout years and
was lowest in year 2015 with value 0.2.
RPI (Retail price index):
This index is used to scale the various income and price of different group. Retail price
index involves pension plans, sate benefits and different kind of allowances. This index displays
format of prices for typical good that help to figure out the actual changes in cost of living during
months during an accounting year. In general, government display the changes in price of
necessary items that are published on the monthly basis. This is helpful for household, to prepare
budgets (Gollier, 2011).
The table shows the RPI from year 2007 to 2018:
Years Values
2007 4.3
2008 4
2009 -0.5
2010 4.6
2011 5.2
6
Paraphrase This Document
Need a fresh take? Get an instant paraphrase of this document with our AI Paraphraser
2012 3.2
2013 3
2014 2.4
2015 1
2016 1.8
2017 3.6
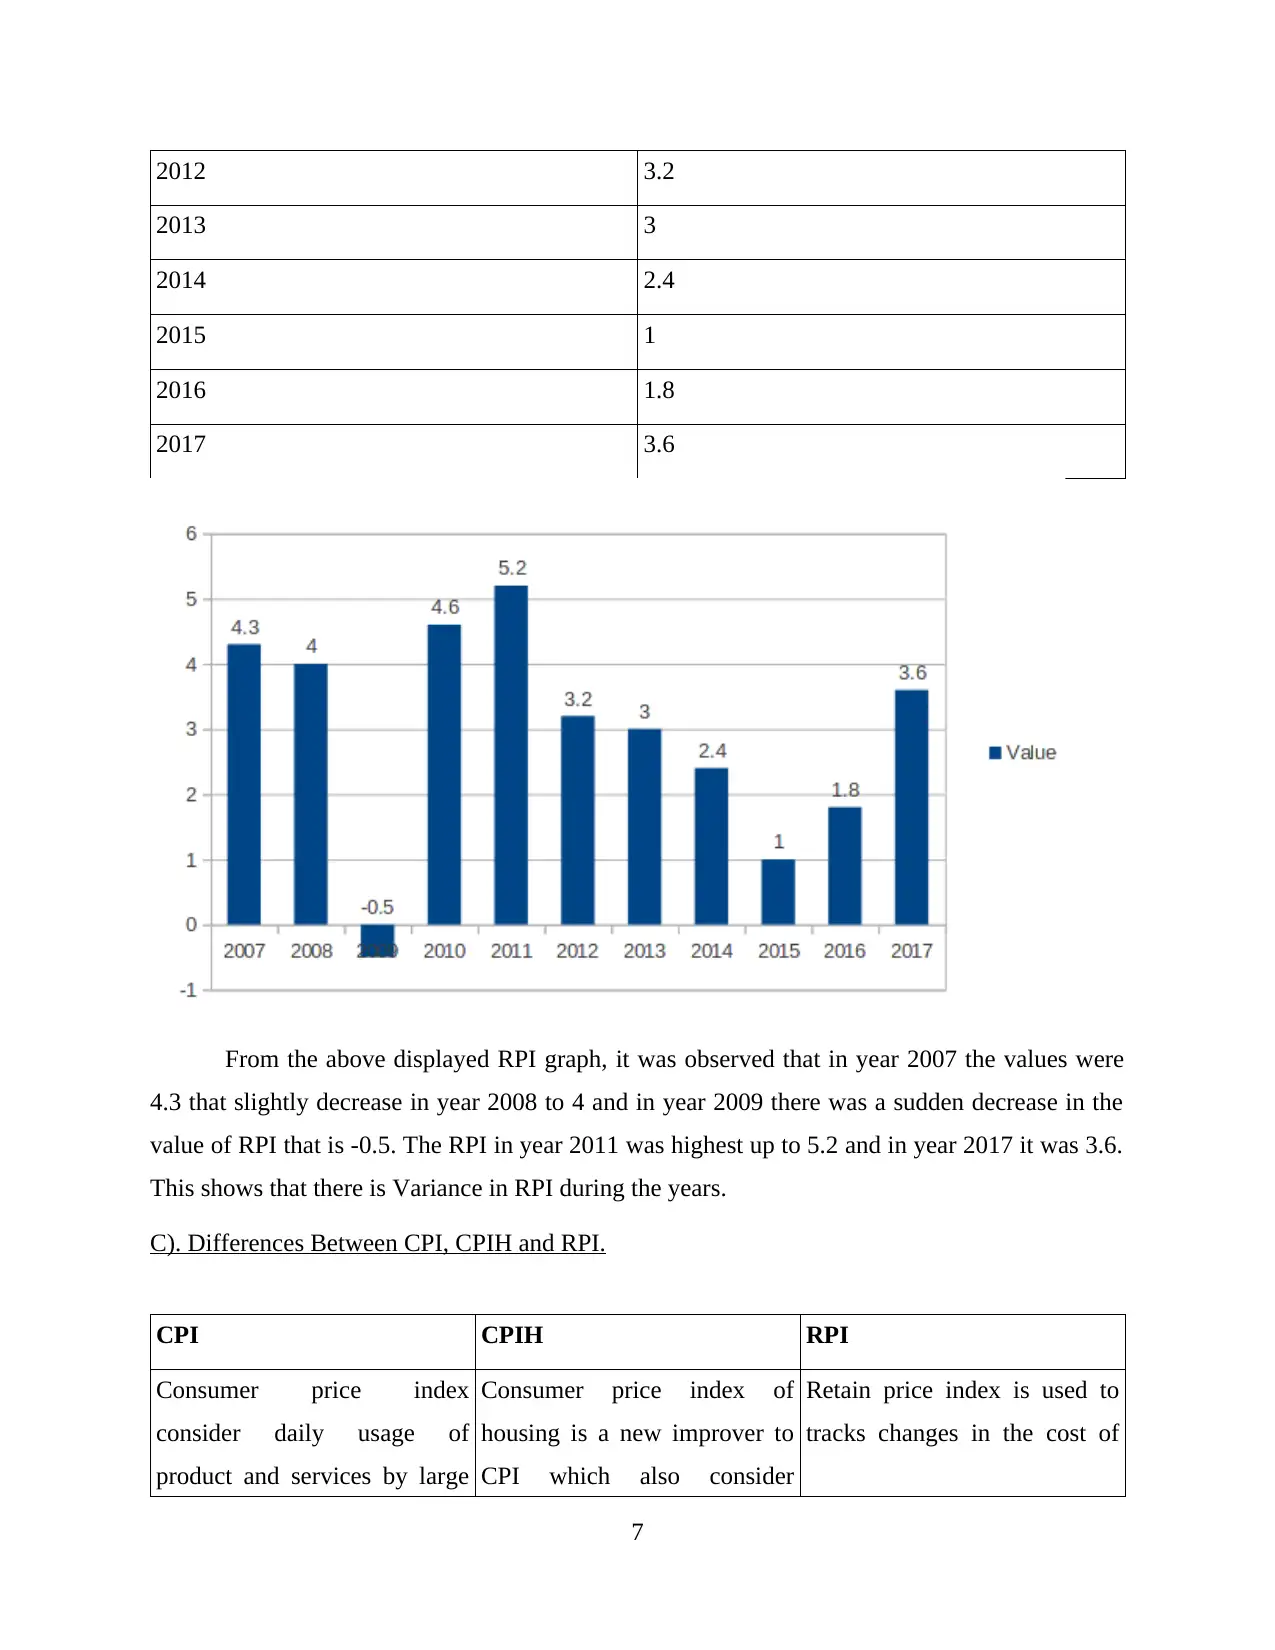
From the above displayed RPI graph, it was observed that in year 2007 the values were
4.3 that slightly decrease in year 2008 to 4 and in year 2009 there was a sudden decrease in the
value of RPI that is -0.5. The RPI in year 2011 was highest up to 5.2 and in year 2017 it was 3.6.
This shows that there is Variance in RPI during the years.
C). Differences Between CPI, CPIH and RPI.
CPI CPIH RPI
Consumer price index
consider daily usage of
product and services by large
Consumer price index of
housing is a new improver to
CPI which also consider
Retain price index is used to
tracks changes in the cost of
7
2013 3
2014 2.4
2015 1
2016 1.8
2017 3.6
From the above displayed RPI graph, it was observed that in year 2007 the values were
4.3 that slightly decrease in year 2008 to 4 and in year 2009 there was a sudden decrease in the
value of RPI that is -0.5. The RPI in year 2011 was highest up to 5.2 and in year 2017 it was 3.6.
This shows that there is Variance in RPI during the years.
C). Differences Between CPI, CPIH and RPI.
CPI CPIH RPI
Consumer price index
consider daily usage of
product and services by large
Consumer price index of
housing is a new improver to
CPI which also consider
Retain price index is used to
tracks changes in the cost of
7
number of clients. housing cost for a period. particular product and services.
This shows fluctuation in
proportion of daily usage of
product in market.
This index is similar to CPI
but add an additional cost that
is housing cost of owner
(Boehm and Thomas, 2013).
RPI is accommodating in
examine of inflation.
This tools is largely used by
governance authority and
institution.
This display alteration in
average human activity price.
RPI is used to calculate cost of
retail product and commodity.
D). Importance of CPI in calculation of inflation rate.
In general it has been analysed that consumer price index in an important indie that
support to calculate the inflation. As it is seen that decreasing CPI lead to the inflation in country
and shows the percentage changes in the economy. It is observed that in year 2017 the CPI was
higher that CPI of 2016 by 1 value. Which shows the overall percentage change is 2% that gives
rise to inflation rate in economy.
E). Importance to have information about inflation.
Inflation is defines as the long term, rise in the price of product and services that is
happened because of regulation of currency (Inflation and price indices, 2018). It is a
quantitative measure of rate where the average price of selected good and services at a particular
time period. It is necessary for companies to have the exact understanding and knowledge of
inflation that support in formation of effective strategies to deal with inflation rate. Manager
must be knowledgable about inflation, which help to ascertain price of different product and
services accordingly. This support companies to be stable and sustainable in market.
LO2
A). Scatter diagram and link between hot drinks and average temperature of different week.
Scatter diagram method is one of the most commonly and simplest approach to examine
the correlation among the two variable. This diagram is a chart that used to plot the relationship
between two non stop variable (Embrechts and Hofert, 2014). The graph represent the cost and
revenues figures on Y axis and X axis over a period of time. Manager with the help of scatter
diagram monitor the cost of production for per unit cost and evaluate the positive and negative
8
⊘ This is a preview!⊘
Do you want full access?
Subscribe today to unlock all pages.
Trusted by 1+ million students worldwide
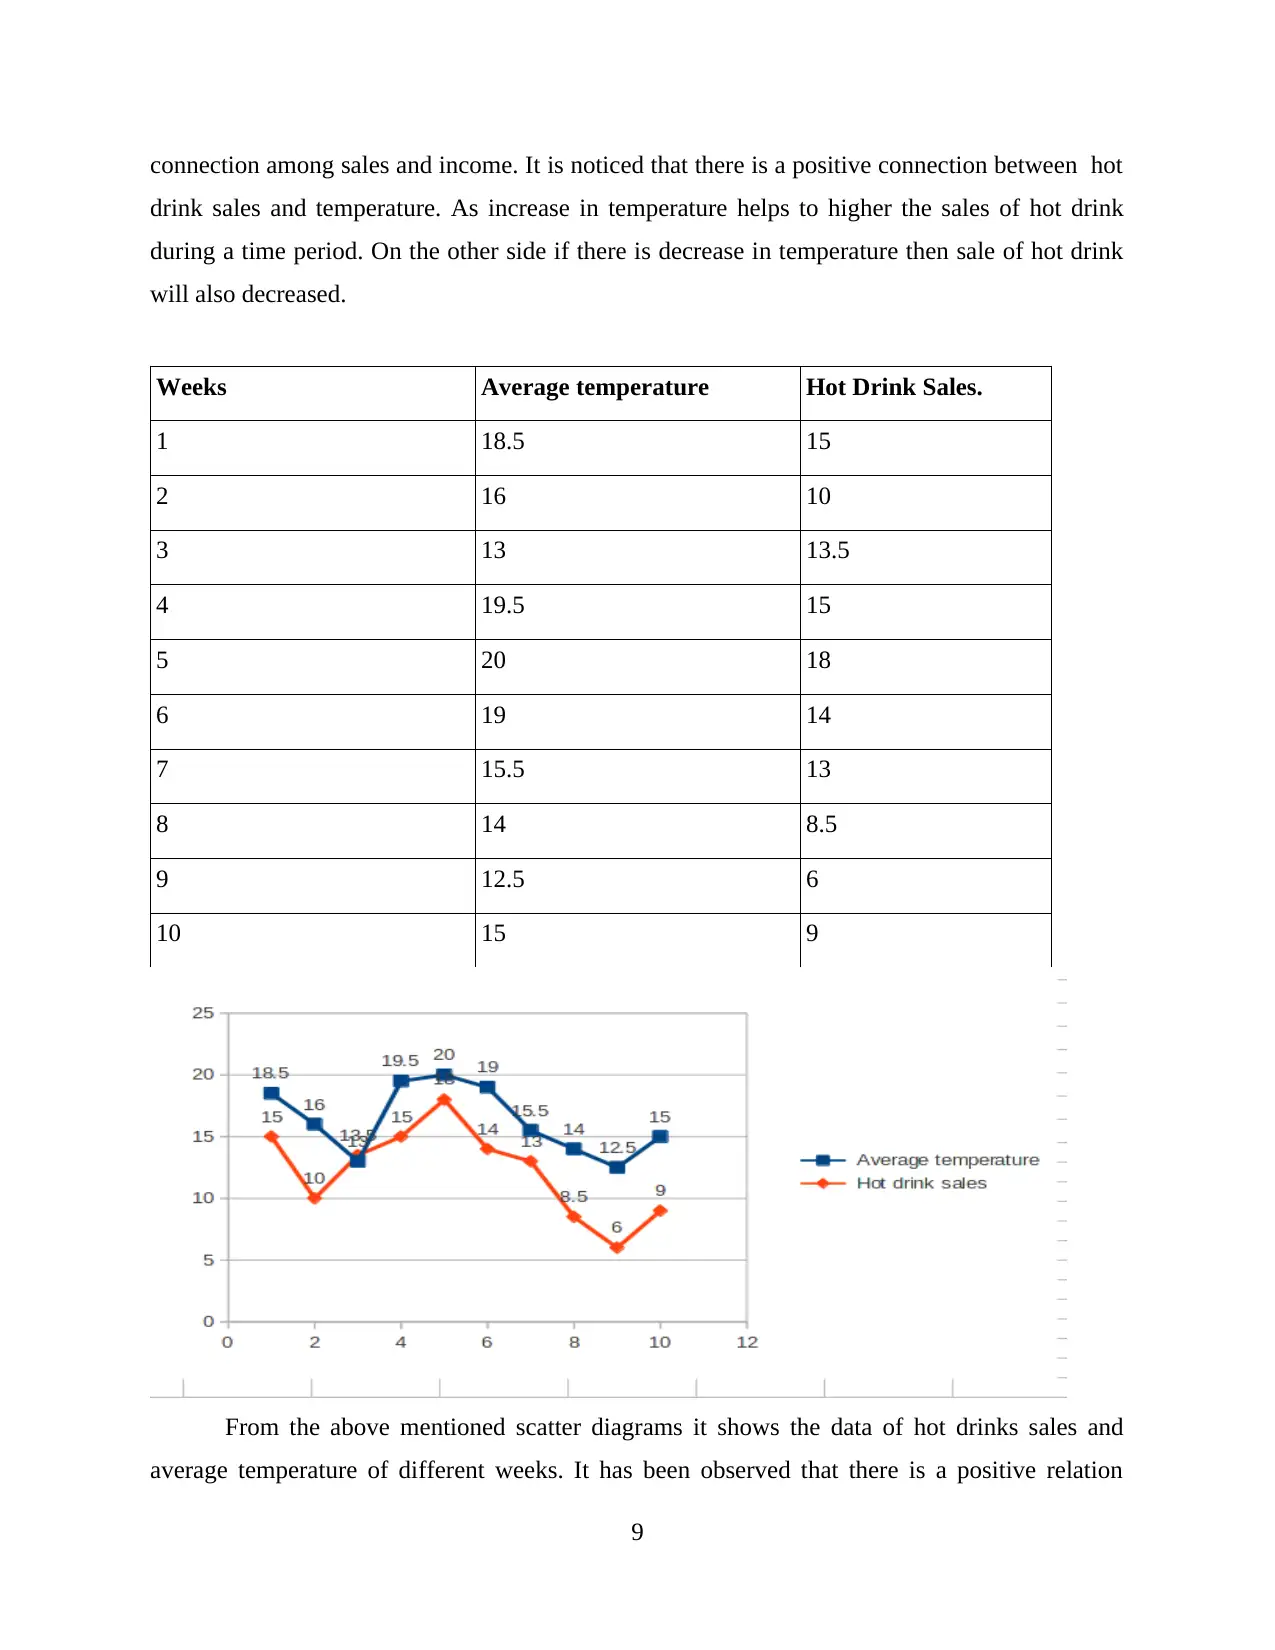
connection among sales and income. It is noticed that there is a positive connection between hot
drink sales and temperature. As increase in temperature helps to higher the sales of hot drink
during a time period. On the other side if there is decrease in temperature then sale of hot drink
will also decreased.
Weeks Average temperature Hot Drink Sales.
1 18.5 15
2 16 10
3 13 13.5
4 19.5 15
5 20 18
6 19 14
7 15.5 13
8 14 8.5
9 12.5 6
10 15 9
From the above mentioned scatter diagrams it shows the data of hot drinks sales and
average temperature of different weeks. It has been observed that there is a positive relation
9
Paraphrase This Document
Need a fresh take? Get an instant paraphrase of this document with our AI Paraphraser
between sales and average temperature. As it is noticed that when there is rise in temperature
than demand for hot drinks will automatically increase and vice versa. It is also observed that the
sales were equal to demand in 2nd and 4th week and in week 9 the sales were lowest because there
is sudden decline in temperature. Therefore it is concluded that scatter diagram display the
positive connection between the hot drink and temperature.
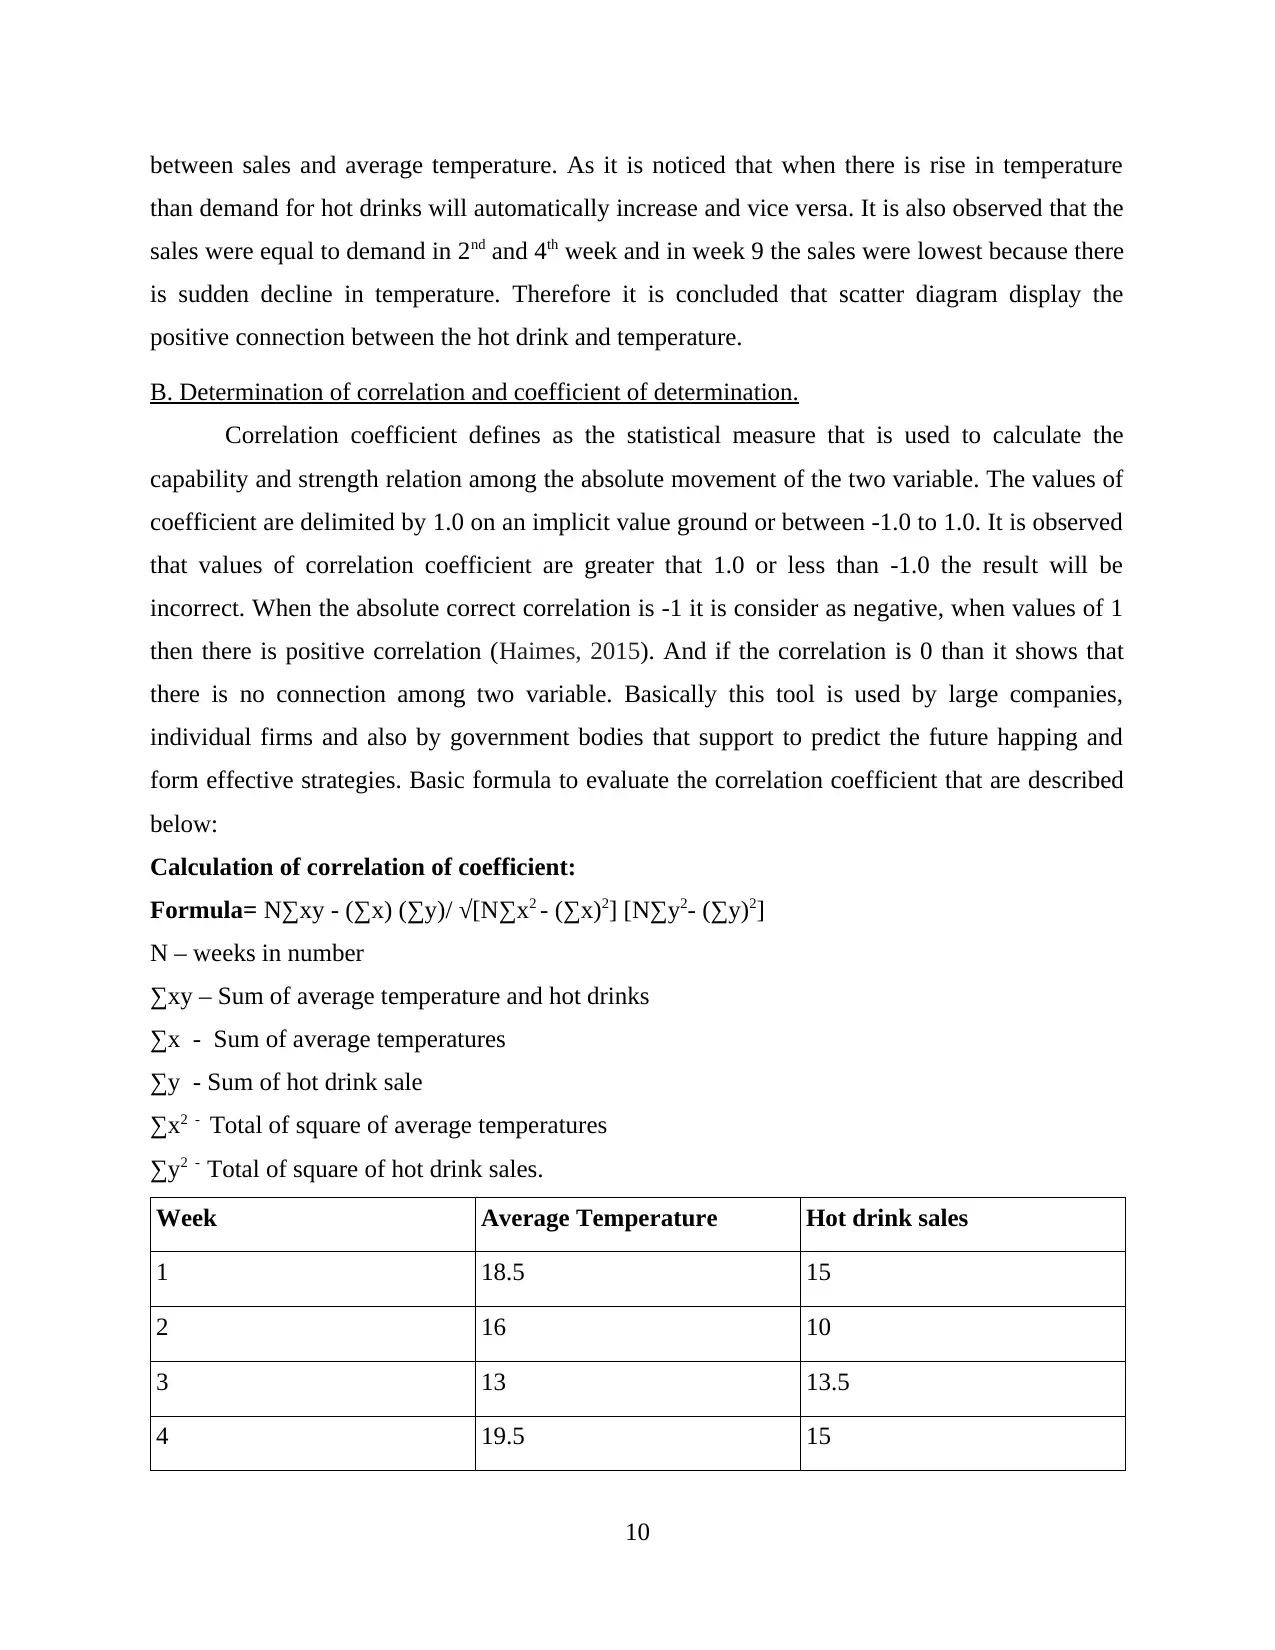
B. Determination of correlation and coefficient of determination.
Correlation coefficient defines as the statistical measure that is used to calculate the
capability and strength relation among the absolute movement of the two variable. The values of
coefficient are delimited by 1.0 on an implicit value ground or between -1.0 to 1.0. It is observed
that values of correlation coefficient are greater that 1.0 or less than -1.0 the result will be
incorrect. When the absolute correct correlation is -1 it is consider as negative, when values of 1
then there is positive correlation (Haimes, 2015). And if the correlation is 0 than it shows that
there is no connection among two variable. Basically this tool is used by large companies,
individual firms and also by government bodies that support to predict the future happing and
form effective strategies. Basic formula to evaluate the correlation coefficient that are described
below:
Calculation of correlation of coefficient:
Formula= N∑xy - (∑x) (∑y)/ √[N∑x2 - (∑x)2] [N∑y2- (∑y)2]
N – weeks in number
∑xy – Sum of average temperature and hot drinks
∑x - Sum of average temperatures
∑y - Sum of hot drink sale
∑x2 - Total of square of average temperatures
∑y2 - Total of square of hot drink sales.
Week Average Temperature Hot drink sales
1 18.5 15
2 16 10
3 13 13.5
4 19.5 15
10
than demand for hot drinks will automatically increase and vice versa. It is also observed that the
sales were equal to demand in 2nd and 4th week and in week 9 the sales were lowest because there
is sudden decline in temperature. Therefore it is concluded that scatter diagram display the
positive connection between the hot drink and temperature.
B. Determination of correlation and coefficient of determination.
Correlation coefficient defines as the statistical measure that is used to calculate the
capability and strength relation among the absolute movement of the two variable. The values of
coefficient are delimited by 1.0 on an implicit value ground or between -1.0 to 1.0. It is observed
that values of correlation coefficient are greater that 1.0 or less than -1.0 the result will be
incorrect. When the absolute correct correlation is -1 it is consider as negative, when values of 1
then there is positive correlation (Haimes, 2015). And if the correlation is 0 than it shows that
there is no connection among two variable. Basically this tool is used by large companies,
individual firms and also by government bodies that support to predict the future happing and
form effective strategies. Basic formula to evaluate the correlation coefficient that are described
below:
Calculation of correlation of coefficient:
Formula= N∑xy - (∑x) (∑y)/ √[N∑x2 - (∑x)2] [N∑y2- (∑y)2]
N – weeks in number
∑xy – Sum of average temperature and hot drinks
∑x - Sum of average temperatures
∑y - Sum of hot drink sale
∑x2 - Total of square of average temperatures
∑y2 - Total of square of hot drink sales.
Week Average Temperature Hot drink sales
1 18.5 15
2 16 10
3 13 13.5
4 19.5 15
10
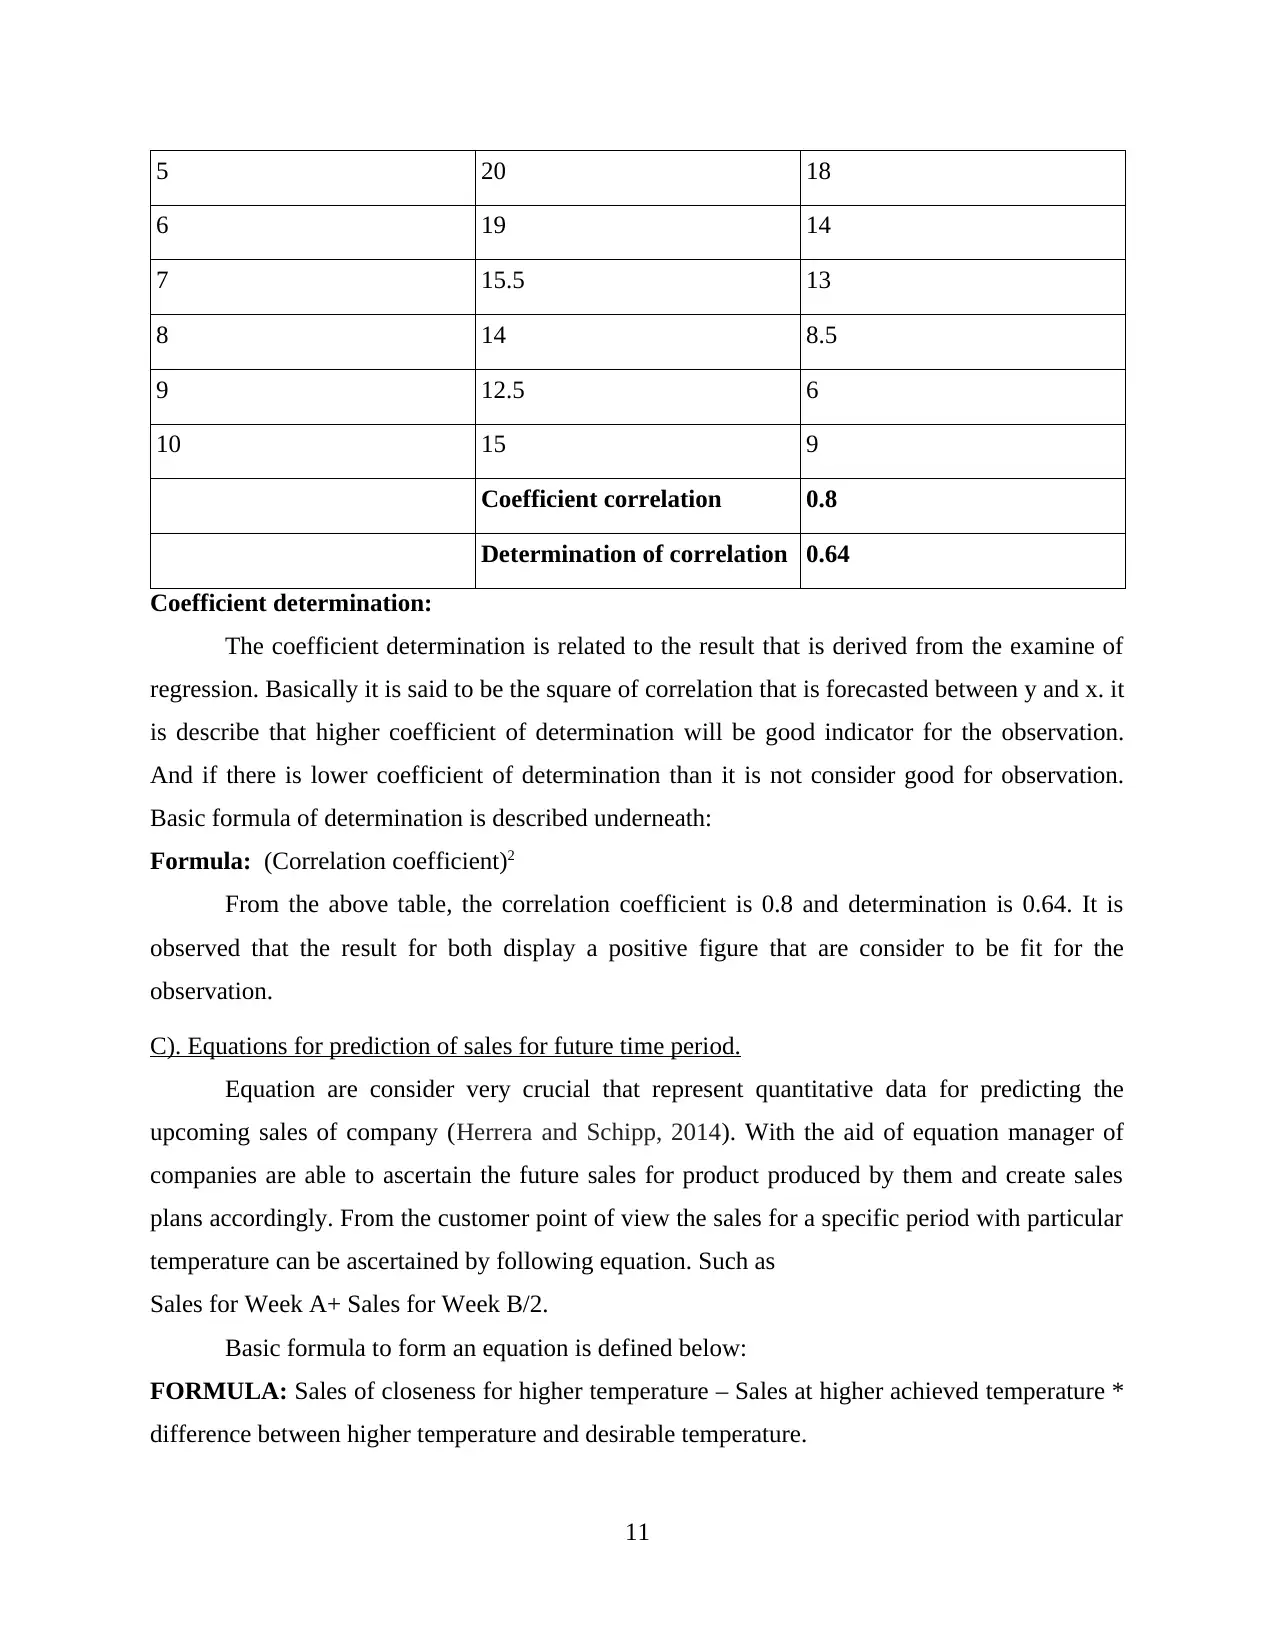
5 20 18
6 19 14
7 15.5 13
8 14 8.5
9 12.5 6
10 15 9
Coefficient correlation 0.8
Determination of correlation 0.64
Coefficient determination:
The coefficient determination is related to the result that is derived from the examine of
regression. Basically it is said to be the square of correlation that is forecasted between y and x. it
is describe that higher coefficient of determination will be good indicator for the observation.
And if there is lower coefficient of determination than it is not consider good for observation.
Basic formula of determination is described underneath:
Formula: (Correlation coefficient)2
From the above table, the correlation coefficient is 0.8 and determination is 0.64. It is
observed that the result for both display a positive figure that are consider to be fit for the
observation.
C). Equations for prediction of sales for future time period.
Equation are consider very crucial that represent quantitative data for predicting the
upcoming sales of company (Herrera and Schipp, 2014). With the aid of equation manager of
companies are able to ascertain the future sales for product produced by them and create sales
plans accordingly. From the customer point of view the sales for a specific period with particular
temperature can be ascertained by following equation. Such as
Sales for Week A+ Sales for Week B/2.
Basic formula to form an equation is defined below:
FORMULA: Sales of closeness for higher temperature – Sales at higher achieved temperature *
difference between higher temperature and desirable temperature.
11
⊘ This is a preview!⊘
Do you want full access?
Subscribe today to unlock all pages.
Trusted by 1+ million students worldwide
1 out of 17
Related Documents


Your All-in-One AI-Powered Toolkit for Academic Success.
+13062052269
info@desklib.com
Available 24*7 on WhatsApp / Email
![[object Object]](/_next/static/media/star-bottom.7253800d.svg)
Unlock your academic potential
Copyright © 2020–2026 A2Z Services. All Rights Reserved. Developed and managed by ZUCOL.