Statistical Analysis and Interpretation Report for Management
VerifiedAdded on 2020/11/23
|15
|2766
|74
Report
AI Summary
This report presents a comprehensive statistical analysis relevant to management, encompassing various aspects of economic data and business statistics. Task 1 focuses on analyzing the differences in earning capacity between men and women in both public and private sectors, including the determination of annual growth rates. Task 2 delves into the analysis of hourly earnings using Ogive charts, median calculations, quartiles, and standard deviation, comparing earnings between Manchester and London leisure staff. Task 3 addresses the Economic Order Quantity (EOQ) and related calculations. The report utilizes statistical methods to interpret outcomes and draw valid conclusions, providing valuable insights for managerial decision-making.

STATISTICS FOR
MANAGEMENT
MANAGEMENT
Paraphrase This Document
Need a fresh take? Get an instant paraphrase of this document with our AI Paraphraser
TABLE OF CONTENTS
INTRODUCTION...........................................................................................................................1
TASK 1............................................................................................................................................1
A. Analysing the differences between earning capacity of public sector men and women
employees....................................................................................................................................1
B. analysing the relationship between earning capacity of men and women employees in the
private sector................................................................................................................................2
C. Time chart:..............................................................................................................................3
D. Determination of annual growth rate in earnings of each group............................................4
TASK 2............................................................................................................................................7
1. Presenting Ogive chart in analysing the median hourly earnings and quartiles......................7
2. Measuring the mean and standard deviation for hourly earnings............................................8
Comparing the hourly earnings of leisure staff employees in Manchester and London...........10
TASK 3..........................................................................................................................................10
A. Measuring the Economic order quantity (EOQ)...................................................................10
B.................................................................................................................................................10
C.................................................................................................................................................11
D. Determining the current service level...................................................................................11
E. Re-order level........................................................................................................................11
TASK 4..........................................................................................................................................12
A................................................................................................................................................12
B.................................................................................................................................................13
CONCLUSION..............................................................................................................................13
REFERENCES..............................................................................................................................14
INTRODUCTION
Statistical analysis over a data base would be effective for the managerial professional in
relation with analysing the outcomes and making adequate ascertainment of the operations. In
the present report, there will be analysis over the various statistical issues on the basis of current
economic data as well as business statistics which would be adequate in making reliable analysis
over the facts. Moreover, statistical analysis helps an individual in measuring the outcomes and
drafting a valid conclusion on the stated outcomes.
TASK 1
A. Analysing the differences between earning capacity of public sector men and women
employees
Null hypothesis: There is no mean significant relationship between the employees of
public sectors men and women’s earning capacity.
Alternative hypothesis: There is a mean significant relationship between the employees of
public sectors men and women’s earning capacity.
1
⊘ This is a preview!⊘
Do you want full access?
Subscribe today to unlock all pages.
Trusted by 1+ million students worldwide
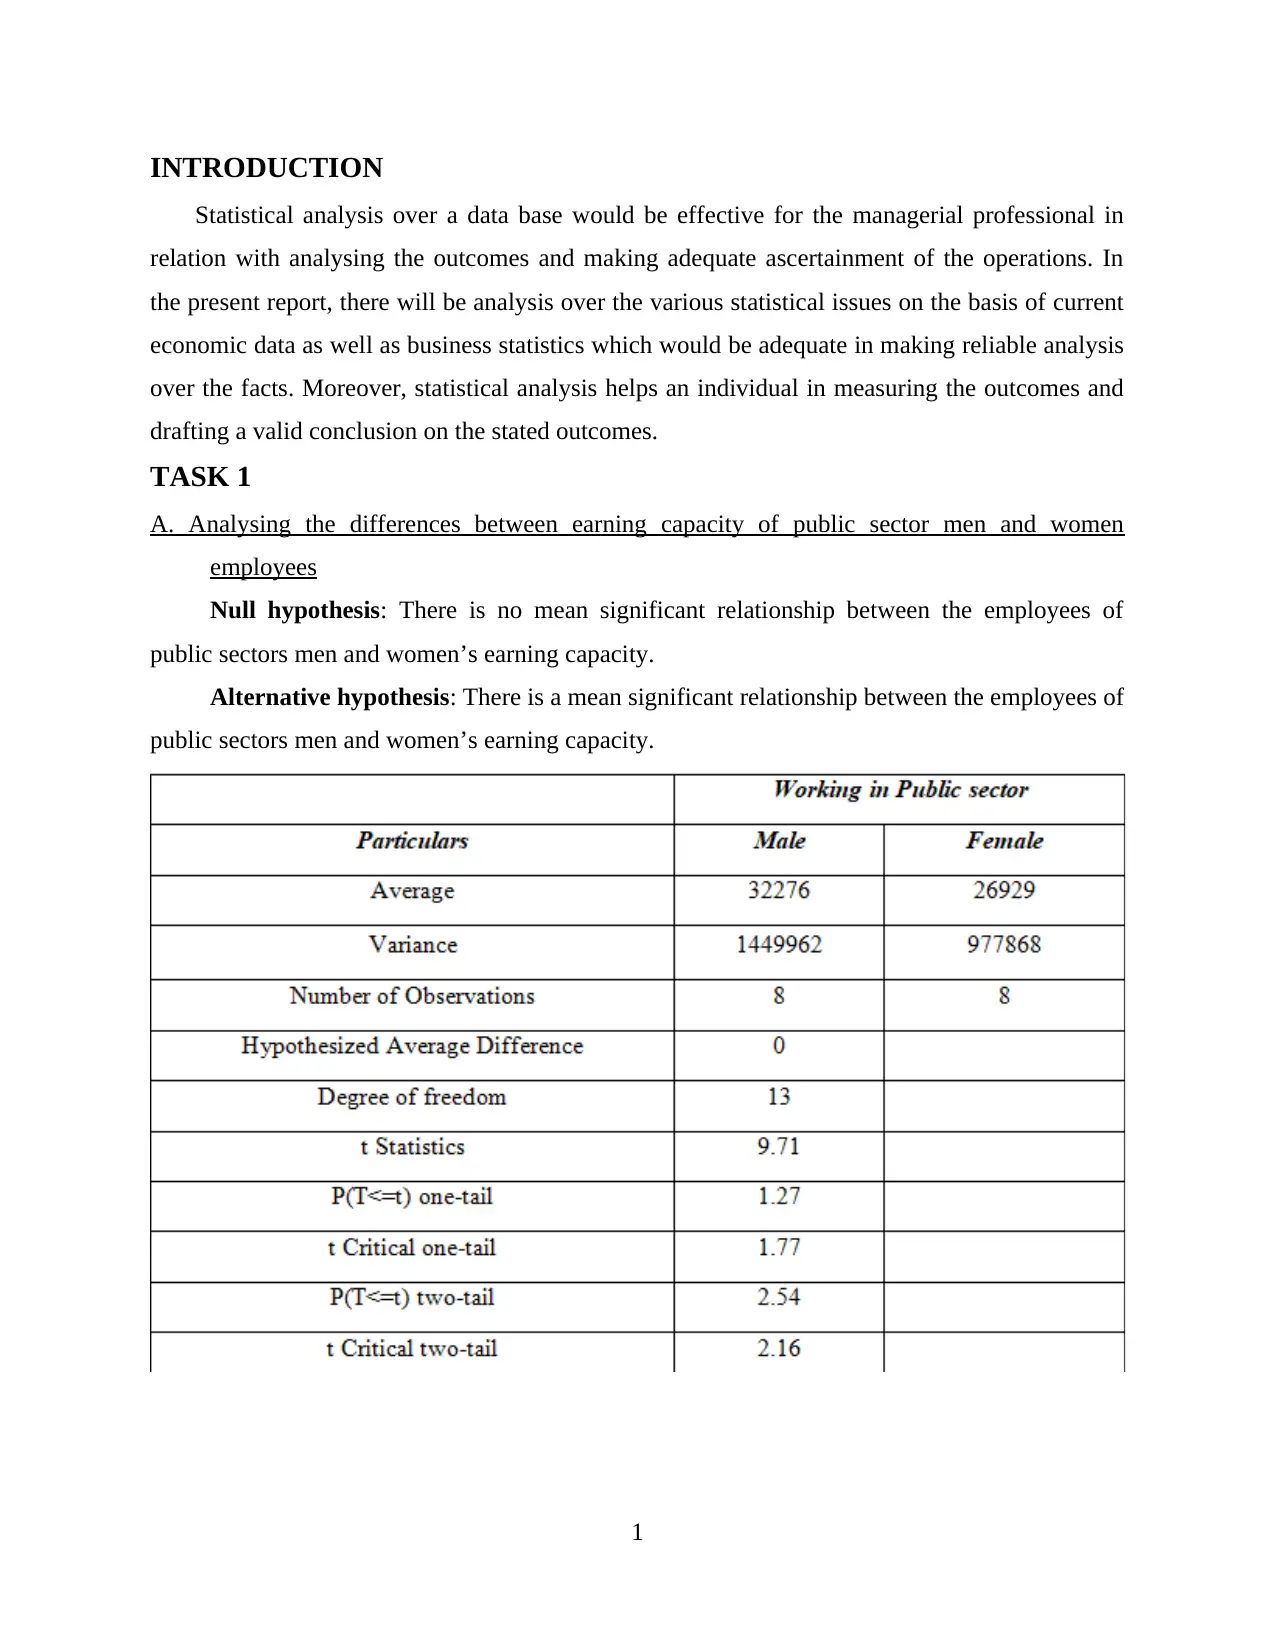
Interpretation: On the basis of anlsyed outcomes which is being based on determining the
differences between male and female employees at the public sector. Thus, the average male who
are earning 32276 per year while women are earning around 26929. Similarly, in analyzing the
variances on which male has 1449962 and female has 977868. On the basis of such analysis on
which it can be said that, male employees are more efficient in earnings as compared with
women employees in public sectors. In accordance with the T statistics which defines one tailed t
value as 1.27 and two tailed as 2.54. therefore, there have been acceptance to the null hypothesis
which states, there is no mean significant relationship between the employees of public sectors
men and women’s earning capacity.
B. analysing the relationship between earning capacity of men and women employees in the
private sector
Null hypothesis: There is no mean significant relationship between the employees of private
sectors men and women’s earning capacity.
Alternative hypothesis: There is a mean significant relationship between the employees of
private sectors men and women’s earning capacity.
2
Paraphrase This Document
Need a fresh take? Get an instant paraphrase of this document with our AI Paraphraser
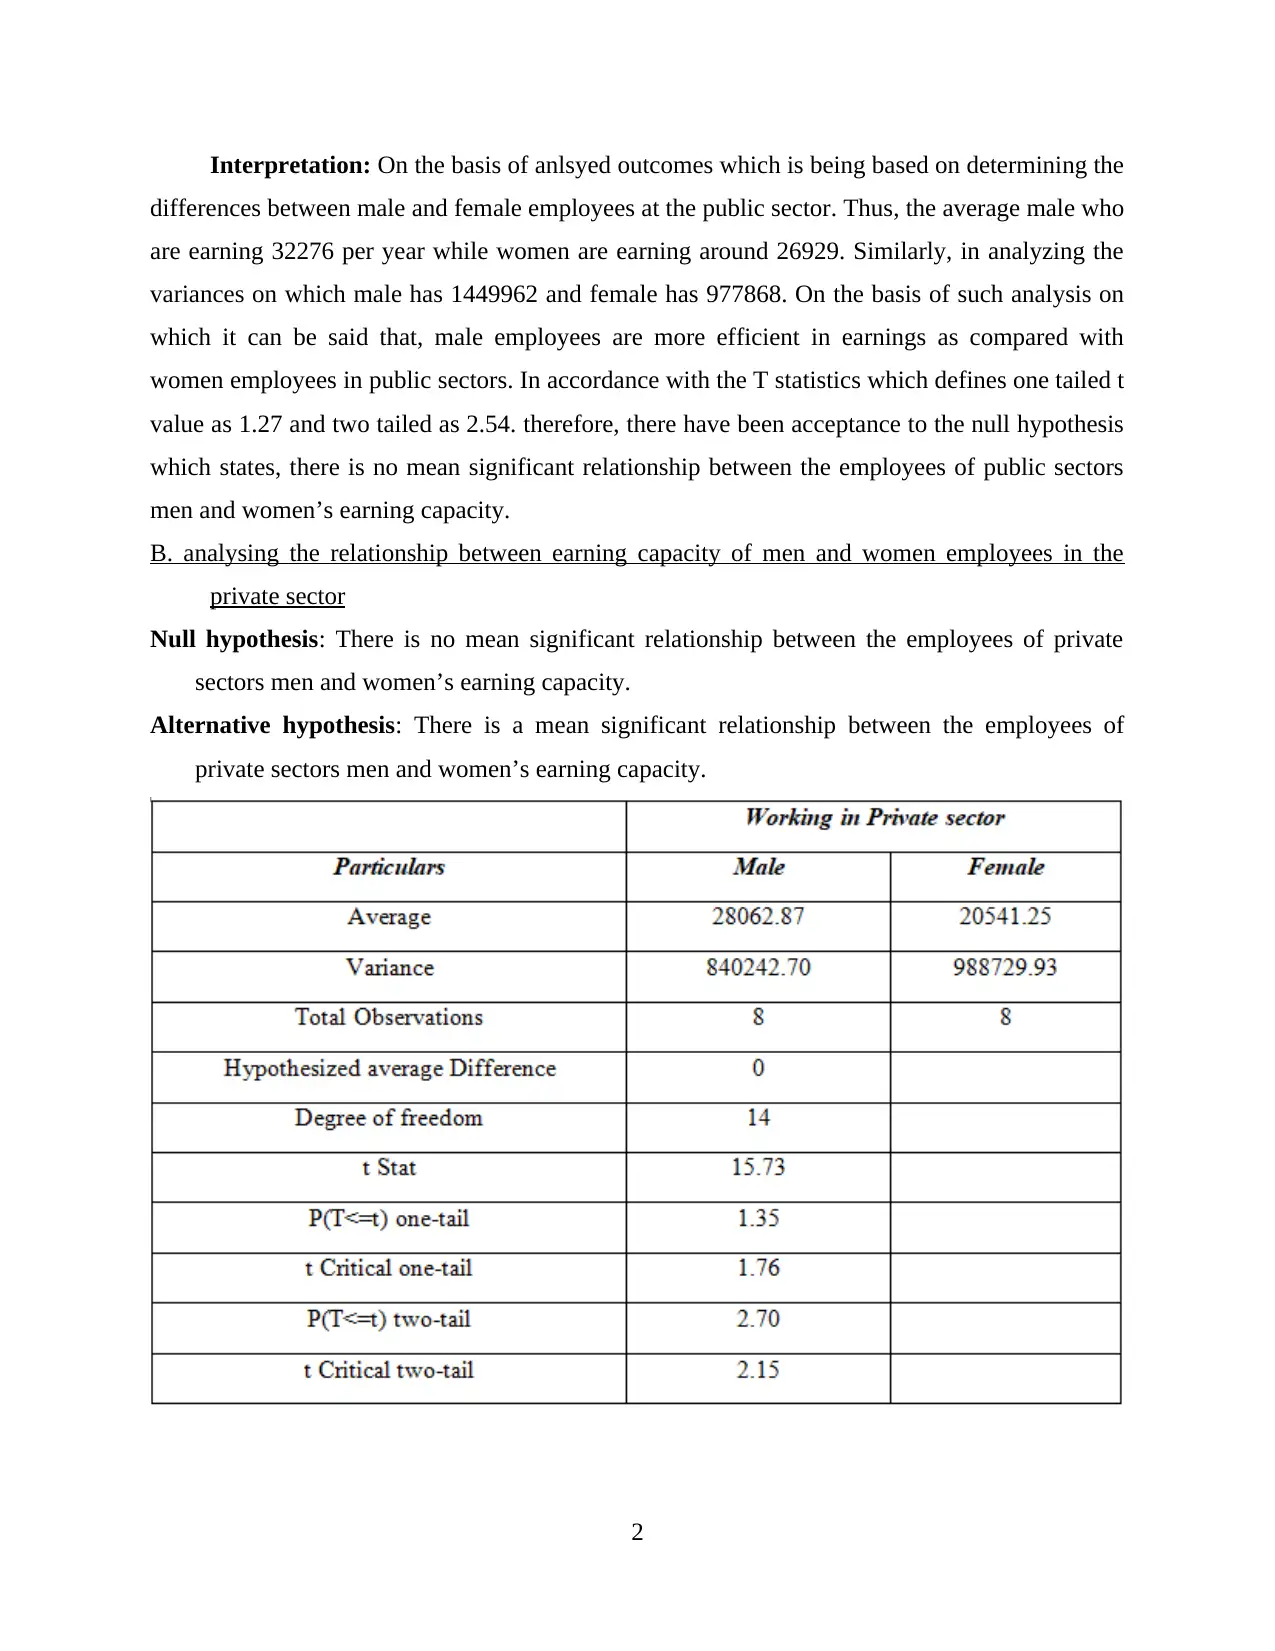
Interpretation: By considering the above analyzed data set which is reflecting the
relationship between the earning capacity of women and men employees in private sector. Thus,
the mean value of such employees as 28062.87 for male in private sector while 20541.25 for
female in private sector. The hypothesis outcome defines 0 which determines that there has been
acceptance to the null hypothesis. It defines that, there is no mean significant relationship
between the employees of private sectors men and women’s earning capacity
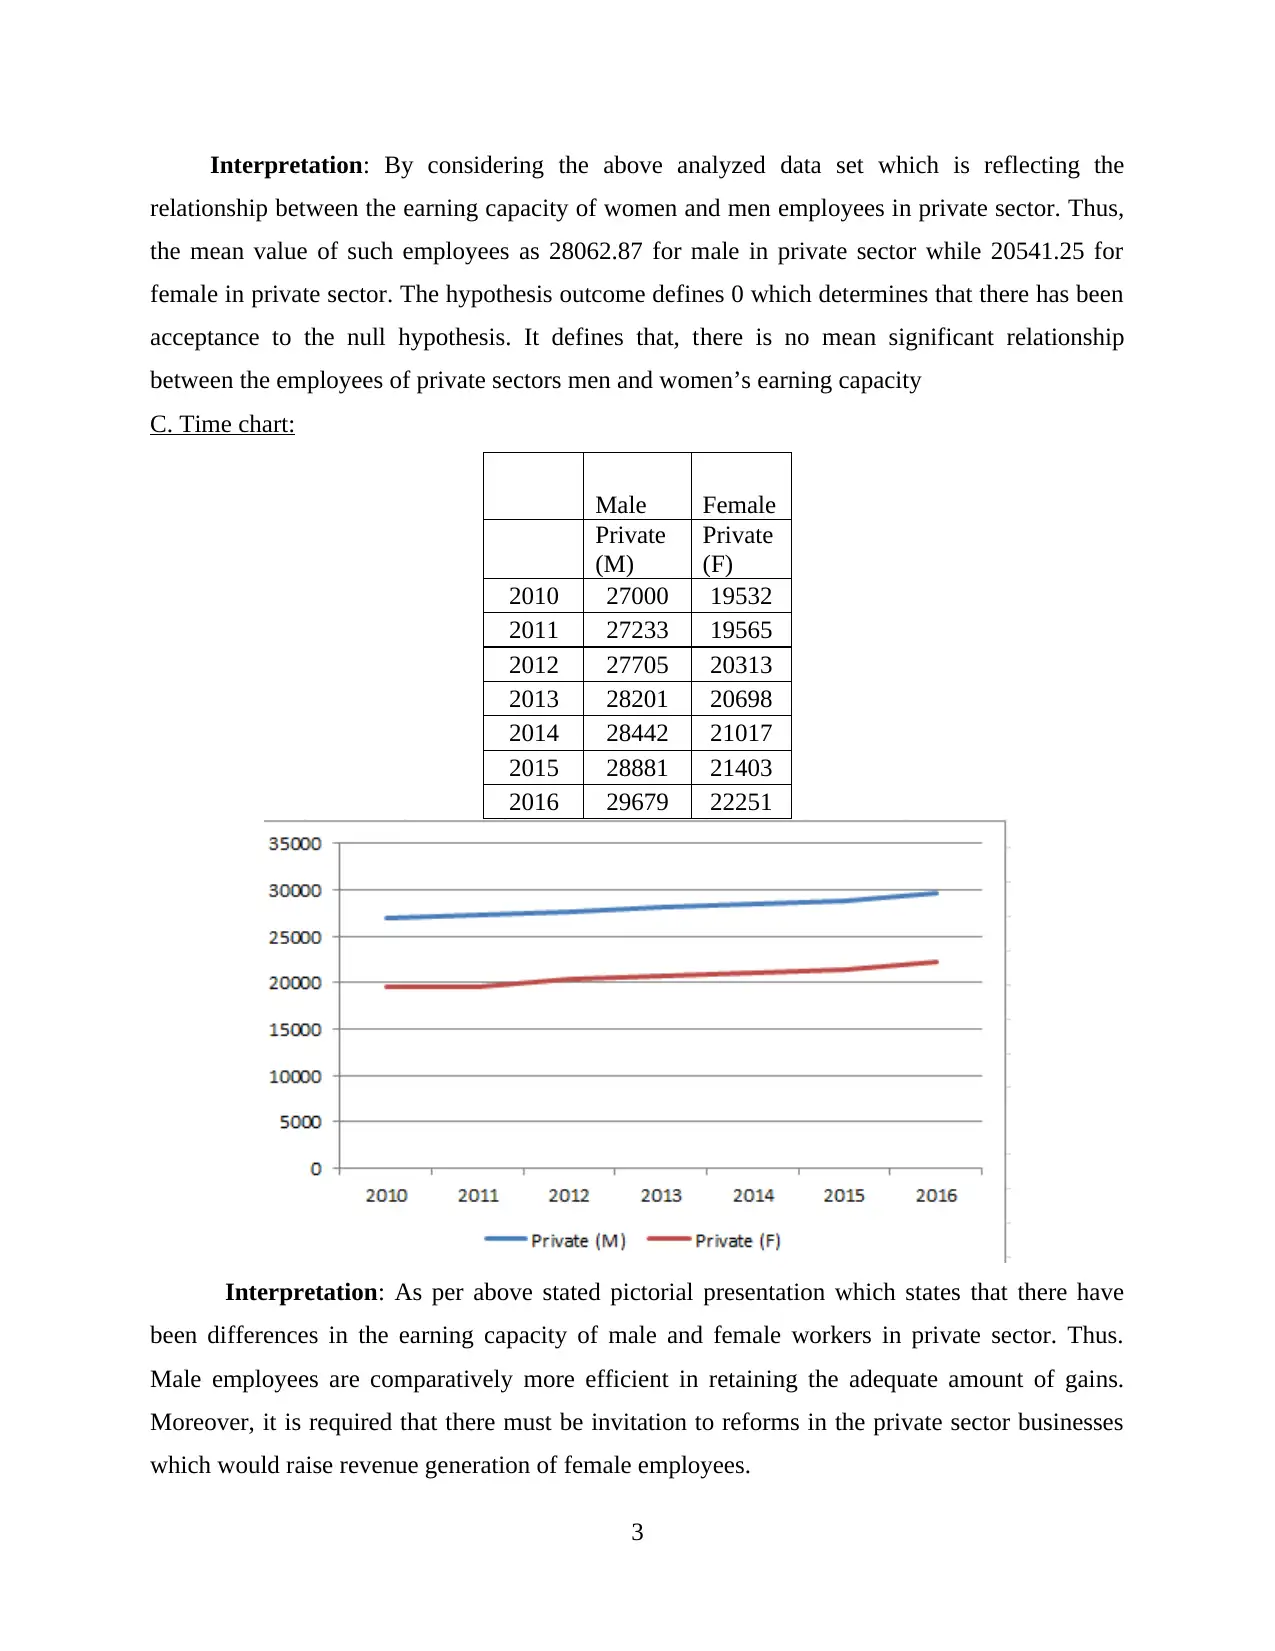
C. Time chart:
Male Female
Private
(M)
Private
(F)
2010 27000 19532
2011 27233 19565
2012 27705 20313
2013 28201 20698
2014 28442 21017
2015 28881 21403
2016 29679 22251
Interpretation: As per above stated pictorial presentation which states that there have
been differences in the earning capacity of male and female workers in private sector. Thus.
Male employees are comparatively more efficient in retaining the adequate amount of gains.
Moreover, it is required that there must be invitation to reforms in the private sector businesses
which would raise revenue generation of female employees.
3
relationship between the earning capacity of women and men employees in private sector. Thus,
the mean value of such employees as 28062.87 for male in private sector while 20541.25 for
female in private sector. The hypothesis outcome defines 0 which determines that there has been
acceptance to the null hypothesis. It defines that, there is no mean significant relationship
between the employees of private sectors men and women’s earning capacity
C. Time chart:
Male Female
Private
(M)
Private
(F)
2010 27000 19532
2011 27233 19565
2012 27705 20313
2013 28201 20698
2014 28442 21017
2015 28881 21403
2016 29679 22251
Interpretation: As per above stated pictorial presentation which states that there have
been differences in the earning capacity of male and female workers in private sector. Thus.
Male employees are comparatively more efficient in retaining the adequate amount of gains.
Moreover, it is required that there must be invitation to reforms in the private sector businesses
which would raise revenue generation of female employees.
3
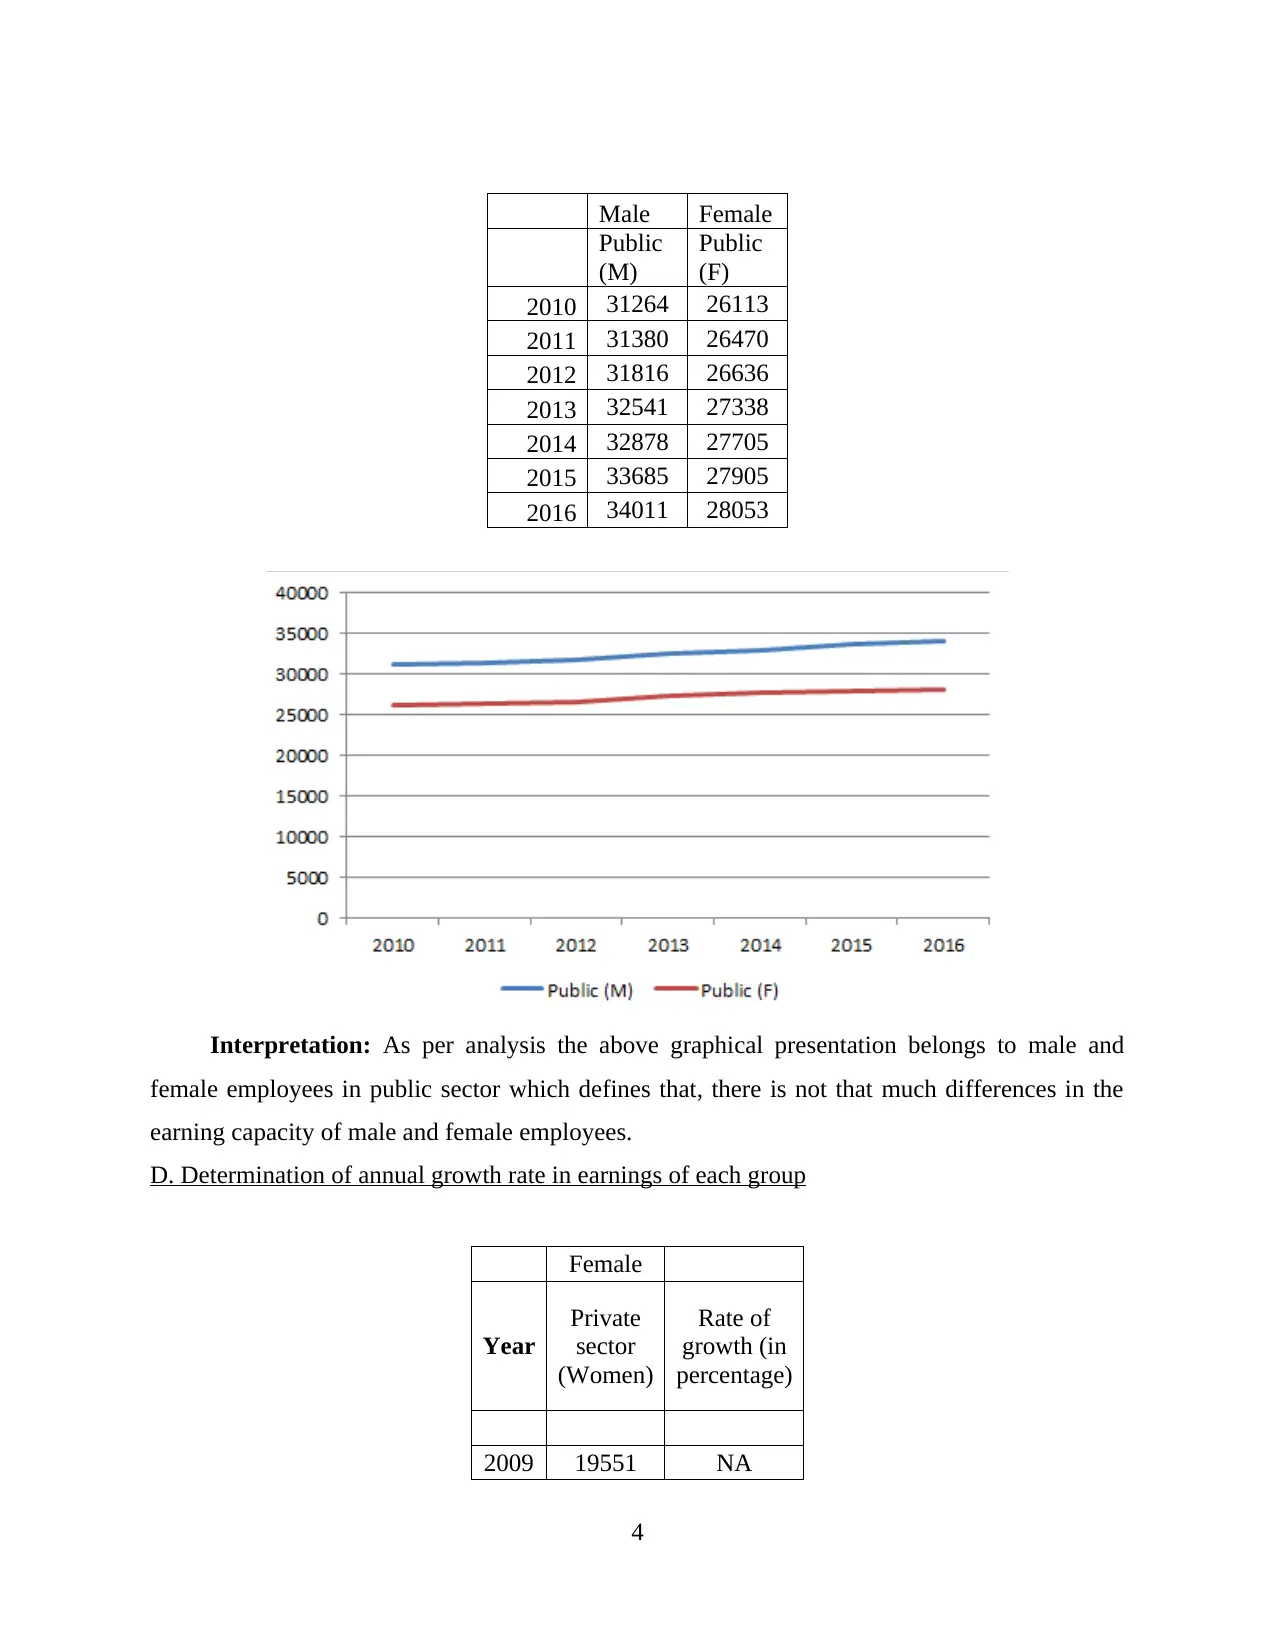
Male Female
Public
(M)
Public
(F)
2010 31264 26113
2011 31380 26470
2012 31816 26636
2013 32541 27338
2014 32878 27705
2015 33685 27905
2016 34011 28053
Interpretation: As per analysis the above graphical presentation belongs to male and
female employees in public sector which defines that, there is not that much differences in the
earning capacity of male and female employees.
D. Determination of annual growth rate in earnings of each group
Female
Year
Private
sector
(Women)
Rate of
growth (in
percentage)
2009 19551 NA
4
Public
(M)
Public
(F)
2010 31264 26113
2011 31380 26470
2012 31816 26636
2013 32541 27338
2014 32878 27705
2015 33685 27905
2016 34011 28053
Interpretation: As per analysis the above graphical presentation belongs to male and
female employees in public sector which defines that, there is not that much differences in the
earning capacity of male and female employees.
D. Determination of annual growth rate in earnings of each group
Female
Year
Private
sector
(Women)
Rate of
growth (in
percentage)
2009 19551 NA
4
⊘ This is a preview!⊘
Do you want full access?
Subscribe today to unlock all pages.
Trusted by 1+ million students worldwide
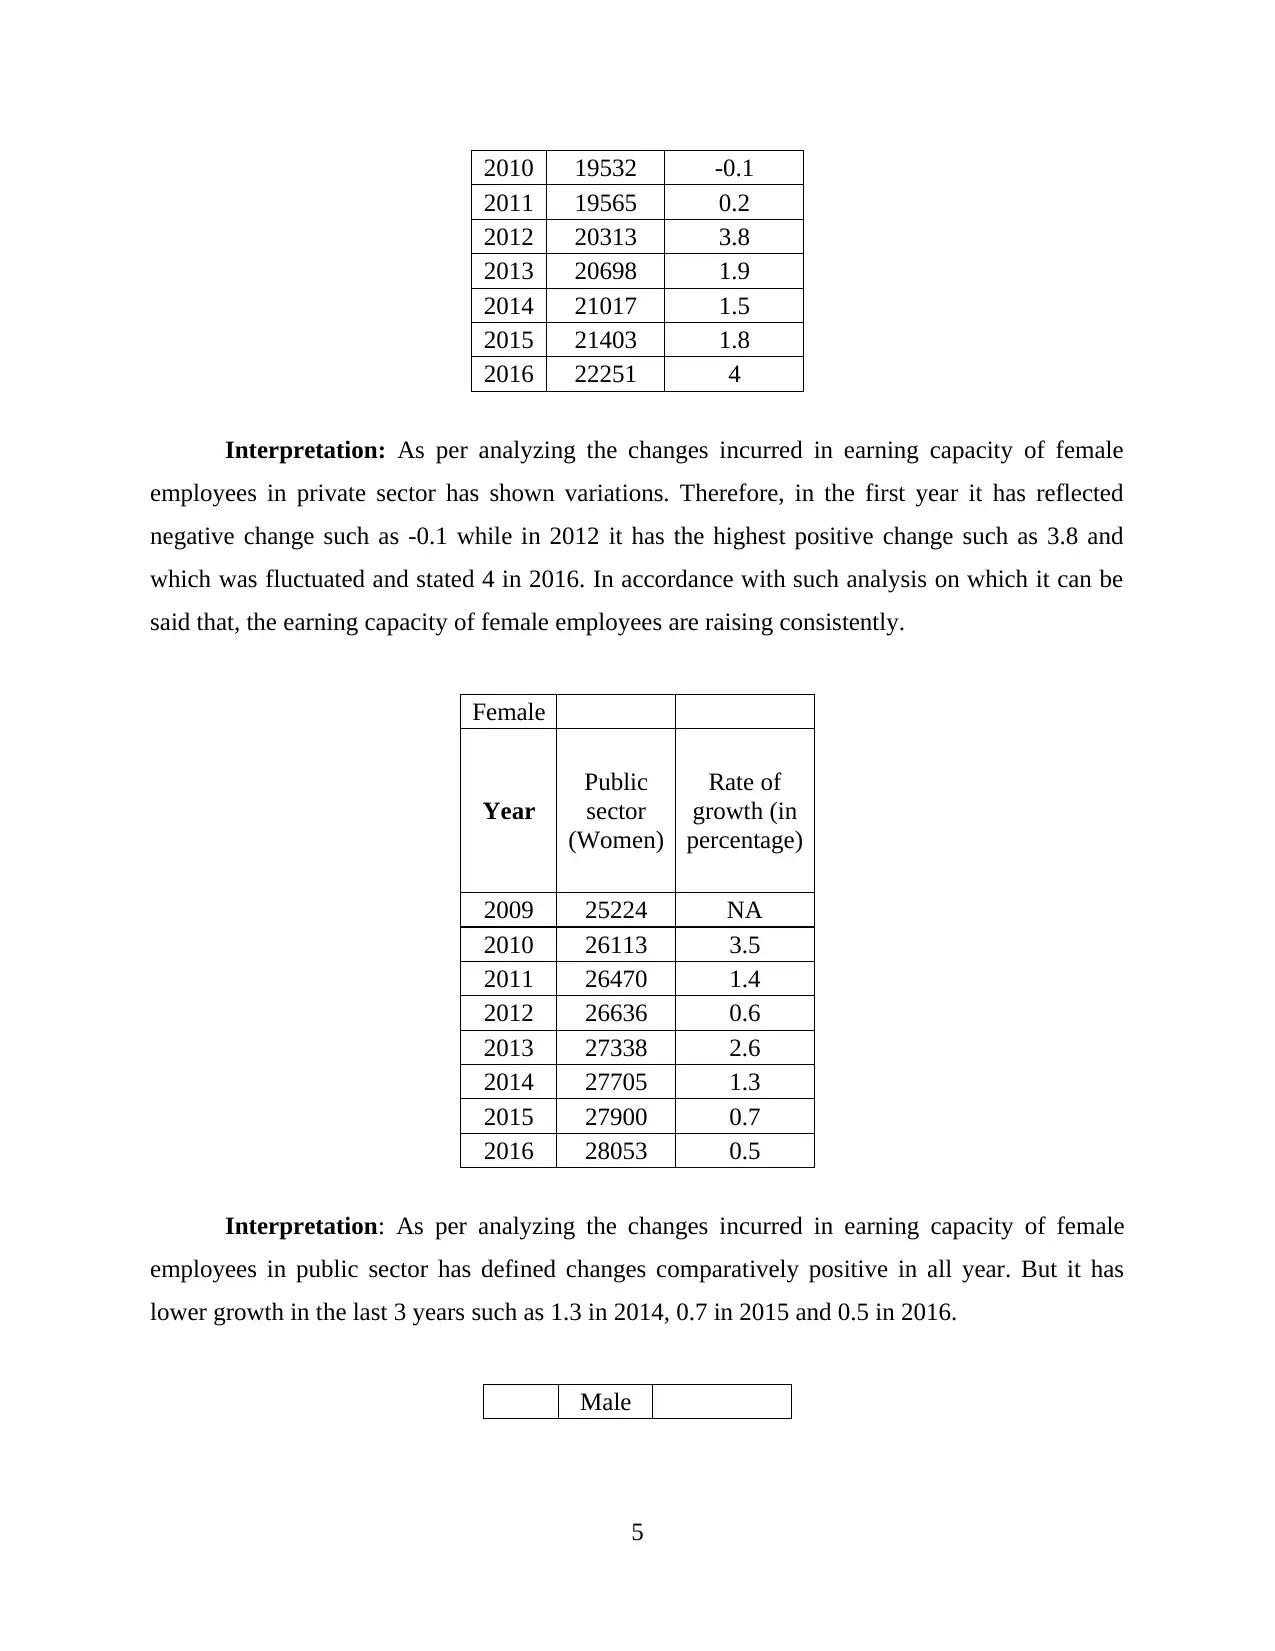
2010 19532 -0.1
2011 19565 0.2
2012 20313 3.8
2013 20698 1.9
2014 21017 1.5
2015 21403 1.8
2016 22251 4
Interpretation: As per analyzing the changes incurred in earning capacity of female
employees in private sector has shown variations. Therefore, in the first year it has reflected
negative change such as -0.1 while in 2012 it has the highest positive change such as 3.8 and
which was fluctuated and stated 4 in 2016. In accordance with such analysis on which it can be
said that, the earning capacity of female employees are raising consistently.
Female
Year
Public
sector
(Women)
Rate of
growth (in
percentage)
2009 25224 NA
2010 26113 3.5
2011 26470 1.4
2012 26636 0.6
2013 27338 2.6
2014 27705 1.3
2015 27900 0.7
2016 28053 0.5
Interpretation: As per analyzing the changes incurred in earning capacity of female
employees in public sector has defined changes comparatively positive in all year. But it has
lower growth in the last 3 years such as 1.3 in 2014, 0.7 in 2015 and 0.5 in 2016.
Male
5
Paraphrase This Document
Need a fresh take? Get an instant paraphrase of this document with our AI Paraphraser
Year
Private
sector
Rate of
growth (in
percentage)
(Men)
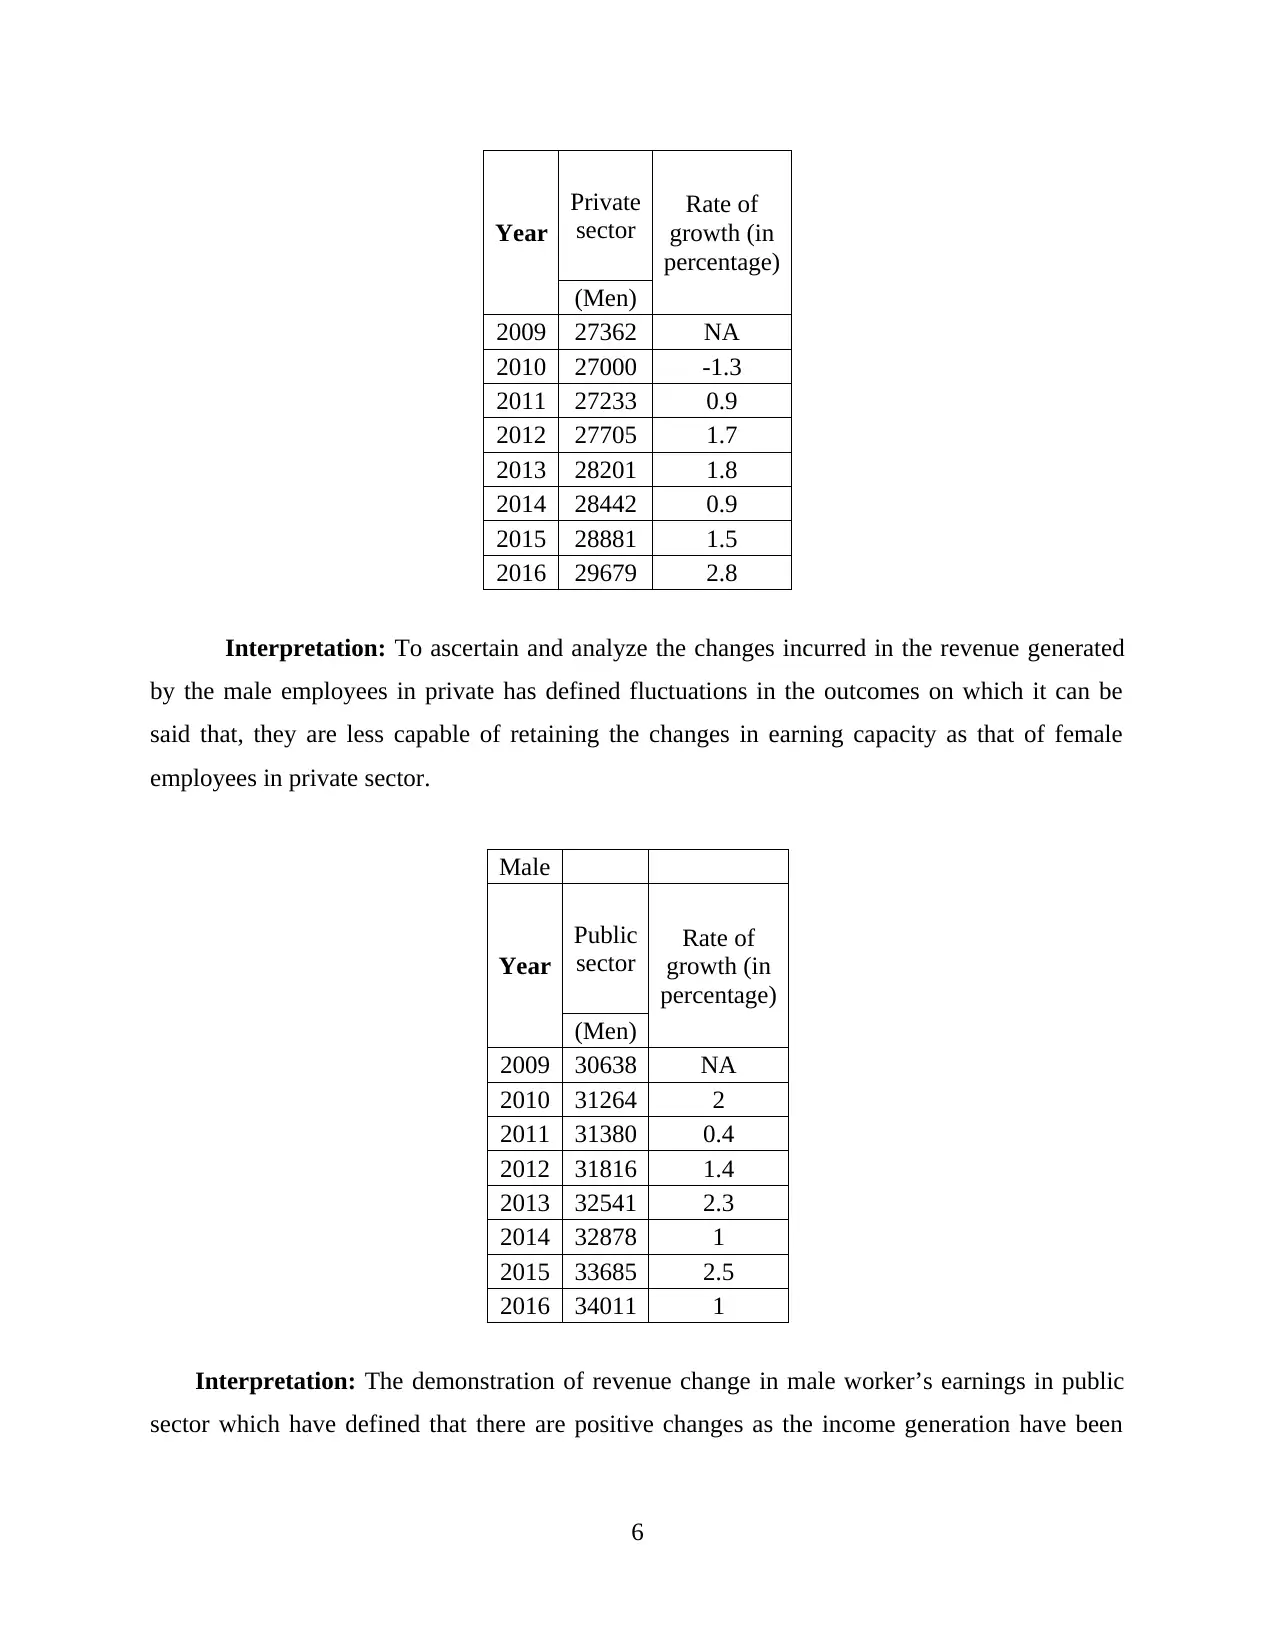
2009 27362 NA
2010 27000 -1.3
2011 27233 0.9
2012 27705 1.7
2013 28201 1.8
2014 28442 0.9
2015 28881 1.5
2016 29679 2.8
Interpretation: To ascertain and analyze the changes incurred in the revenue generated
by the male employees in private has defined fluctuations in the outcomes on which it can be
said that, they are less capable of retaining the changes in earning capacity as that of female
employees in private sector.
Male
Year
Public
sector
Rate of
growth (in
percentage)
(Men)
2009 30638 NA
2010 31264 2
2011 31380 0.4
2012 31816 1.4
2013 32541 2.3
2014 32878 1
2015 33685 2.5
2016 34011 1
Interpretation: The demonstration of revenue change in male worker’s earnings in public
sector which have defined that there are positive changes as the income generation have been
6
Private
sector
Rate of
growth (in
percentage)
(Men)
2009 27362 NA
2010 27000 -1.3
2011 27233 0.9
2012 27705 1.7
2013 28201 1.8
2014 28442 0.9
2015 28881 1.5
2016 29679 2.8
Interpretation: To ascertain and analyze the changes incurred in the revenue generated
by the male employees in private has defined fluctuations in the outcomes on which it can be
said that, they are less capable of retaining the changes in earning capacity as that of female
employees in private sector.
Male
Year
Public
sector
Rate of
growth (in
percentage)
(Men)
2009 30638 NA
2010 31264 2
2011 31380 0.4
2012 31816 1.4
2013 32541 2.3
2014 32878 1
2015 33685 2.5
2016 34011 1
Interpretation: The demonstration of revenue change in male worker’s earnings in public
sector which have defined that there are positive changes as the income generation have been
6
increasing in each year. Thus, it has a consistent increase in the revenue by male employees at
public sector.
TASK 2
1. Presenting Ogive chart in analysing the median hourly earnings and quartiles
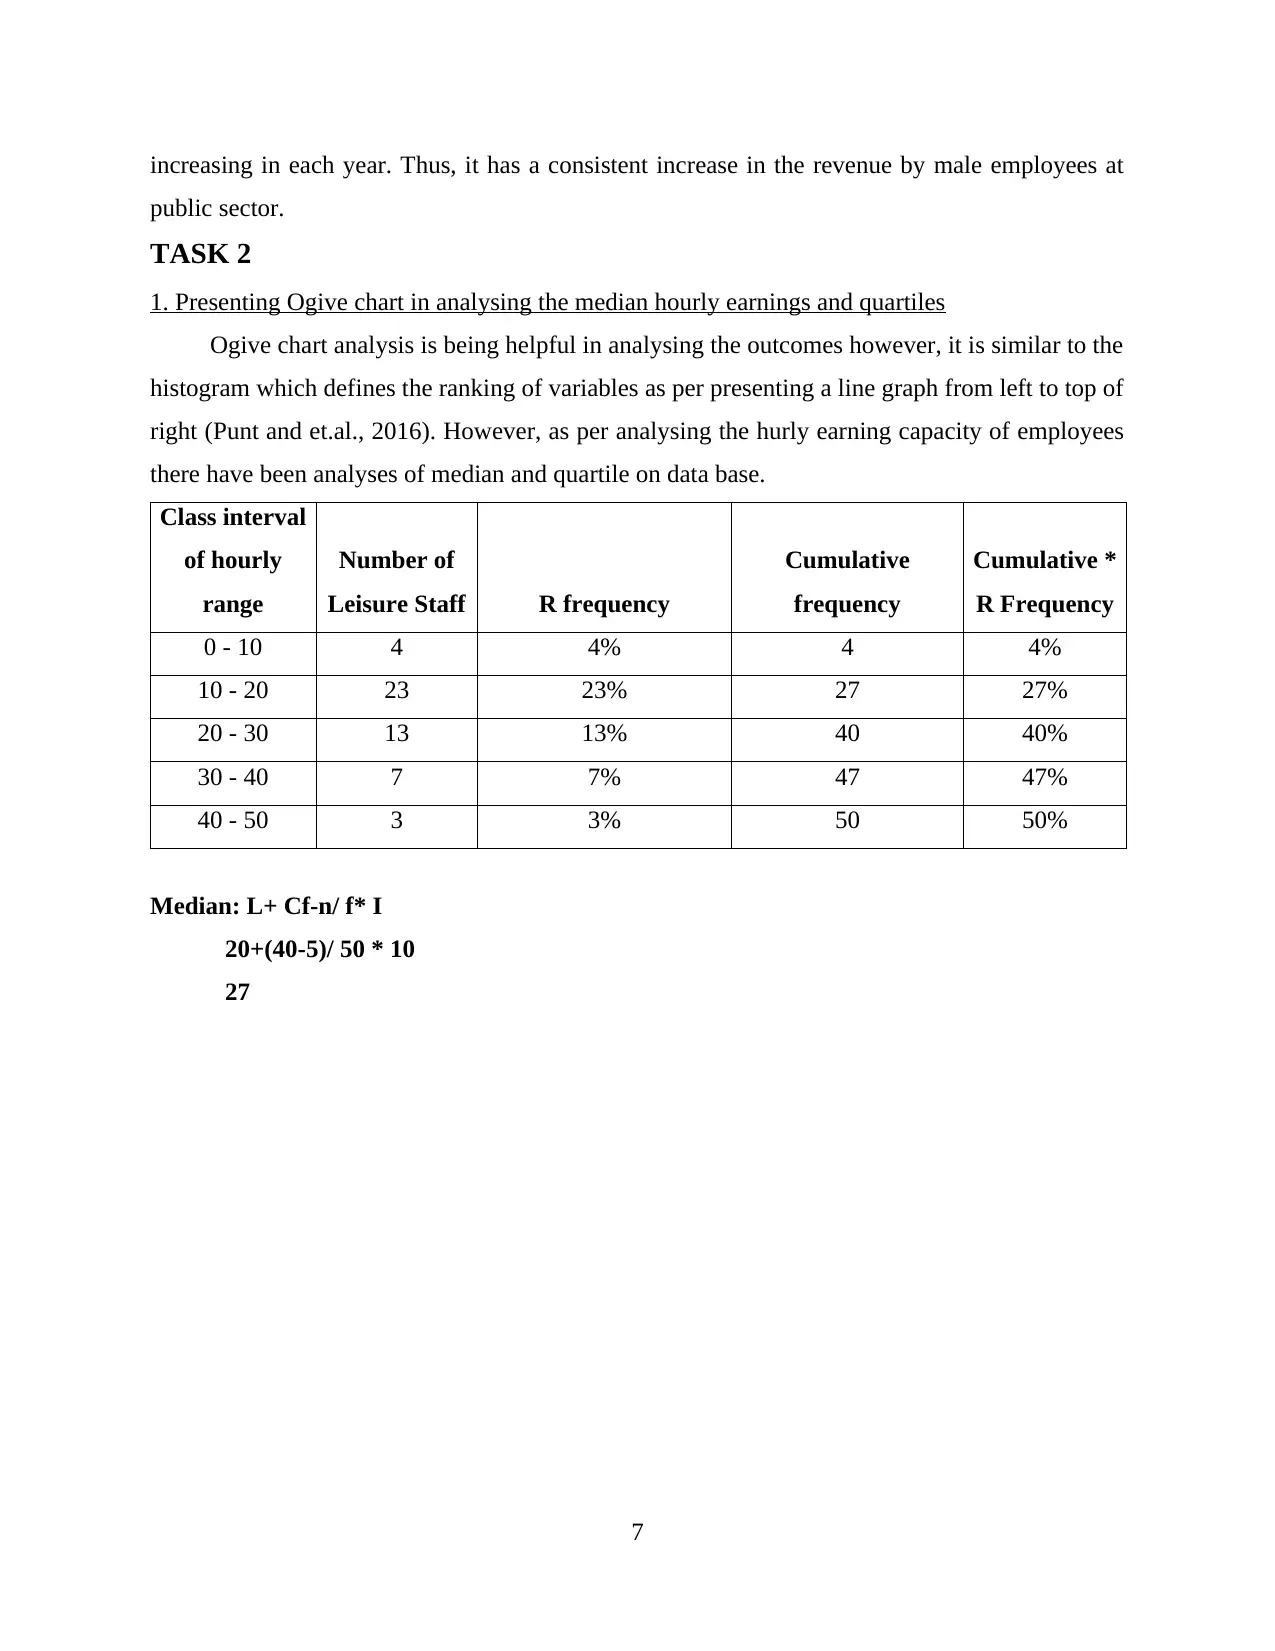
Ogive chart analysis is being helpful in analysing the outcomes however, it is similar to the
histogram which defines the ranking of variables as per presenting a line graph from left to top of
right (Punt and et.al., 2016). However, as per analysing the hurly earning capacity of employees
there have been analyses of median and quartile on data base.
Class interval
of hourly
range
Number of
Leisure Staff R frequency
Cumulative
frequency
Cumulative *
R Frequency
0 - 10 4 4% 4 4%
10 - 20 23 23% 27 27%
20 - 30 13 13% 40 40%
30 - 40 7 7% 47 47%
40 - 50 3 3% 50 50%
Median: L+ Cf-n/ f* I
20+(40-5)/ 50 * 10
27
7
public sector.
TASK 2
1. Presenting Ogive chart in analysing the median hourly earnings and quartiles
Ogive chart analysis is being helpful in analysing the outcomes however, it is similar to the
histogram which defines the ranking of variables as per presenting a line graph from left to top of
right (Punt and et.al., 2016). However, as per analysing the hurly earning capacity of employees
there have been analyses of median and quartile on data base.
Class interval
of hourly
range
Number of
Leisure Staff R frequency
Cumulative
frequency
Cumulative *
R Frequency
0 - 10 4 4% 4 4%
10 - 20 23 23% 27 27%
20 - 30 13 13% 40 40%
30 - 40 7 7% 47 47%
40 - 50 3 3% 50 50%
Median: L+ Cf-n/ f* I
20+(40-5)/ 50 * 10
27
7
⊘ This is a preview!⊘
Do you want full access?
Subscribe today to unlock all pages.
Trusted by 1+ million students worldwide
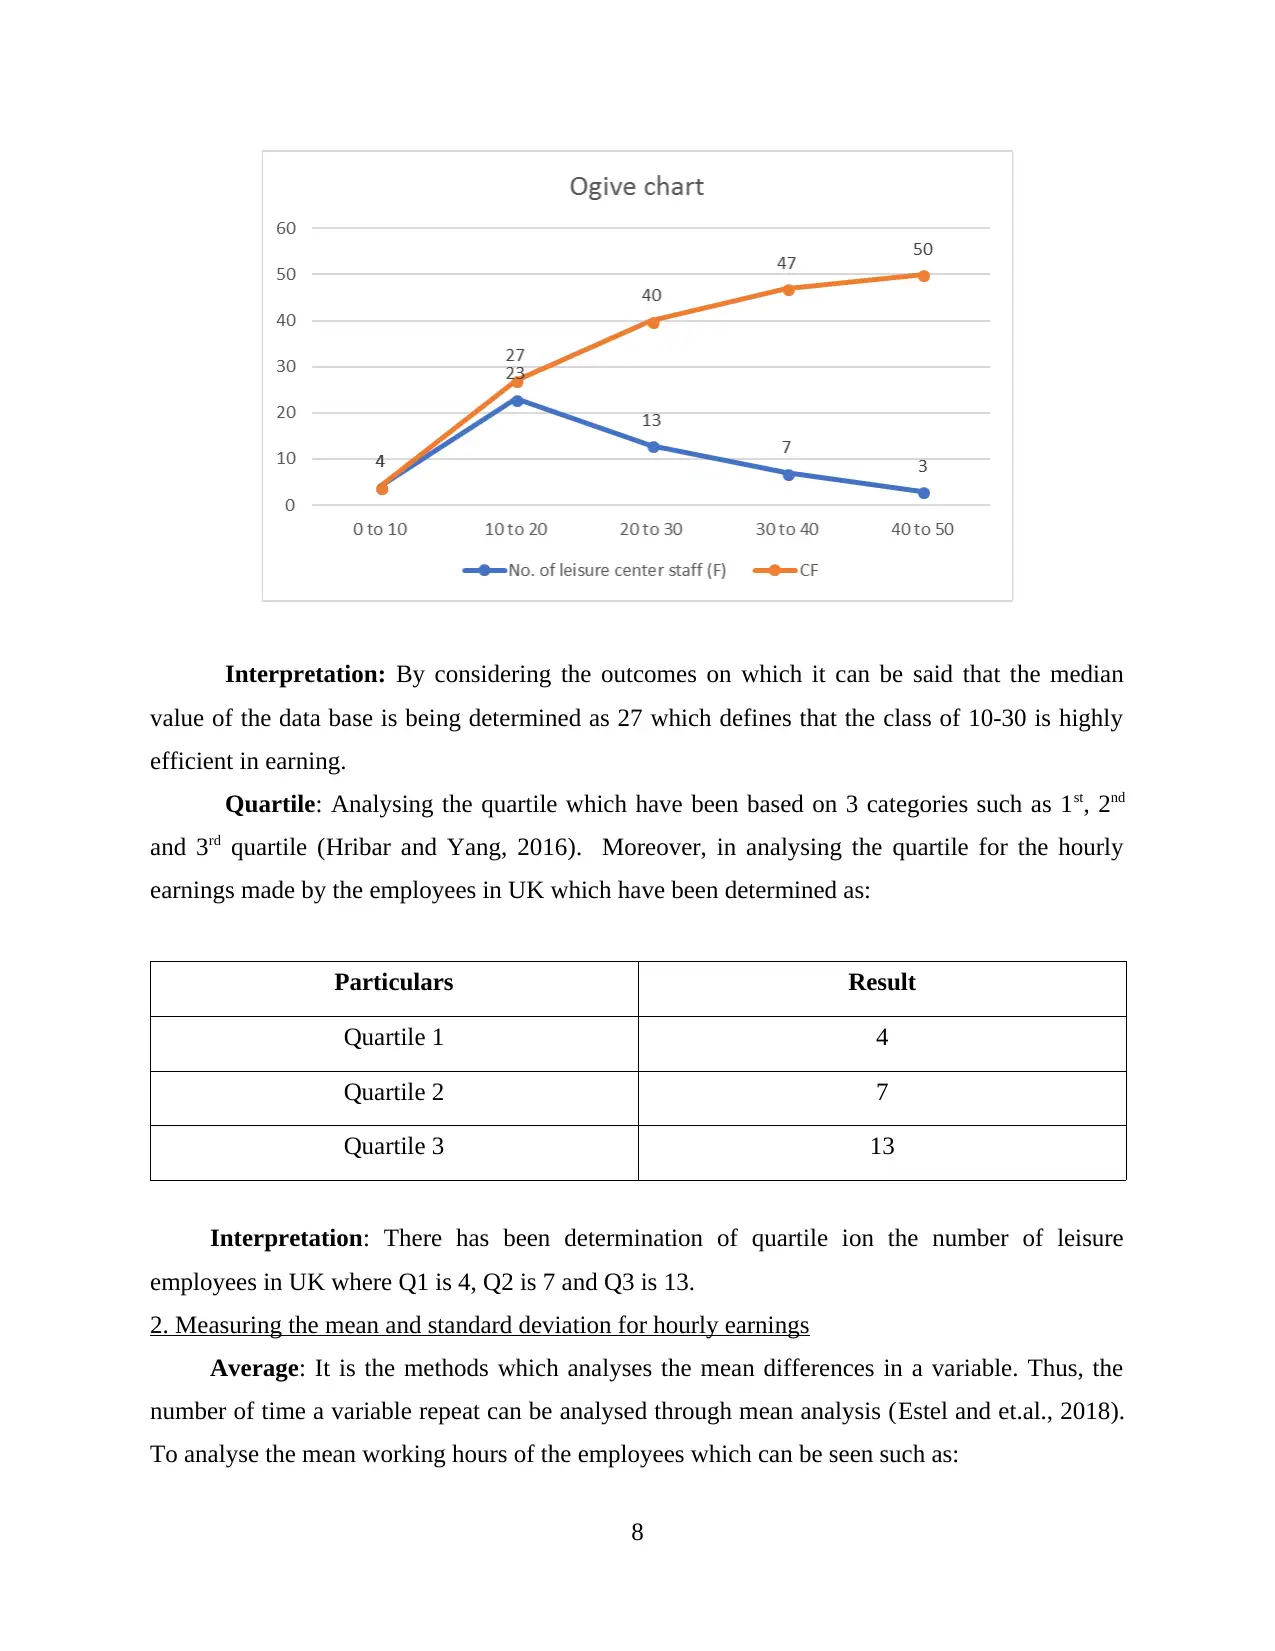
Interpretation: By considering the outcomes on which it can be said that the median
value of the data base is being determined as 27 which defines that the class of 10-30 is highly
efficient in earning.
Quartile: Analysing the quartile which have been based on 3 categories such as 1st, 2nd
and 3rd quartile (Hribar and Yang, 2016). Moreover, in analysing the quartile for the hourly
earnings made by the employees in UK which have been determined as:
Particulars Result
Quartile 1 4
Quartile 2 7
Quartile 3 13
Interpretation: There has been determination of quartile ion the number of leisure
employees in UK where Q1 is 4, Q2 is 7 and Q3 is 13.
2. Measuring the mean and standard deviation for hourly earnings
Average: It is the methods which analyses the mean differences in a variable. Thus, the
number of time a variable repeat can be analysed through mean analysis (Estel and et.al., 2018).
To analyse the mean working hours of the employees which can be seen such as:
8
Paraphrase This Document
Need a fresh take? Get an instant paraphrase of this document with our AI Paraphraser
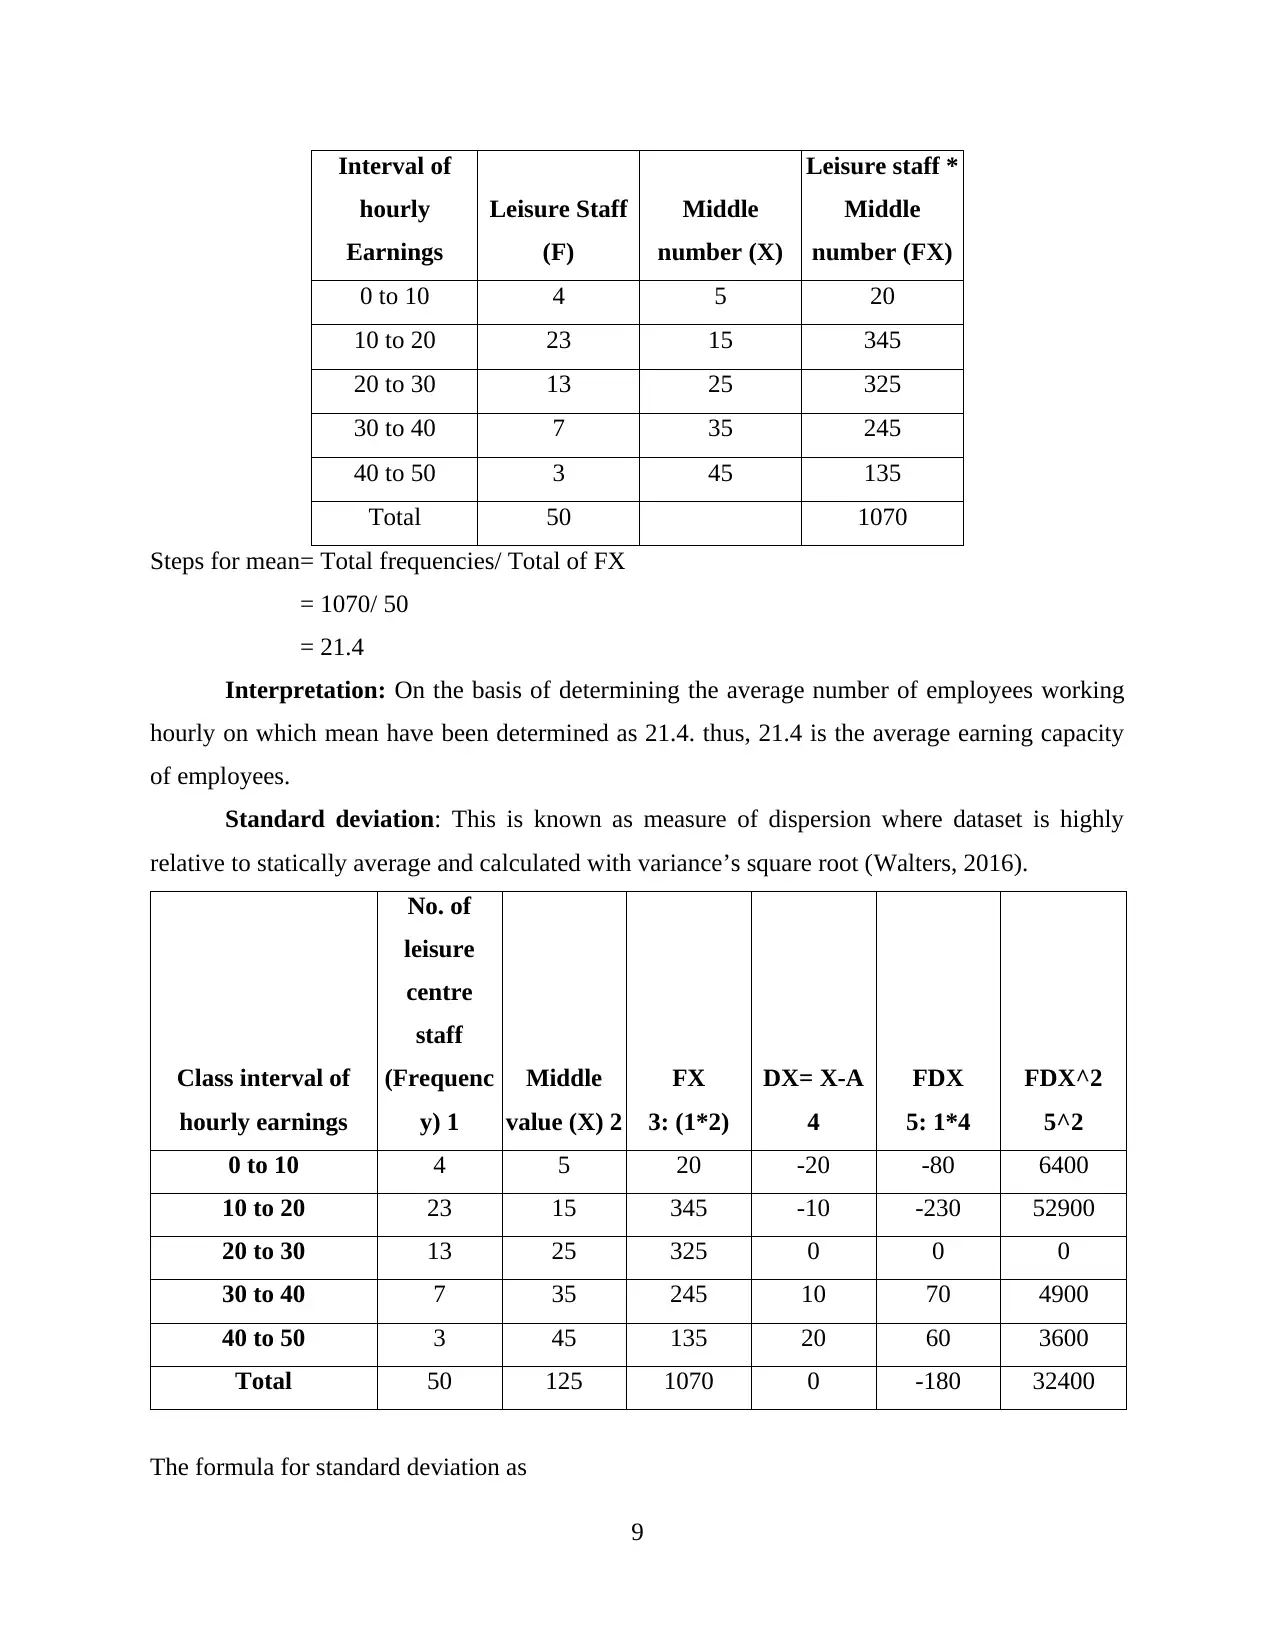
Interval of
hourly
Earnings
Leisure Staff
(F)
Middle
number (X)
Leisure staff *
Middle
number (FX)
0 to 10 4 5 20
10 to 20 23 15 345
20 to 30 13 25 325
30 to 40 7 35 245
40 to 50 3 45 135
Total 50 1070
Steps for mean= Total frequencies/ Total of FX
= 1070/ 50
= 21.4
Interpretation: On the basis of determining the average number of employees working
hourly on which mean have been determined as 21.4. thus, 21.4 is the average earning capacity
of employees.
Standard deviation: This is known as measure of dispersion where dataset is highly
relative to statically average and calculated with variance’s square root (Walters, 2016).
Class interval of
hourly earnings
No. of
leisure
centre
staff
(Frequenc
y) 1
Middle
value (X) 2
FX
3: (1*2)
DX= X-A
4
FDX
5: 1*4
FDX^2
5^2
0 to 10 4 5 20 -20 -80 6400
10 to 20 23 15 345 -10 -230 52900
20 to 30 13 25 325 0 0 0
30 to 40 7 35 245 10 70 4900
40 to 50 3 45 135 20 60 3600
Total 50 125 1070 0 -180 32400
The formula for standard deviation as
9
√ƸFdx^2/N - (ƸFdx/ N)^2
as numerically it is
√32400/ 50 -(-180/50)^2
which gave outcome of 10.15.
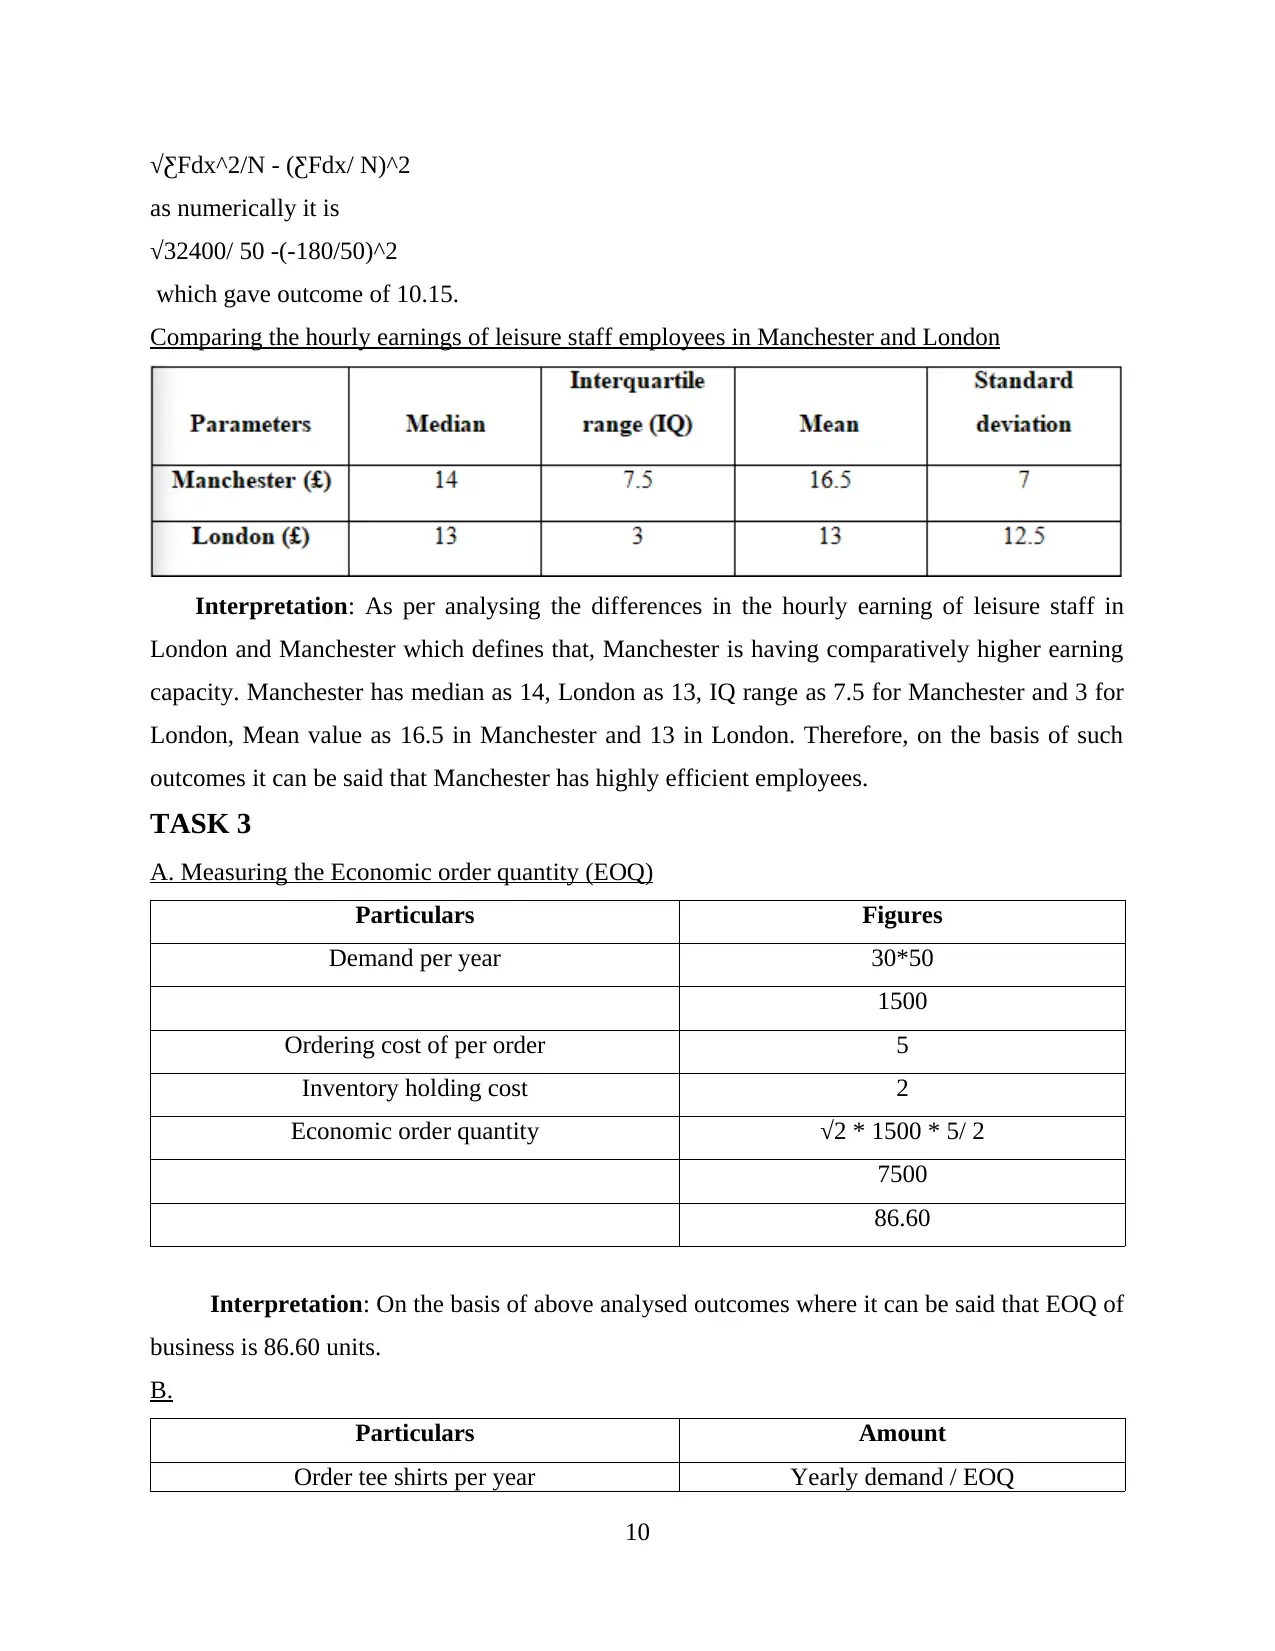
Comparing the hourly earnings of leisure staff employees in Manchester and London
Interpretation: As per analysing the differences in the hourly earning of leisure staff in
London and Manchester which defines that, Manchester is having comparatively higher earning
capacity. Manchester has median as 14, London as 13, IQ range as 7.5 for Manchester and 3 for
London, Mean value as 16.5 in Manchester and 13 in London. Therefore, on the basis of such
outcomes it can be said that Manchester has highly efficient employees.
TASK 3
A. Measuring the Economic order quantity (EOQ)
Particulars Figures
Demand per year 30*50
1500
Ordering cost of per order 5
Inventory holding cost 2
Economic order quantity √2 * 1500 * 5/ 2
7500
86.60
Interpretation: On the basis of above analysed outcomes where it can be said that EOQ of
business is 86.60 units.
B.
Particulars Amount
Order tee shirts per year Yearly demand / EOQ
10
as numerically it is
√32400/ 50 -(-180/50)^2
which gave outcome of 10.15.
Comparing the hourly earnings of leisure staff employees in Manchester and London
Interpretation: As per analysing the differences in the hourly earning of leisure staff in
London and Manchester which defines that, Manchester is having comparatively higher earning
capacity. Manchester has median as 14, London as 13, IQ range as 7.5 for Manchester and 3 for
London, Mean value as 16.5 in Manchester and 13 in London. Therefore, on the basis of such
outcomes it can be said that Manchester has highly efficient employees.
TASK 3
A. Measuring the Economic order quantity (EOQ)
Particulars Figures
Demand per year 30*50
1500
Ordering cost of per order 5
Inventory holding cost 2
Economic order quantity √2 * 1500 * 5/ 2
7500
86.60
Interpretation: On the basis of above analysed outcomes where it can be said that EOQ of
business is 86.60 units.
B.
Particulars Amount
Order tee shirts per year Yearly demand / EOQ
10
⊘ This is a preview!⊘
Do you want full access?
Subscribe today to unlock all pages.
Trusted by 1+ million students worldwide
1 out of 15
Related Documents


Your All-in-One AI-Powered Toolkit for Academic Success.
+13062052269
info@desklib.com
Available 24*7 on WhatsApp / Email
![[object Object]](/_next/static/media/star-bottom.7253800d.svg)
Unlock your academic potential
Copyright © 2020–2026 A2Z Services. All Rights Reserved. Developed and managed by ZUCOL.