Statistics Assignment: Regression Analysis and Data Interpretation
VerifiedAdded on  2022/09/02
|9
|784
|14
Homework Assignment
AI Summary
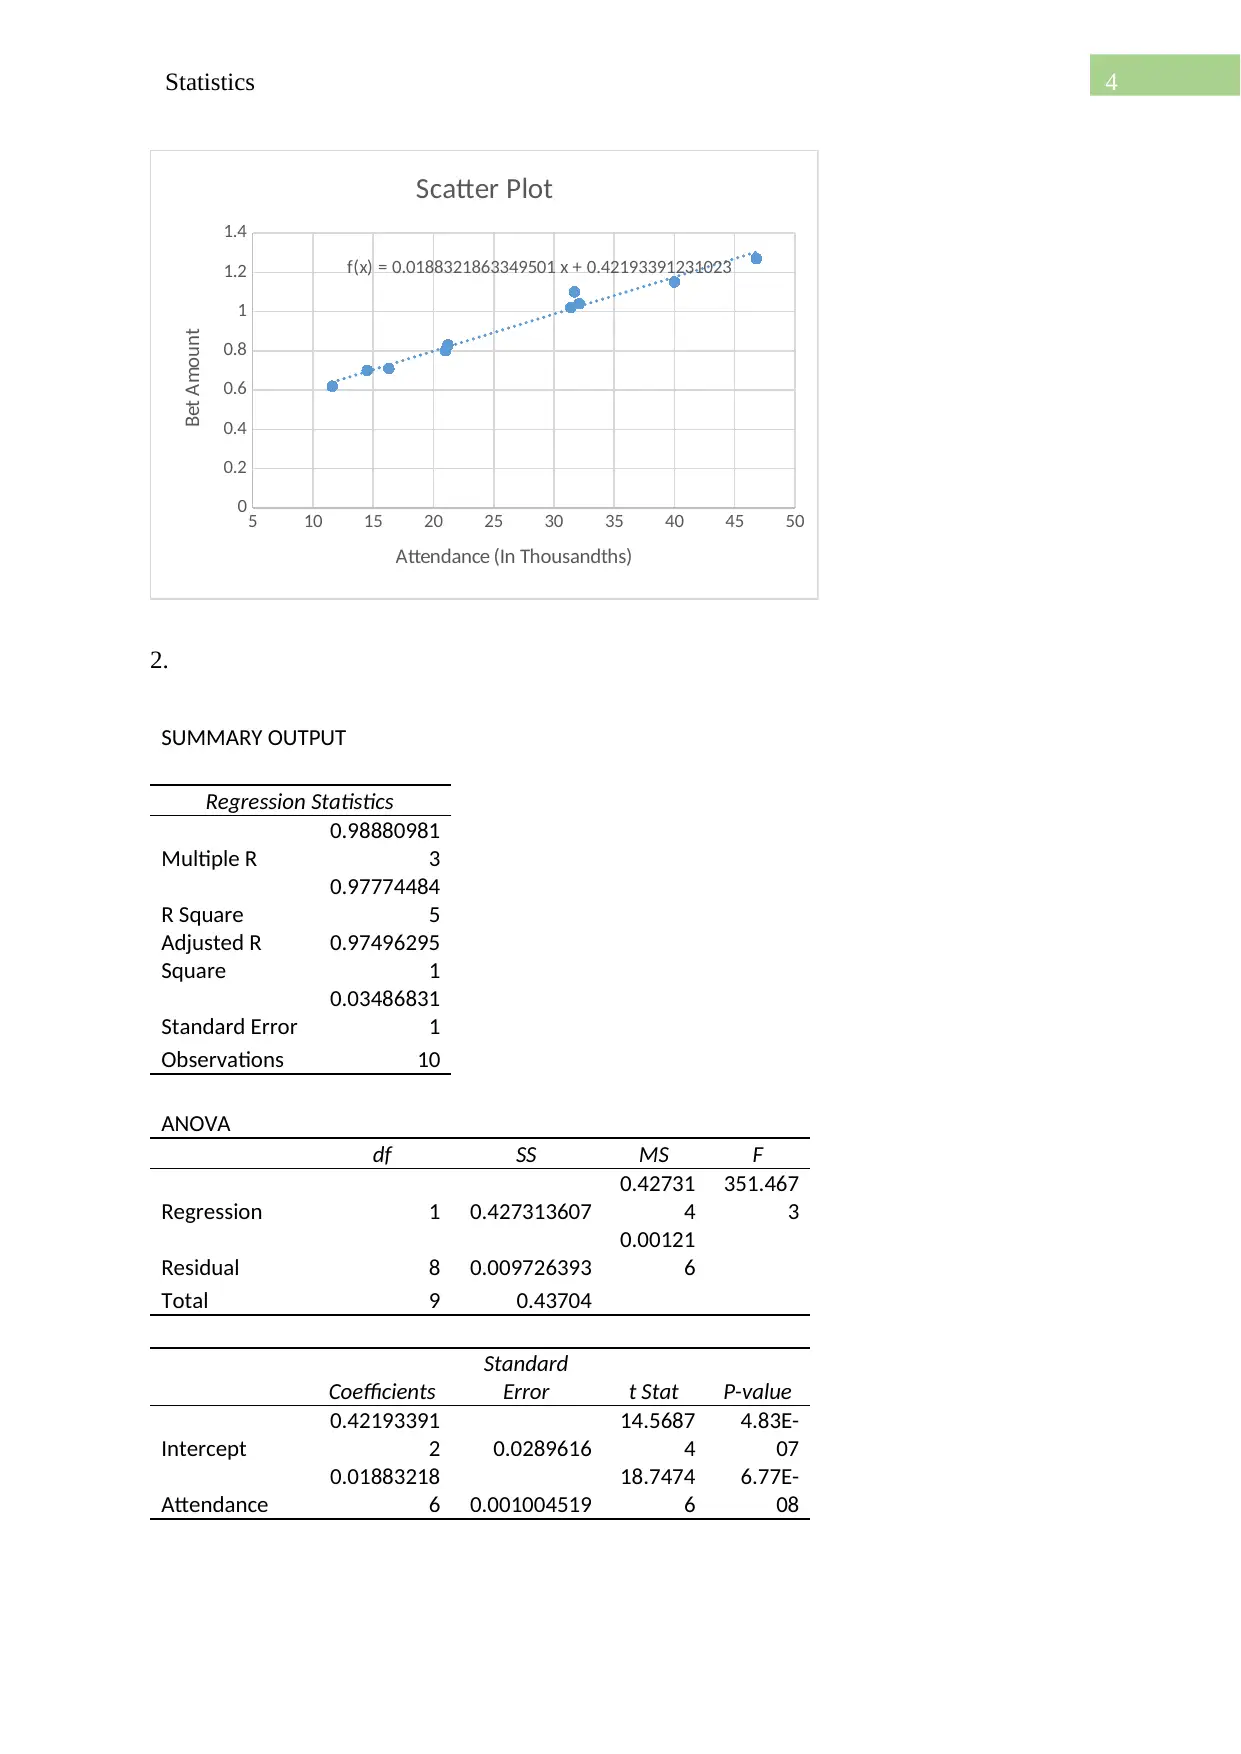
This statistics assignment analyzes two key areas: educational attainment and betting behavior, using regression analysis. The first part explores factors influencing educational attainment, including GPA as a dependent variable, potential independent variables like gender, socioeconomic background, and ethnicity, and how these variables could be tested in an ideal scenario. The second part focuses on a dataset of betting amounts and attendance at a horse track, using regression output to interpret coefficients, assess statistical significance, construct confidence intervals, evaluate model fit (R-squared), and make predictions. The assignment also touches upon model validity, measurement errors, and the influence of additional variables on the model's predictive power, providing a comprehensive understanding of statistical modeling and data interpretation.

Running head: Statistics
Statistics
Name of the Student
Name of the University
Statistics
Name of the Student
Name of the University
Paraphrase This Document
Need a fresh take? Get an instant paraphrase of this document with our AI Paraphraser

2Statistics

3Statistics
Q1.
a)
GPA can be a good indicator of educational attainment
b)
The data can be collected by selecting a few schools at random and accessing the grade sheets
of the college.
c)
Independent variables that might be useful predictors are:
1. Gender
2. Parental Educational Level
3. Economic Background
4. Social Media Usage
5. Ethnicity
d)
In a perfect setting, gender can be tested against the gpa attained to see if there is a difference
in educational performance across gender.
2.
1.
⊘ This is a preview!⊘
Do you want full access?
Subscribe today to unlock all pages.

Trusted by 1+ million students worldwide

4Statistics
5 10 15 20 25 30 35 40 45 50
0
0.2
0.4
0.6
0.8
1
1.2
1.4
f(x) = 0.0188321863349501 x + 0.42193391231023
Scatter Plot
Attendance (In Thousandths)
Bet Amount
2.
SUMMARY OUTPUT
Regression Statistics
Multiple R
0.98880981
3
R Square
0.97774484
5
Adjusted R
Square
0.97496295
1
Standard Error
0.03486831
1
Observations 10
ANOVA
df SS MS F
Regression 1 0.427313607
0.42731
4
351.467
3
Residual 8 0.009726393
0.00121
6
Total 9 0.43704
Coefficients
Standard
Error t Stat P-value
Intercept
0.42193391
2 0.0289616
14.5687
4
4.83E-
07
Attendance
0.01883218
6 0.001004519
18.7474
6
6.77E-
08
Paraphrase This Document
Need a fresh take? Get an instant paraphrase of this document with our AI Paraphraser

5Statistics
a)
The intercept Bo represents the amount of betting that might be done had there been no
attendance.
The slope B1 = 0.02 represents that for ever increase of 20 in attendance the betting amount
increases by 1 unit i.e 1 million dollar.
b)
1. p value for B1 = 0 ( approx.) which is less than 0.05 and therefore is statistically significant
2. 95 % CI for B1 = (0.01,.02). Thus the null hypothesis that B1 is 0 can be rejected as 0 does
not fall within the range of the CI.
c)
Yes, most of the data points fit the regression line well.
d)
97.77 % of the variation in bets can be explained by attendance
e)
The equation is, y = 0.019x+0.422
At x = 10000, y = 188.74
That is 188.75 million dollars will be bet on that day.

6Statistics
Q3.
a)
GPA for a white female varsity athlete with a 470 on her verbal SAT and 510 on her math SAT:
1.82 +.094*1-.111*1+470*.13+510*.088 = 107.783
b)
95% confidence interval for the Varsity Athlete variable :
c)
The R squared for the model is .266 which means that 26.6 % of the variability of the GPA is
explained by the variability of the independent variable.
The low p value mean that all the independent variables contribute positively to the model.
d)
The presence of previous study records and information on any side jobs performed by the
student can make the model better.
e)
There might be measurement error issues as the R squared value is low. The external validity
of the model depends on the type of sampling done and where it is done. However college
students everywhere will show some similar tendencies.
4.
a)
The GPA can be modelled and the variables that contribute towards predicting the GPA are
Age Age at entry to SPP in years
⊘ This is a preview!⊘
Do you want full access?
Subscribe today to unlock all pages.

Trusted by 1+ million students worldwide

7Statistics
Res 1= Maryland 0= Not Maryland
GREQ GRE Quantitative Score
UMCP 1= Undergraduate at UMD 0 = Not Undergraduate at UMD
All of these have p value less than 0.05.
b)
For age, the coefficient .0176 means that, keeping the other variables constant, increase in Age by 1
year increases the GPA by 1/ .0176 = 56.81 points.
With 95% CI it can be said that, keeping the other variables constant, the coefficient for the age
variable reflects the true coefficient in the population and it lies between (.003 to .006)
c)
No the increase in gpa with increase in age only matters in the context of an university. In case of
senior citizen the other control variables may be changed to cause the gpa to decline.
Q5.
a)
SUMMARY OUTPUT
Regression Statistics
Multiple R
0.34155820
8
R Square
0.11666200
9
Adjusted R Square
0.10764835
6
Standard Error
8824.89174
6
Observations 100
ANOVA
df SS MS F
Regression 1 1007969503 1007969503
12.9428112
9
Paraphrase This Document
Need a fresh take? Get an instant paraphrase of this document with our AI Paraphraser

8Statistics
Residual 98 7632114004
77878714.3
3
Total 99 8640083507
Coefficients
Standard
Error t Stat P-value
Intercept
-
1901.34382
9 5282.464249
-
0.35993501
1
0.71967025
2
Student/Faculty
Ratio
1129.42639
1 313.9378083
3.59761188
8
0.00050545
8
b)
The R squared value for the model is 1.16 which means that there is very little explanatory power of
this model.
c)
0 5000 10000 15000 20000 25000 30000 35000 40000 45000
0
5
10
15
20
25
30
f(x) = 0.000103293149797858 x + 14.8509730569072
Student/Faculty Ratio
d)

9Statistics
References:
Groebner, D.F., Shannon, P.W., Fry, P.C. and Smith, K.D., 2013. Business statistics. Pearson
Education UK.
Black, K., 2009. Business statistics: Contemporary decision making. John Wiley & Sons.
References:
Groebner, D.F., Shannon, P.W., Fry, P.C. and Smith, K.D., 2013. Business statistics. Pearson
Education UK.
Black, K., 2009. Business statistics: Contemporary decision making. John Wiley & Sons.
⊘ This is a preview!⊘
Do you want full access?
Subscribe today to unlock all pages.

Trusted by 1+ million students worldwide
1 out of 9
Related Documents

Your All-in-One AI-Powered Toolkit for Academic Success.
 +13062052269
info@desklib.com
Available 24*7 on WhatsApp / Email
Unlock your academic potential
Copyright © 2020–2025 A2Z Services. All Rights Reserved. Developed and managed by ZUCOL.