ENG2110 Statistics & Empirical Methods: Hypothesis Testing & Analysis

Verified

Added on  2023/05/29

|6
|1041
|457
Homework Assignment
AI Summary
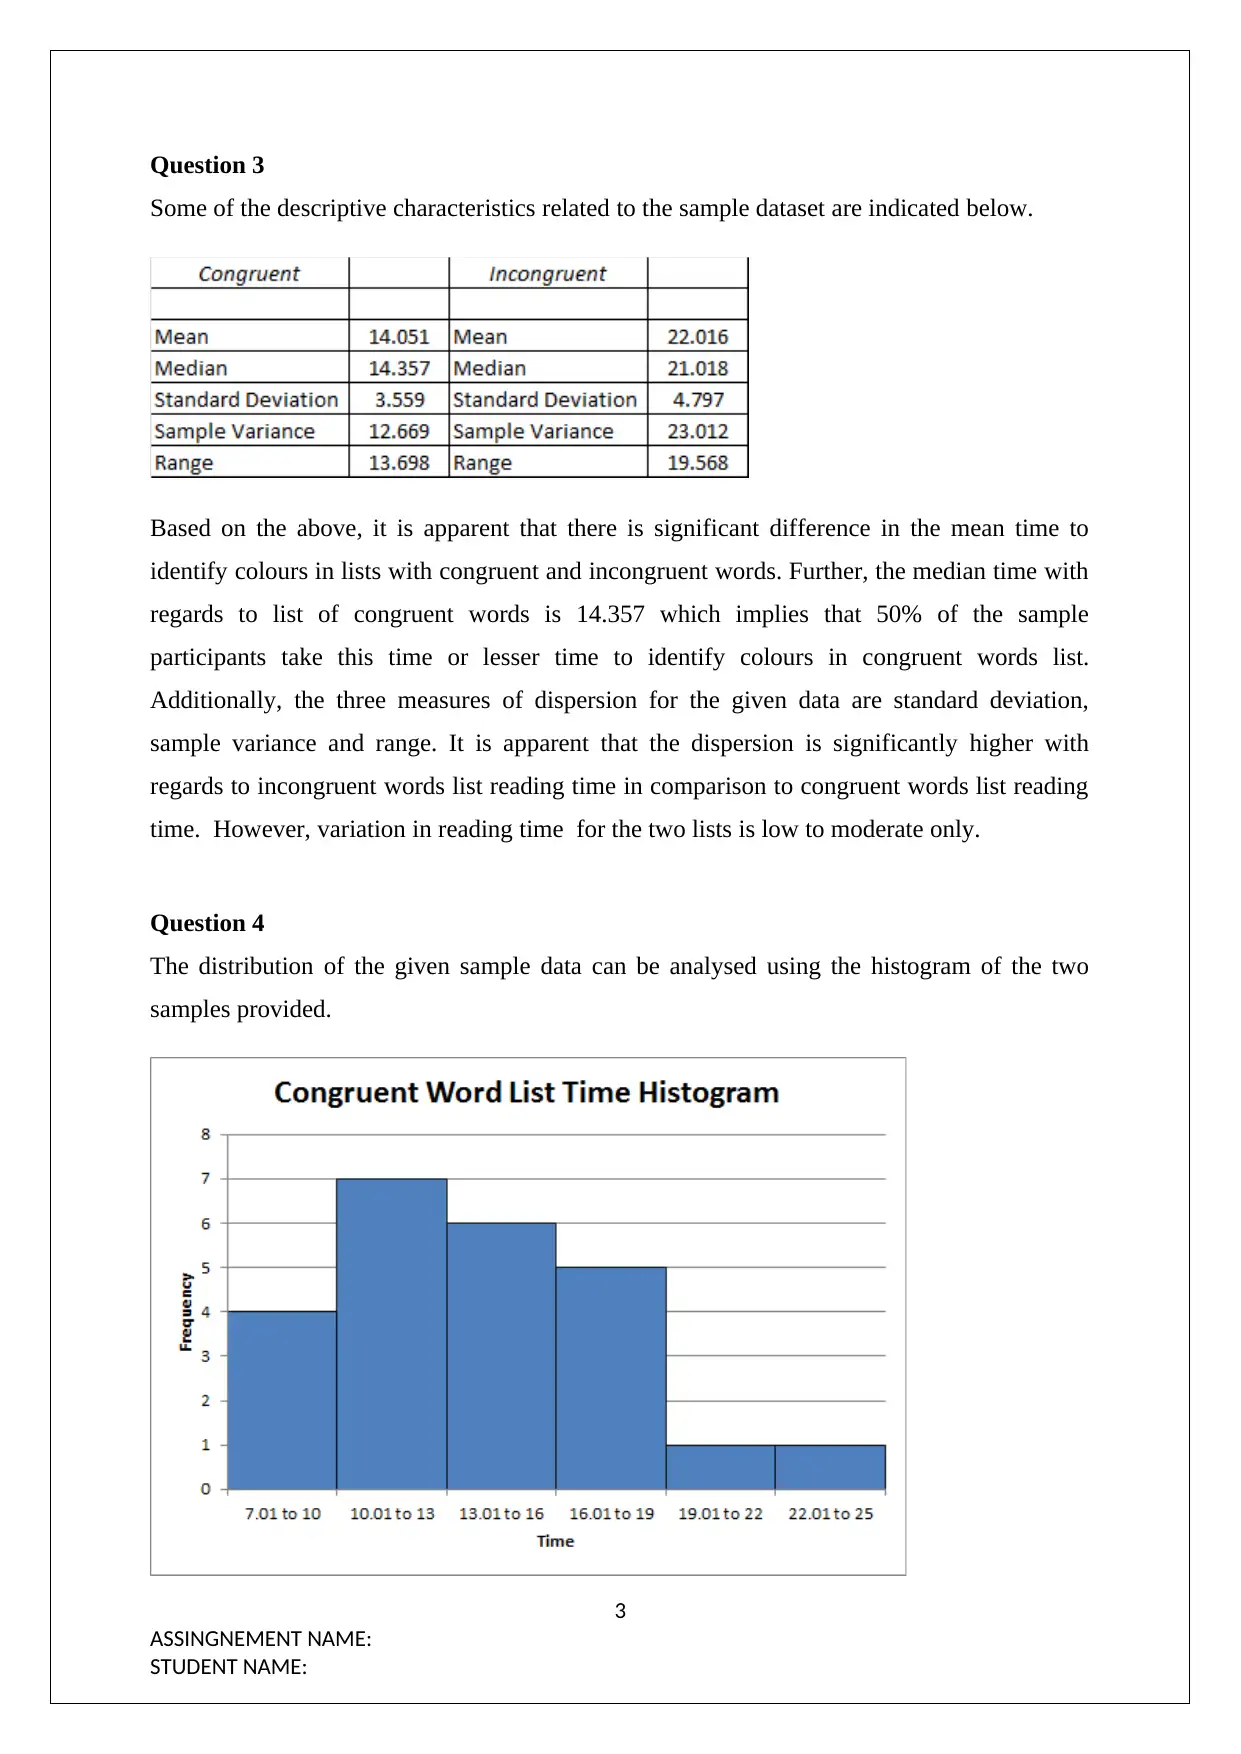
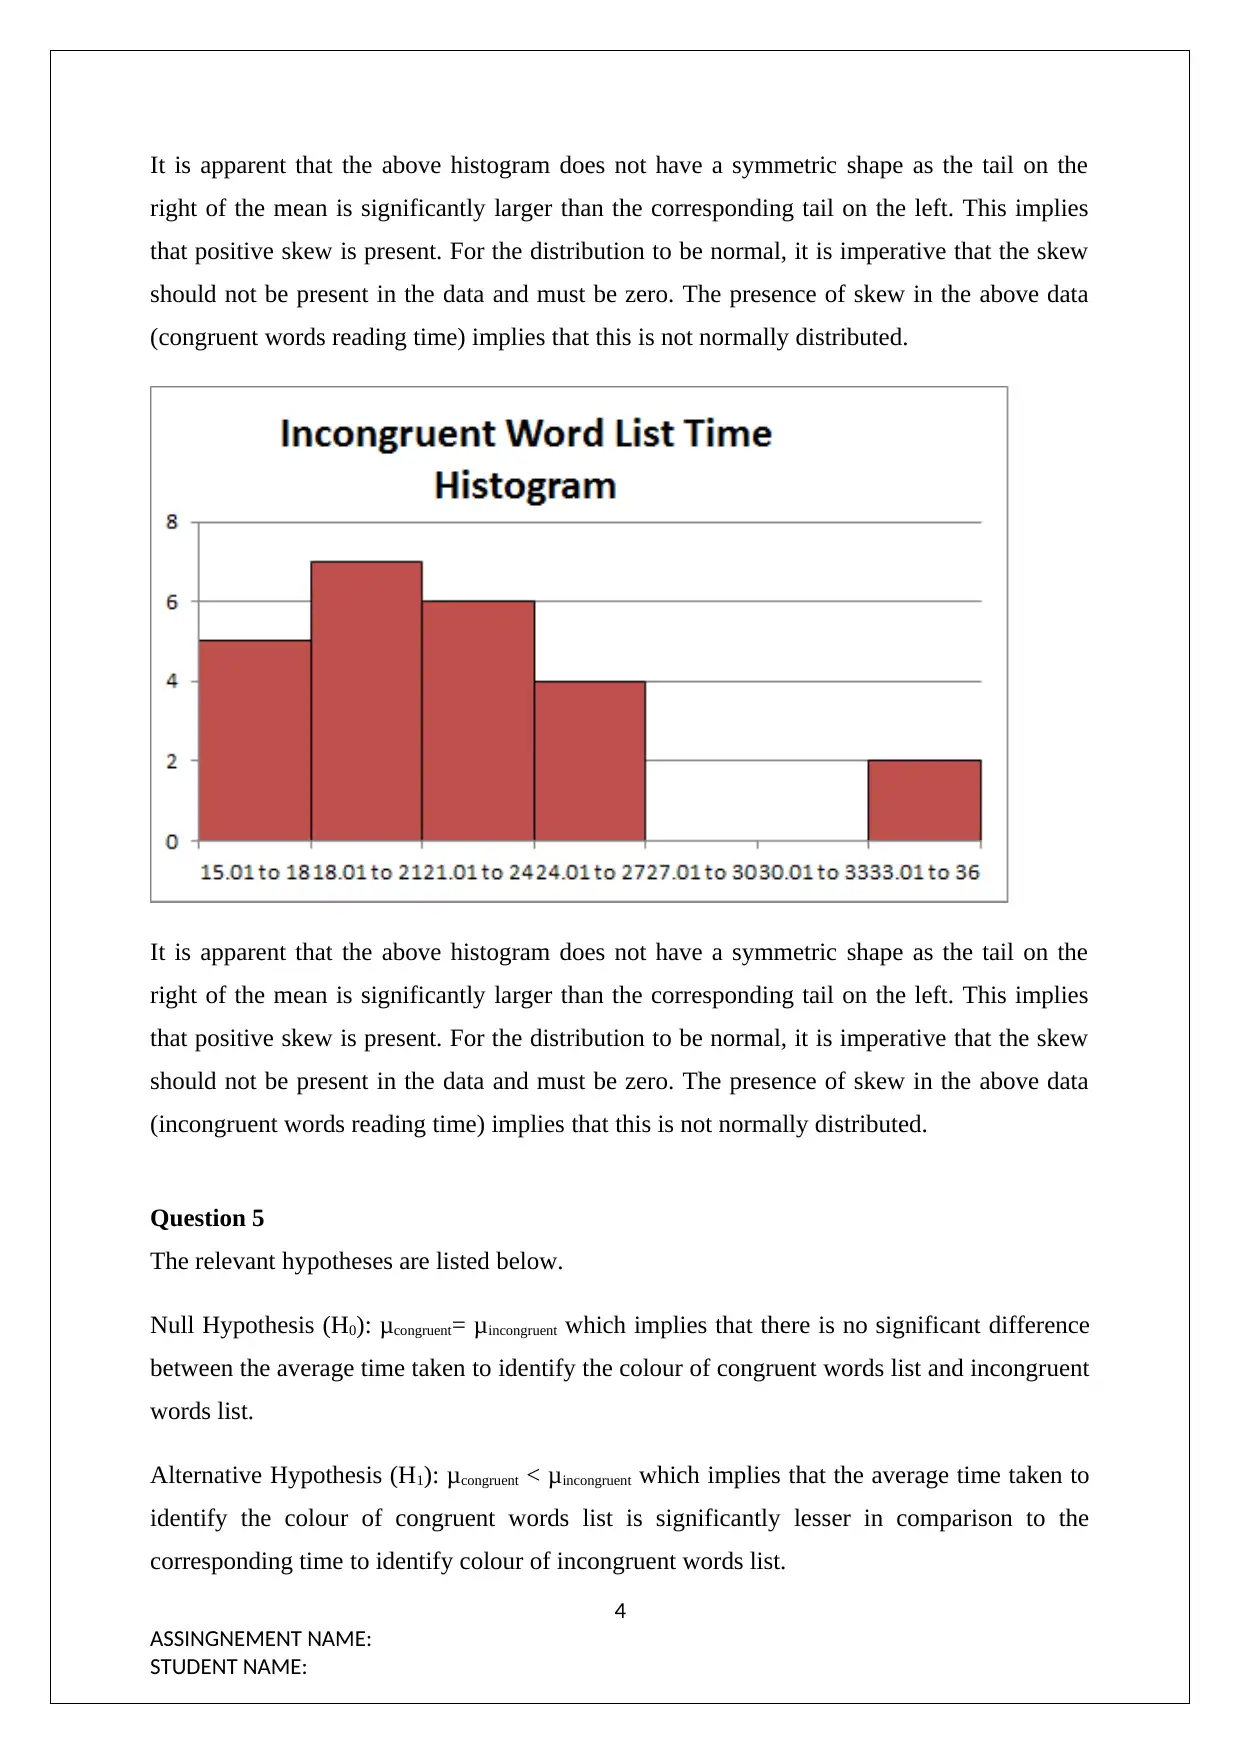
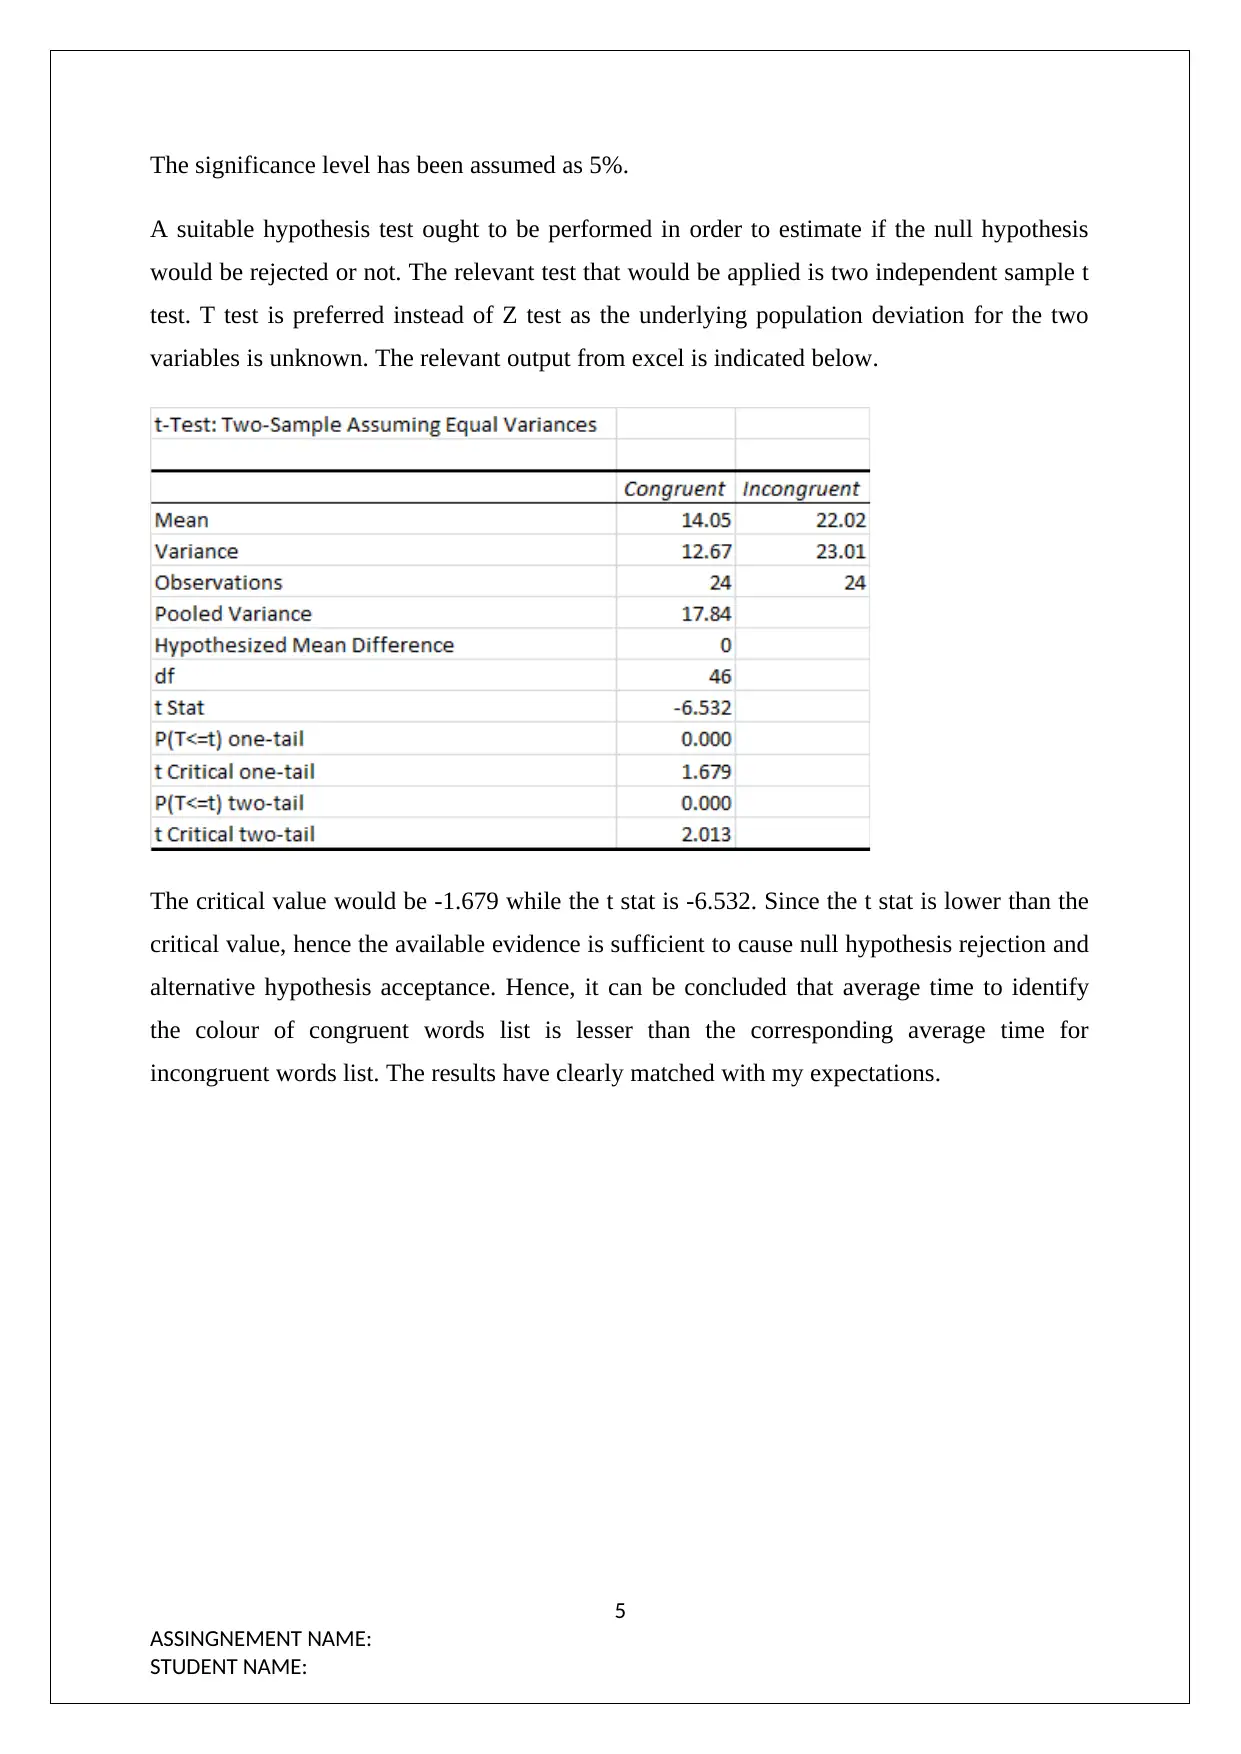
This assignment delves into statistical analysis and empirical methods, focusing on a Stroop task involving congruent and incongruent words. It identifies dependent and independent variables, formulates null and alternative hypotheses, and justifies the use of a two-independent sample t-test. Descriptive statistics, including mean, median, standard deviation, variance, and range, are analyzed to understand the data's characteristics. Histograms are used to assess the distribution of the data, revealing positive skew and non-normality. Finally, a t-test is conducted to test the hypothesis, leading to the rejection of the null hypothesis and supporting the conclusion that congruent words are identified faster than incongruent words. Desklib provides access to similar solved assignments and study tools.
Document Page
STATISTICS AND EMPIRICAL METHODS
STUDENT ID:
[Pick the date]
tabler-icon-diamond-filled.svg

Paraphrase This Document

Need a fresh take? Get an instant paraphrase of this document with our AI Paraphraser
Document Page
TABLE OF CONTENTS
Introduction................................................................................................................................2
Question 1..................................................................................................................................2
Question 2..................................................................................................................................2
Question 3..................................................................................................................................3
Question 4..................................................................................................................................3
Question 5..................................................................................................................................4
1
ASSINGNEMENT NAME:
STUDENT NAME:
Document Page
Introduction
The objective of this task is to analyse the situation presented and identify the dependent and
independent variables. Further, a relevant hypothesis test needs to be identified and justified.
Besides, based on the data provided, the underlying distribution needs to be analysed. Also,
the descriptive statistics pertaining to the dataset provided also needs analysis. Finally, the
hypothesis test needs to performed on the provided dataset to investigate whether the result
meets the common expectations.
Question 1
For the given project, the independent variable would be the type of words in the list which
could either be congruent or incongruent. Congruent words would refer to those words which
are the same as the underlying colour they represent. Incongruent words refer to those words
which are different from the underlying colour they represent. The time taken to read the
colour of the list would be the dependent variable. This is because the amount of time taken
would depend on whether the word list is comprises of congruent words or incongruent
words as the latter would be expected to take a higher duration of time.
Question 2
An appropriate set of hypotheses for the given task is indicated as follows.
Null Hypothesis (H0): μcongruent= μincongruent which implies that there is no significant difference
between the average time taken to identify the colour of congruent words list and incongruent
words list.
Alternative Hypothesis (H1): μcongruent < μincongruent which implies that the average time taken to
identify the colour of congruent words list is significantly lesser in comparison to the
corresponding time to identify colour of incongruent words list.
A suitable hypothesis test ought to be performed in order to estimate if the null hypothesis
would be rejected or not. The relevant test that would be applied is two independent sample t
test. T test is preferred instead of Z test as the underlying population deviation for the two
variables is unknown. Further, there are two samples and also the time takes in either case
would be independent of each other. Also, considering the alternative hypothesis, the given
test would be a one tail test and more precisely a left tail test.
2
ASSINGNEMENT NAME:
STUDENT NAME:
Document Page
Question 3
Some of the descriptive characteristics related to the sample dataset are indicated below.
Based on the above, it is apparent that there is significant difference in the mean time to
identify colours in lists with congruent and incongruent words. Further, the median time with
regards to list of congruent words is 14.357 which implies that 50% of the sample
participants take this time or lesser time to identify colours in congruent words list.
Additionally, the three measures of dispersion for the given data are standard deviation,
sample variance and range. It is apparent that the dispersion is significantly higher with
regards to incongruent words list reading time in comparison to congruent words list reading
time. However, variation in reading time for the two lists is low to moderate only.
Question 4
The distribution of the given sample data can be analysed using the histogram of the two
samples provided.
3
ASSINGNEMENT NAME:
STUDENT NAME:
tabler-icon-diamond-filled.svg

Paraphrase This Document

Need a fresh take? Get an instant paraphrase of this document with our AI Paraphraser
Document Page
It is apparent that the above histogram does not have a symmetric shape as the tail on the
right of the mean is significantly larger than the corresponding tail on the left. This implies
that positive skew is present. For the distribution to be normal, it is imperative that the skew
should not be present in the data and must be zero. The presence of skew in the above data
(congruent words reading time) implies that this is not normally distributed.
It is apparent that the above histogram does not have a symmetric shape as the tail on the
right of the mean is significantly larger than the corresponding tail on the left. This implies
that positive skew is present. For the distribution to be normal, it is imperative that the skew
should not be present in the data and must be zero. The presence of skew in the above data
(incongruent words reading time) implies that this is not normally distributed.
Question 5
The relevant hypotheses are listed below.
Null Hypothesis (H0): μcongruent= μincongruent which implies that there is no significant difference
between the average time taken to identify the colour of congruent words list and incongruent
words list.
Alternative Hypothesis (H1): μcongruent < μincongruent which implies that the average time taken to
identify the colour of congruent words list is significantly lesser in comparison to the
corresponding time to identify colour of incongruent words list.
4
ASSINGNEMENT NAME:
STUDENT NAME:
Document Page
The significance level has been assumed as 5%.
A suitable hypothesis test ought to be performed in order to estimate if the null hypothesis
would be rejected or not. The relevant test that would be applied is two independent sample t
test. T test is preferred instead of Z test as the underlying population deviation for the two
variables is unknown. The relevant output from excel is indicated below.
The critical value would be -1.679 while the t stat is -6.532. Since the t stat is lower than the
critical value, hence the available evidence is sufficient to cause null hypothesis rejection and
alternative hypothesis acceptance. Hence, it can be concluded that average time to identify
the colour of congruent words list is lesser than the corresponding average time for
incongruent words list. The results have clearly matched with my expectations.
5
ASSINGNEMENT NAME:
STUDENT NAME:
chevron_up_icon
1 out of 6
circle_padding
hide_on_mobile
zoom_out_icon
[object Object]