Statistics Exam Module 3: Analyzing Data and Statistical Measures

Verified

Added on  2022/08/28

|2
|482
|22
Quiz and Exam
AI Summary
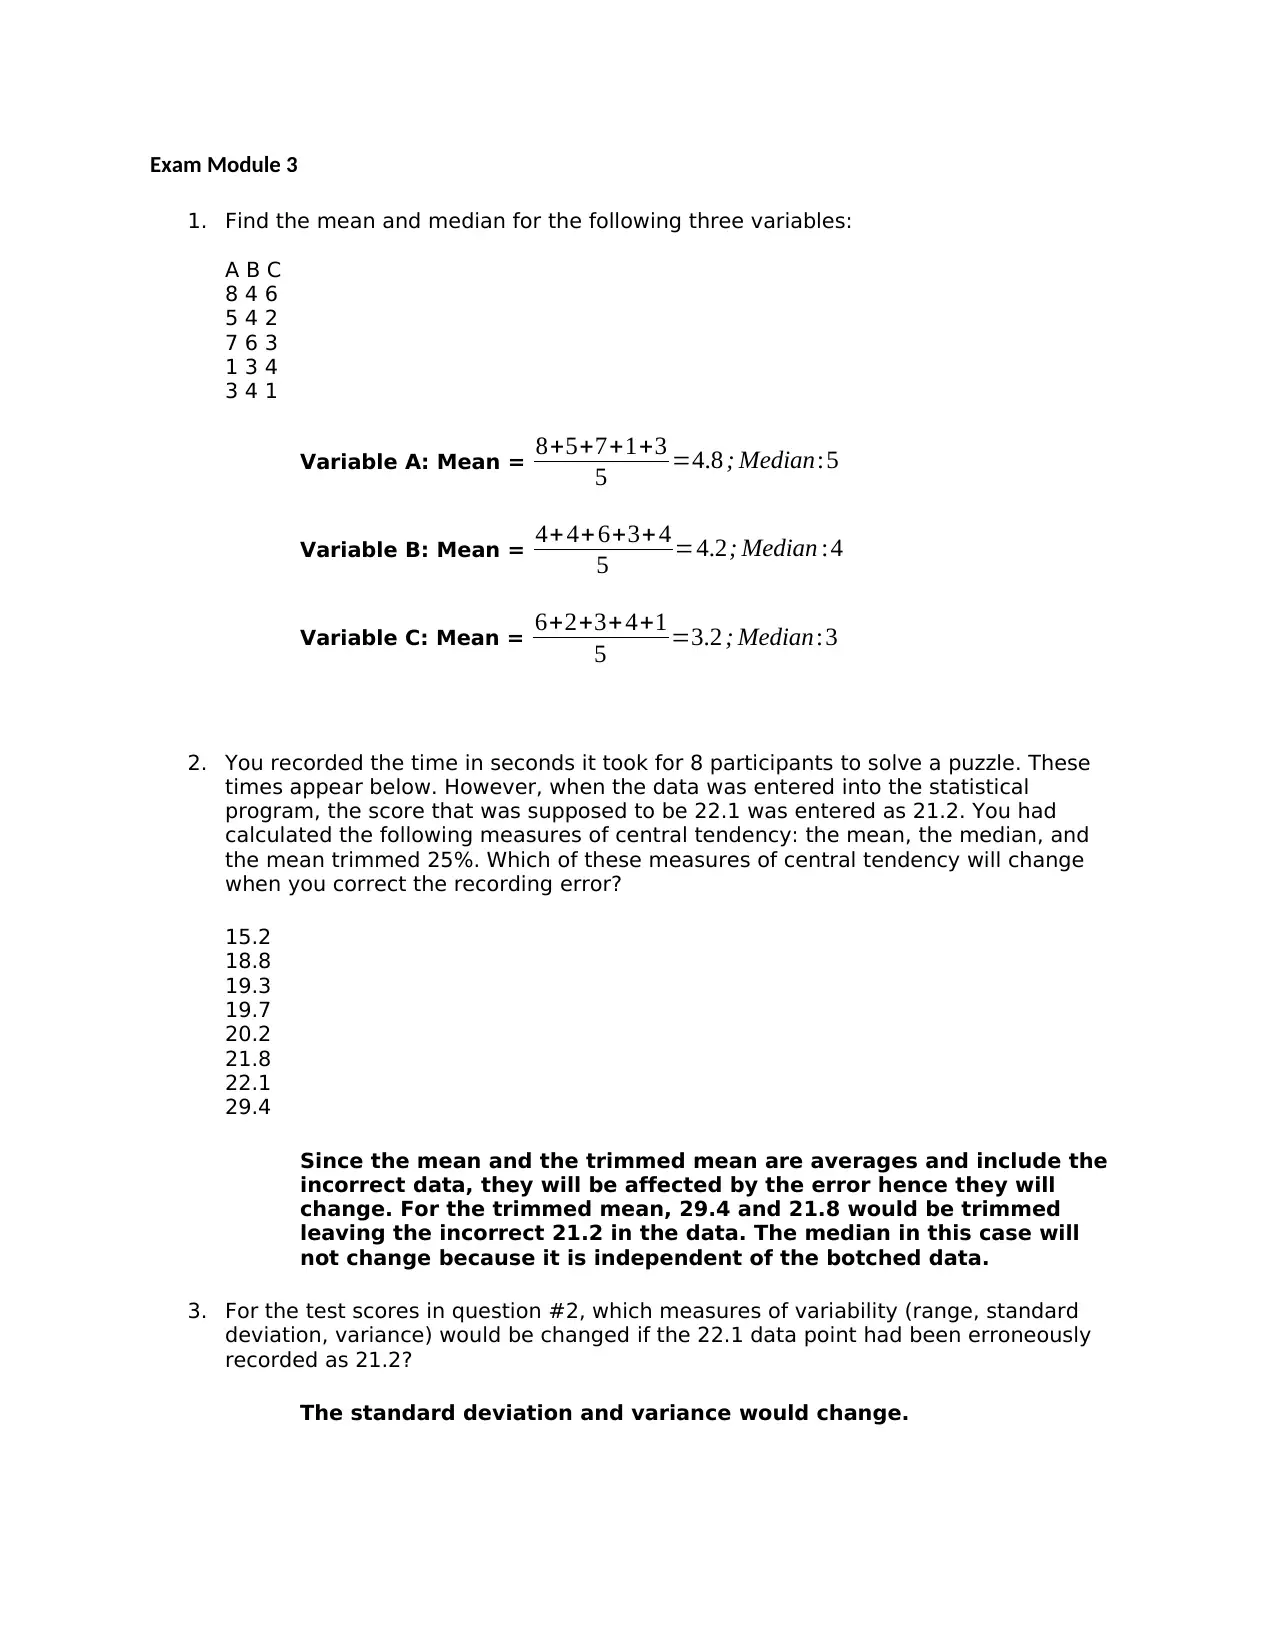
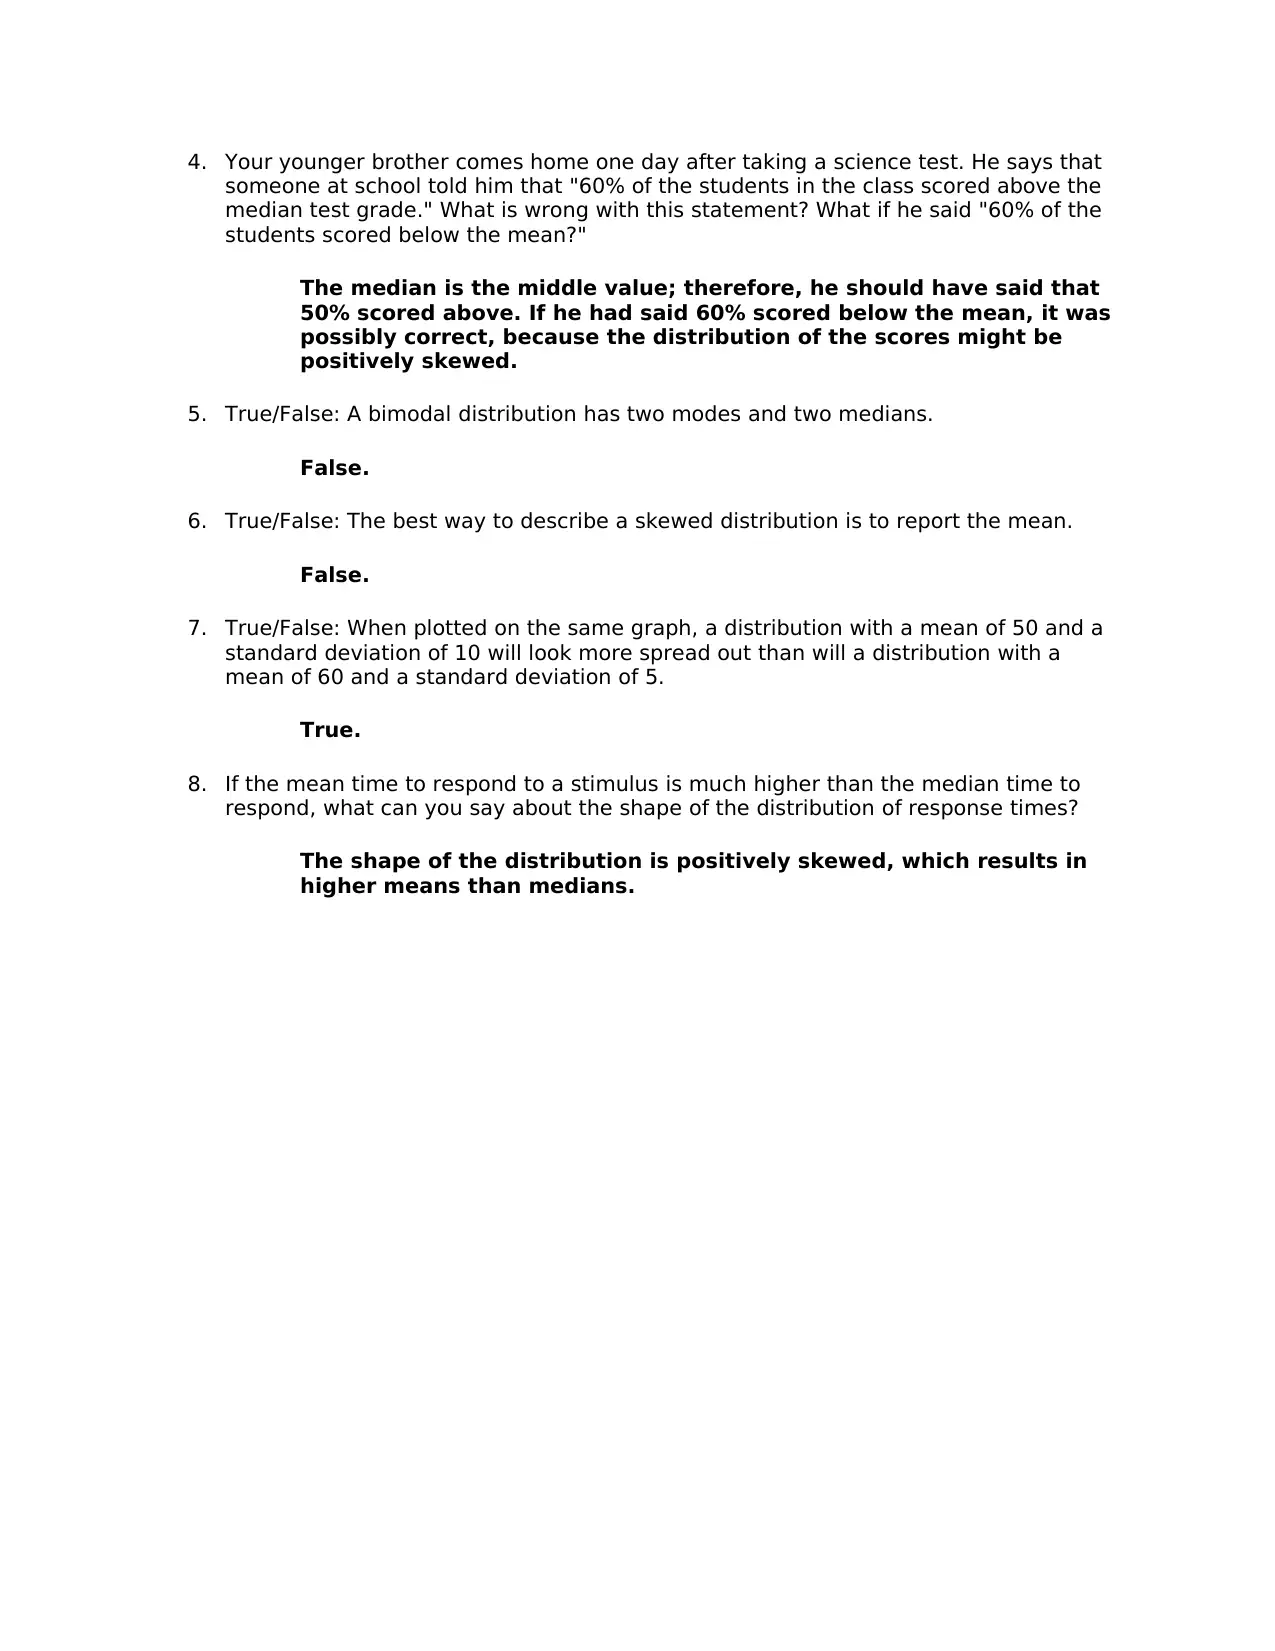
This assignment provides solutions to a statistics exam focusing on central tendency, variability, and data distribution analysis. The solution begins by calculating the mean and median for three variables. It then addresses how errors in data entry affect measures of central tendency (mean, median, and trimmed mean) and variability (range, standard deviation, and variance). The assignment also explores the understanding of statistical concepts, such as the interpretation of the median and mean in relation to student scores and distribution shapes. True/false questions test understanding of bimodal distributions, skewed distributions, and the impact of standard deviation on data spread. Finally, it analyzes the shape of a distribution based on the relationship between the mean and median response times.
Document Page
Exam Module 3
1. Find the mean and median for the following three variables:
A B C
8 4 6
5 4 2
7 6 3
1 3 4
3 4 1
Variable A: Mean = 8+5+7+1+3
5 =4.8 ; Median:5
Variable B: Mean = 4+ 4+ 6+3+4
5 =4.2; Median :4
Variable C: Mean = 6+2+3+ 4+1
5 =3.2 ; Median:3
2. You recorded the time in seconds it took for 8 participants to solve a puzzle. These
times appear below. However, when the data was entered into the statistical
program, the score that was supposed to be 22.1 was entered as 21.2. You had
calculated the following measures of central tendency: the mean, the median, and
the mean trimmed 25%. Which of these measures of central tendency will change
when you correct the recording error?
15.2
18.8
19.3
19.7
20.2
21.8
22.1
29.4
Since the mean and the trimmed mean are averages and include the
incorrect data, they will be affected by the error hence they will
change. For the trimmed mean, 29.4 and 21.8 would be trimmed
leaving the incorrect 21.2 in the data. The median in this case will
not change because it is independent of the botched data.
3. For the test scores in question #2, which measures of variability (range, standard
deviation, variance) would be changed if the 22.1 data point had been erroneously
recorded as 21.2?
The standard deviation and variance would change.
tabler-icon-diamond-filled.svg

Paraphrase This Document

Need a fresh take? Get an instant paraphrase of this document with our AI Paraphraser
Document Page
4. Your younger brother comes home one day after taking a science test. He says that
someone at school told him that "60% of the students in the class scored above the
median test grade." What is wrong with this statement? What if he said "60% of the
students scored below the mean?"
The median is the middle value; therefore, he should have said that
50% scored above. If he had said 60% scored below the mean, it was
possibly correct, because the distribution of the scores might be
positively skewed.
5. True/False: A bimodal distribution has two modes and two medians.
False.
6. True/False: The best way to describe a skewed distribution is to report the mean.
False.
7. True/False: When plotted on the same graph, a distribution with a mean of 50 and a
standard deviation of 10 will look more spread out than will a distribution with a
mean of 60 and a standard deviation of 5.
True.
8. If the mean time to respond to a stimulus is much higher than the median time to
respond, what can you say about the shape of the distribution of response times?
The shape of the distribution is positively skewed, which results in
higher means than medians.
chevron_up_icon
1 out of 2
circle_padding
hide_on_mobile
zoom_out_icon
[object Object]