Statistical Analysis and Regression: Exam Module 7 - Solutions

Verified

Added on  2022/08/28

|7
|843
|25
Homework Assignment
AI Summary
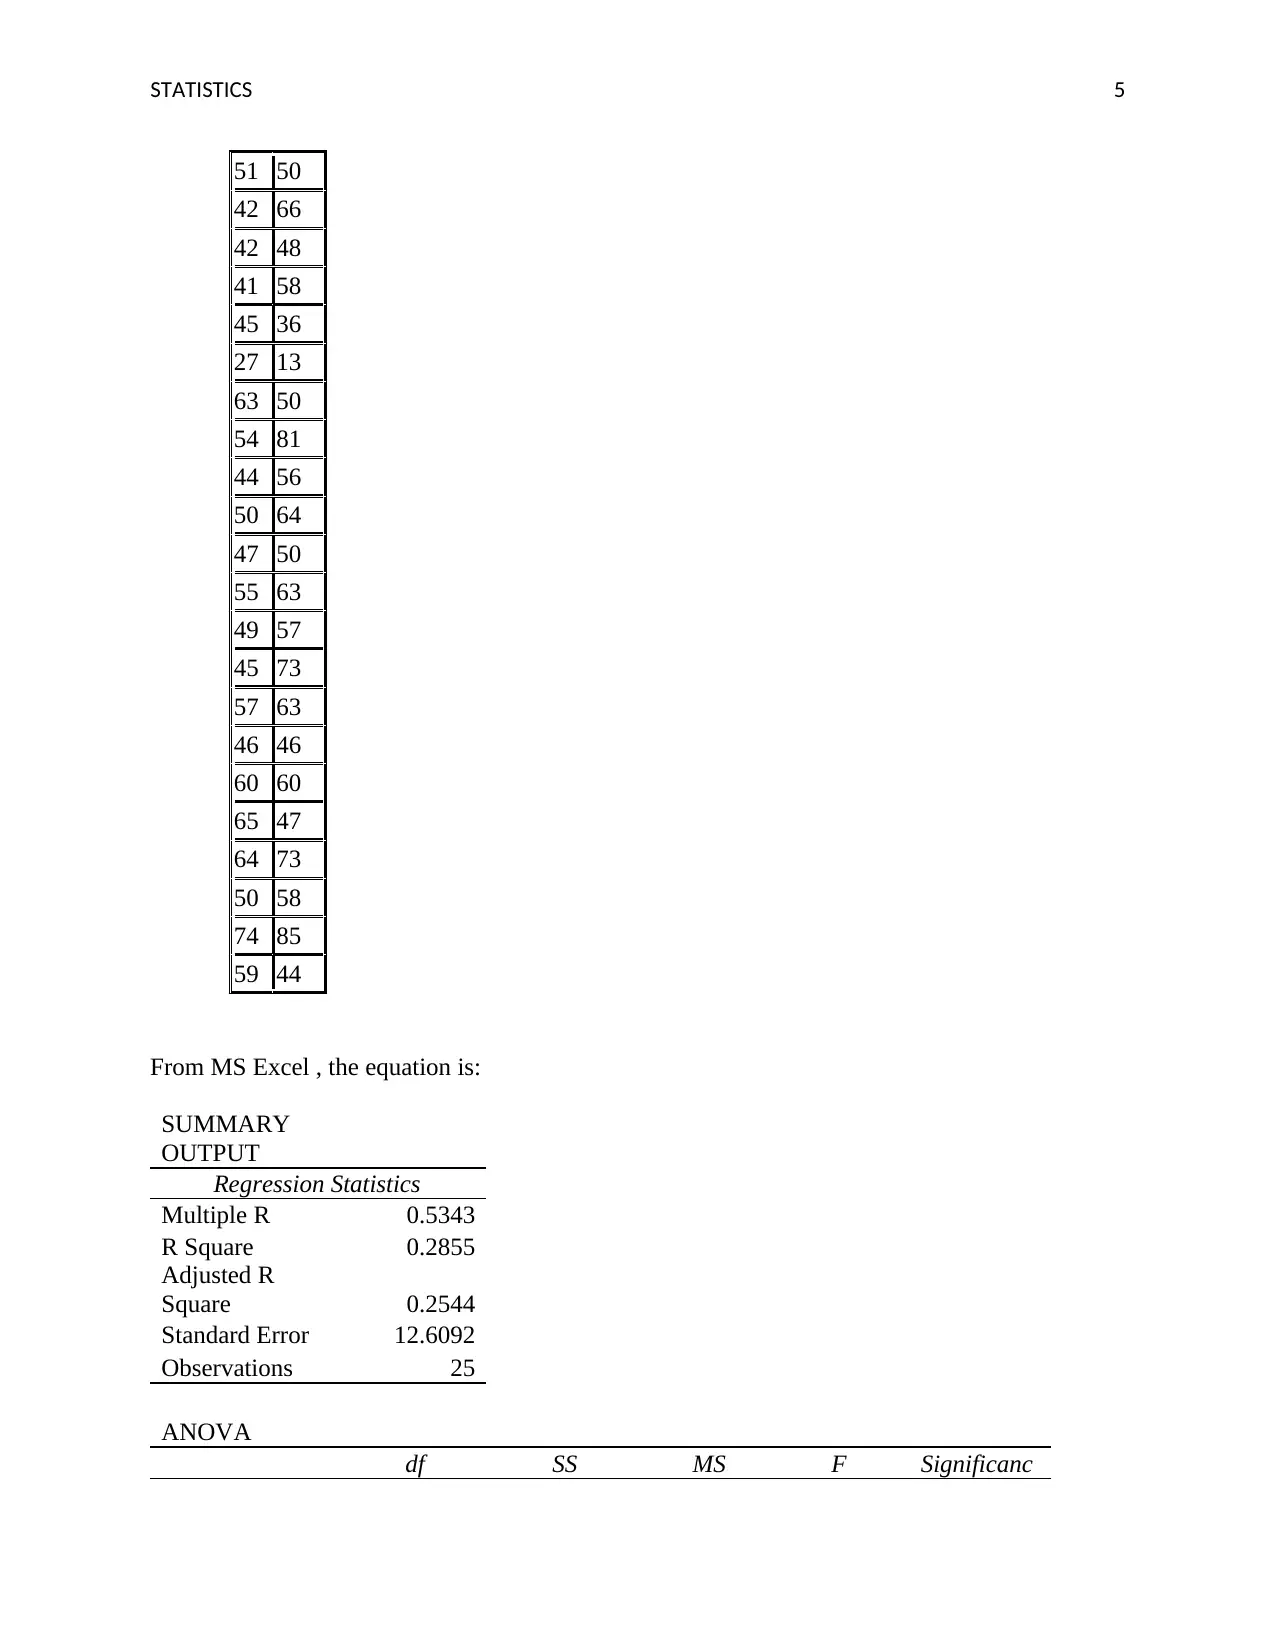
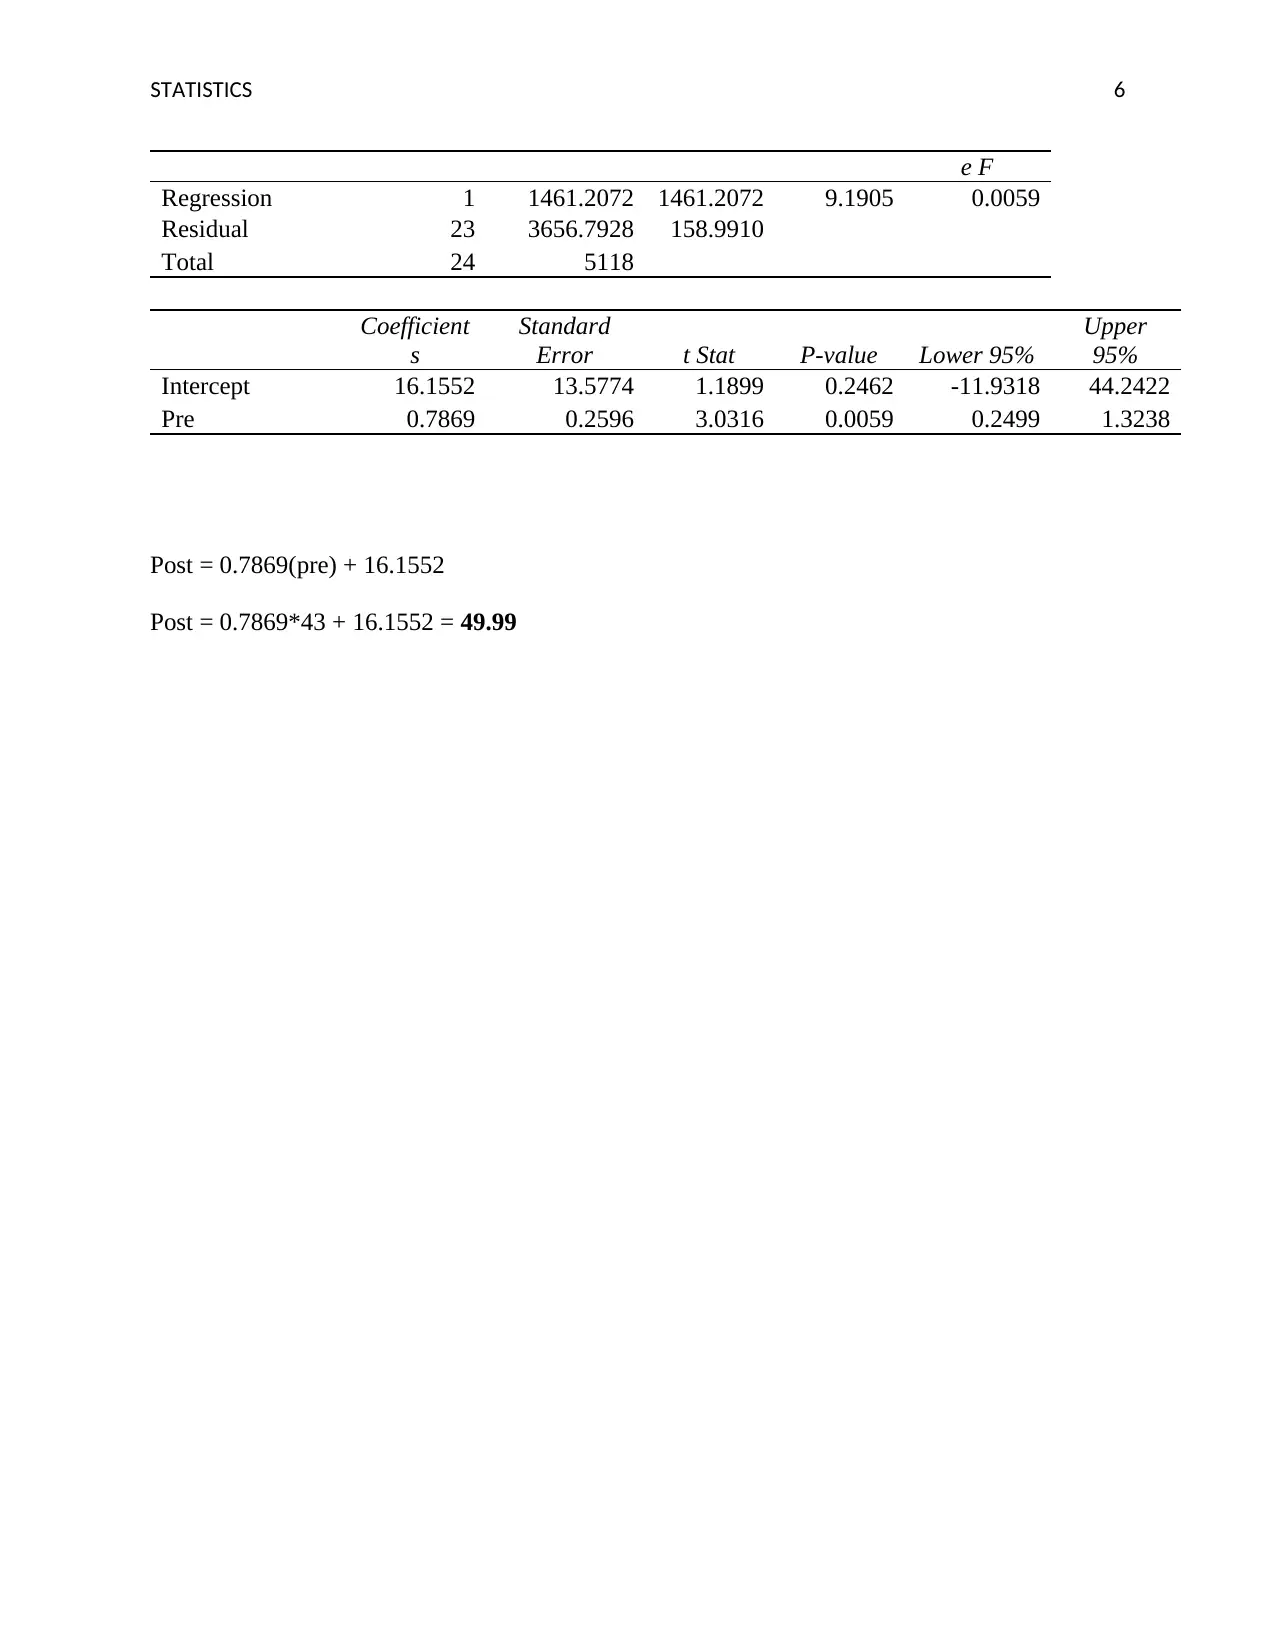
This document presents comprehensive solutions to a statistics exam centered on regression analysis. The solutions cover a range of topics including calculating predicted scores from a regression equation, interpreting the standard error of the estimate, and determining R-squared values. The document also addresses the assumptions underlying linear regression, and provides an analysis of statistical significance using t-tests. Furthermore, it includes examples of regression equations and their applications, along with calculations and interpretations. The assignment also provides a worked example of a regression analysis, including the equation, and interpretation of the results, demonstrating the application of statistical methods to real-world data. The document concludes with a reference list, citing relevant statistical sources.
Document Page
Running head: STATISTICS 1
Student Name
Institutional Affiliation
Exam Module 7
tabler-icon-diamond-filled.svg

Paraphrase This Document

Need a fresh take? Get an instant paraphrase of this document with our AI Paraphraser
Document Page
STATISTICS 2
1. The formula for a regression equation based on a sample size of 25 observations is Y' =
2X + 9.
(a) What would be the predicted score for a person scoring 6 on X?
The predicted score is:
Y’ = 2(6) +9 = 21
2. (b) If someone's predicted score was 14, what was this person's score on X?
From the equation, Y= 2x+9
14= 2x+ 9
14-9 = 2x
2x= 5
x= 5/2 = 2.5
3. What does the standard error of the estimate measure? What is the formula for the
standard error of the estimate?
It measures the accuracy of prediction around a regression line.
The formula is:
standard error of estimate= √ Σ ( y − y' )
N where y is the observed score, y’ is the predicted
score and n is the sample size.
4. (a) In a regression analysis, the sum of squares for the predicted scores is 100 and the
sum of squares error is 200, what is R2? (b) In a different regression analysis, 40% of the
variance was explained. The sum of squares total is 1000. What is the sum of squares of
the predicted values?
SST= SSR +SSE= 300
R^2 =1- (SSR/SST) =1- 200/300 = 0.3333
Document Page
STATISTICS 3
This means 33.33% of the variations is explained.
Using the same logic, 0.4*1000= 400
5. What assumptions are needed to calculate the various inferential statistics of linear
regression?
ï‚· There is equal variance around the line (homoscedasticity of errors).
ï‚· There is a linear relationship between the two variables. (Berry, 1993)
ï‚· Errors are normally distributed (Faraway, 2016)
ï‚· There is no multicollinearity of independent variables
ï‚· There is independence of observations.
6. The equation for a regression line predicting the number of hours of TV watched by
children (Y) from the number of hours of TV watched by their parents (X) is Y' = 4 +
1.2X. The sample size is 12.
(a) If the standard error of b is .4, is the slope statistically significant at the .05 level?
Df = 12- 2 = 10
Using MS Excel or t table, t critical is:
t- critical = =T.INV.2T (0.05,10) = 2.23
t statistic = slope/standard error = 1.2/0.4= 3.00
since 3 is greater than 2.20, the slope is statistically significant.
(b) If the mean of X is 8, what is the mean of Y?
y-intercept = y̅ - β* x̅
4= y mean –(1.2*8)
4+9.6 = 10
7. Does A or B have a larger standard error of the estimate?
Document Page
STATISTICS 4
B has a larger standard error because most of the points are further away from the line
than that of line A
8. True/false: If the slope of a simple linear regression line is statistically significant, then
the correlation will also always be significant.
This is true.
9. True/false: If the correlation is .8, then 40% of the variance is explained.
Variance explained (R squared) is given by square of correlation. Thus
R-squared = 0.8^2 = 0.64.
Therefore, the answer is false
10. True/false: If the actual Y score was 31, but the predicted score was 28, then the error of
prediction is 3.
This is true because error is the deviation from the actual value which in this case is 31-
28 = 3
10. Find the predicted post-test score for someone with a score of 43 on the pre-test.
Pre Post
59 56
52 63
44 55
tabler-icon-diamond-filled.svg

Paraphrase This Document

Need a fresh take? Get an instant paraphrase of this document with our AI Paraphraser
Document Page
STATISTICS 5
51 50
42 66
42 48
41 58
45 36
27 13
63 50
54 81
44 56
50 64
47 50
55 63
49 57
45 73
57 63
46 46
60 60
65 47
64 73
50 58
74 85
59 44
From MS Excel , the equation is:
SUMMARY
OUTPUT
Regression Statistics
Multiple R 0.5343
R Square 0.2855
Adjusted R
Square 0.2544
Standard Error 12.6092
Observations 25
ANOVA
df SS MS F Significanc
Document Page
STATISTICS 6
e F
Regression 1 1461.2072 1461.2072 9.1905 0.0059
Residual 23 3656.7928 158.9910
Total 24 5118
Coefficient
s
Standard
Error t Stat P-value Lower 95%
Upper
95%
Intercept 16.1552 13.5774 1.1899 0.2462 -11.9318 44.2422
Pre 0.7869 0.2596 3.0316 0.0059 0.2499 1.3238
Post = 0.7869(pre) + 16.1552
Post = 0.7869*43 + 16.1552 = 49.99
Document Page
STATISTICS 7
References
Berry, W. D. (1993). Understanding Regression Assumptions, Issue 92. Newcastle: SAGE.
Faraway, J. J. (2016). Extending the Linear Model with R:Generalized Linear, Mixed Effects and
Nonparametric Regression Models. London: CRC Press, Taylor & Francis Group.
chevron_up_icon
1 out of 7
circle_padding
hide_on_mobile
zoom_out_icon
[object Object]