Statistics for Management Decision - Assessment II Analysis Report

Verified

Added on  2020/04/07

|19
|1492
|121
Homework Assignment
AI Summary
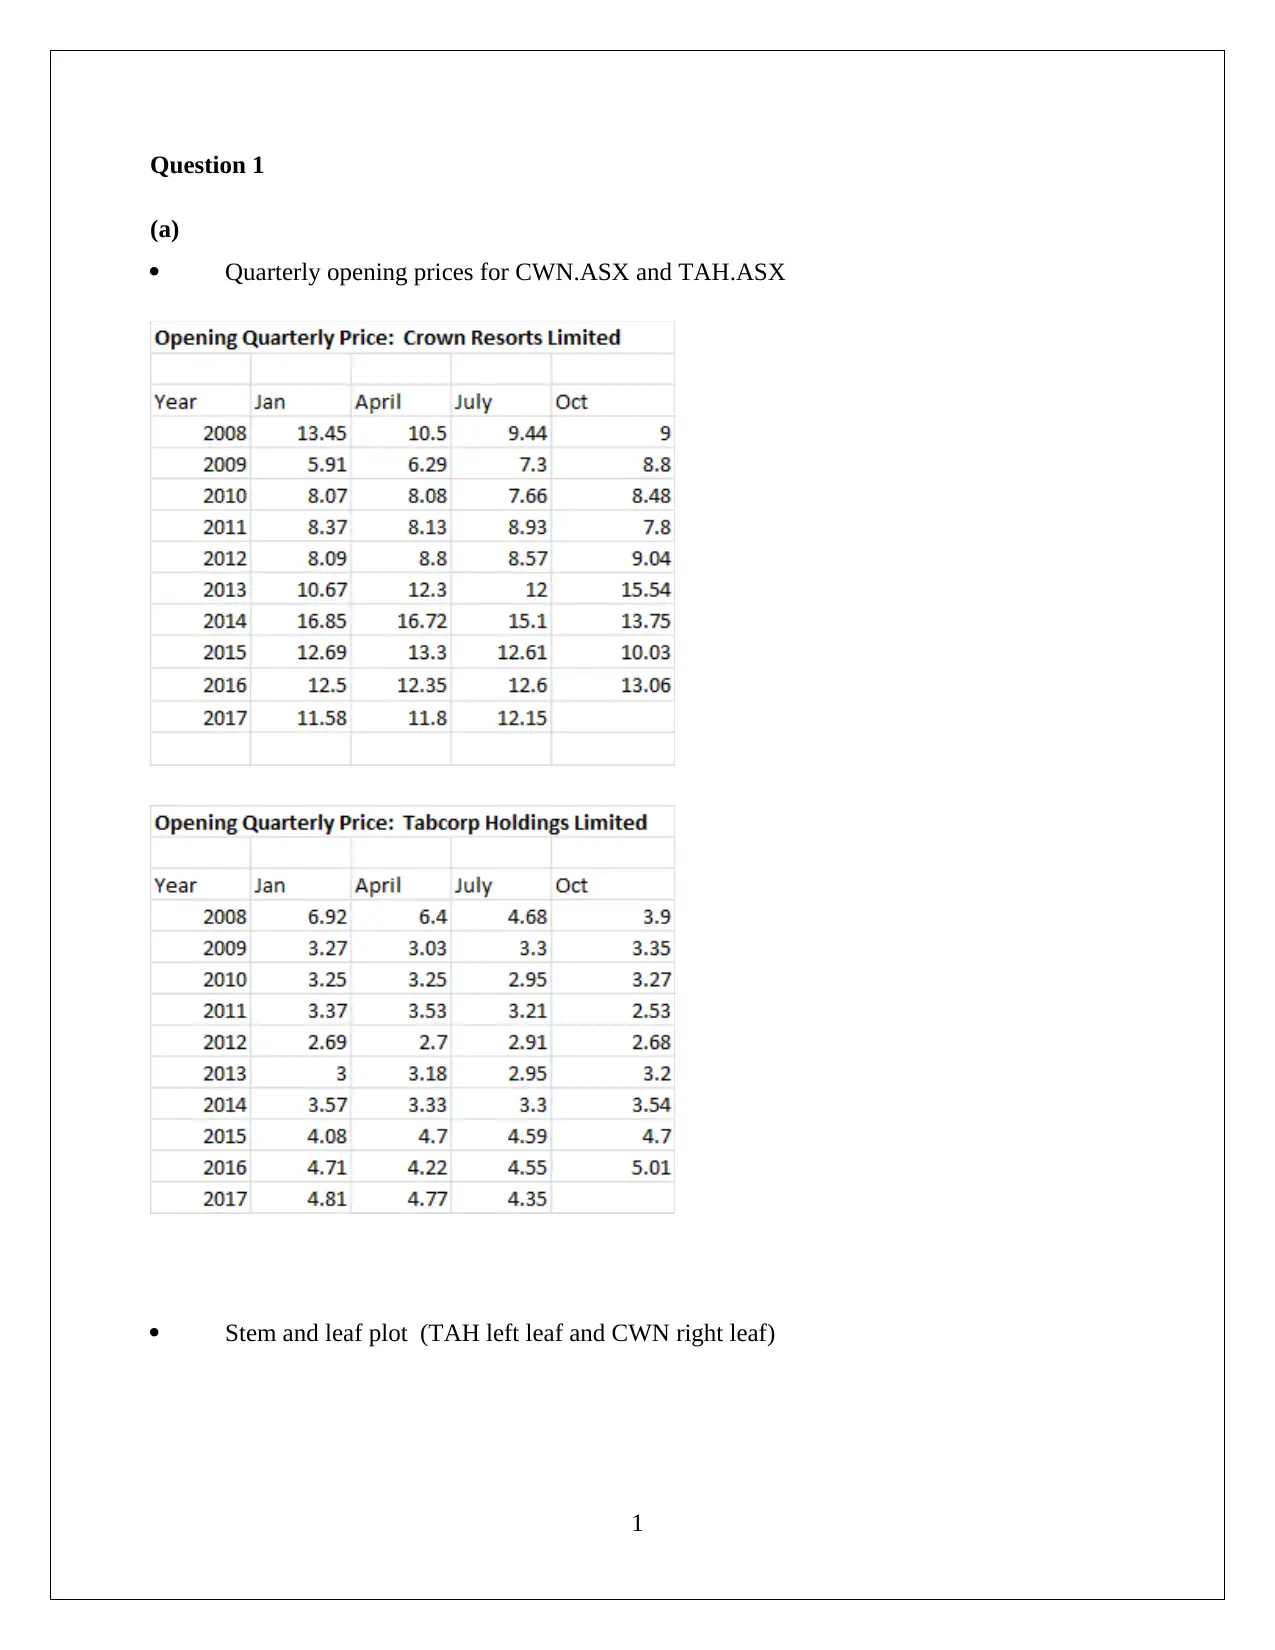
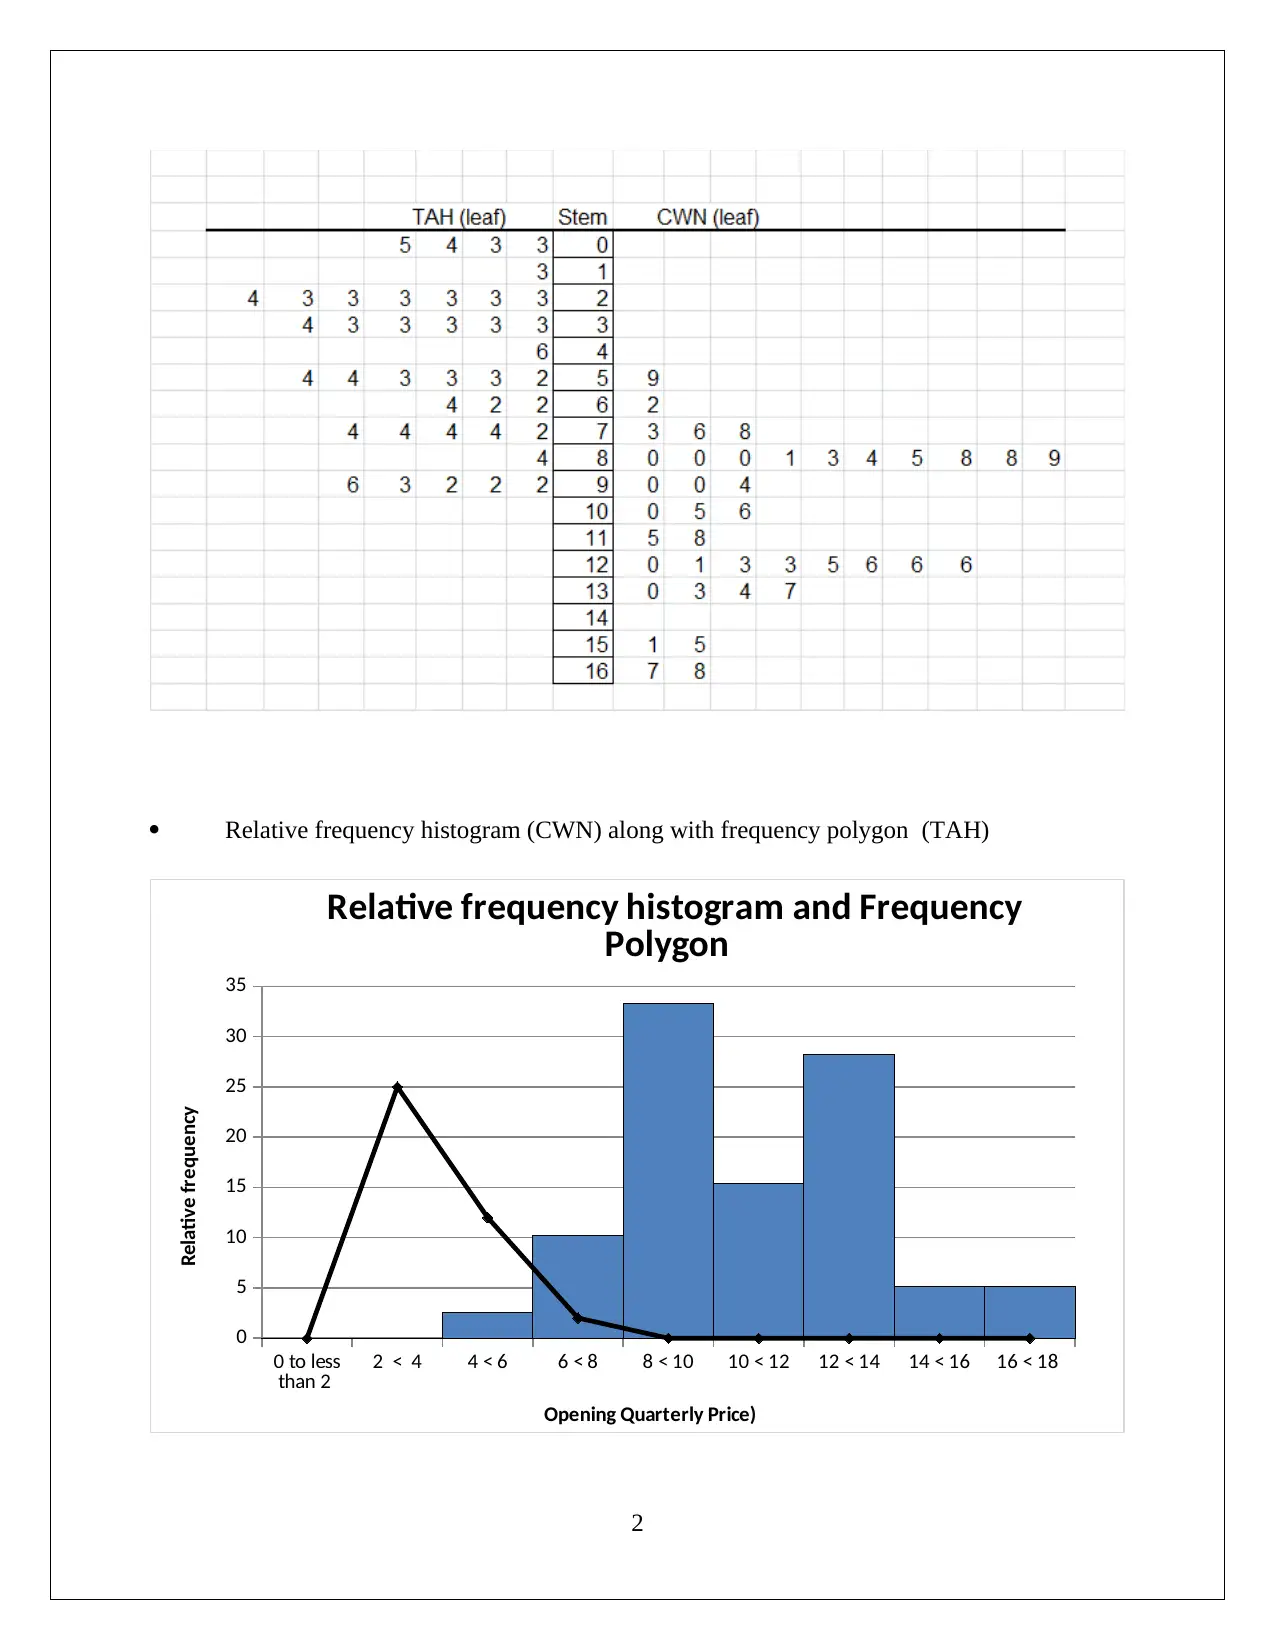
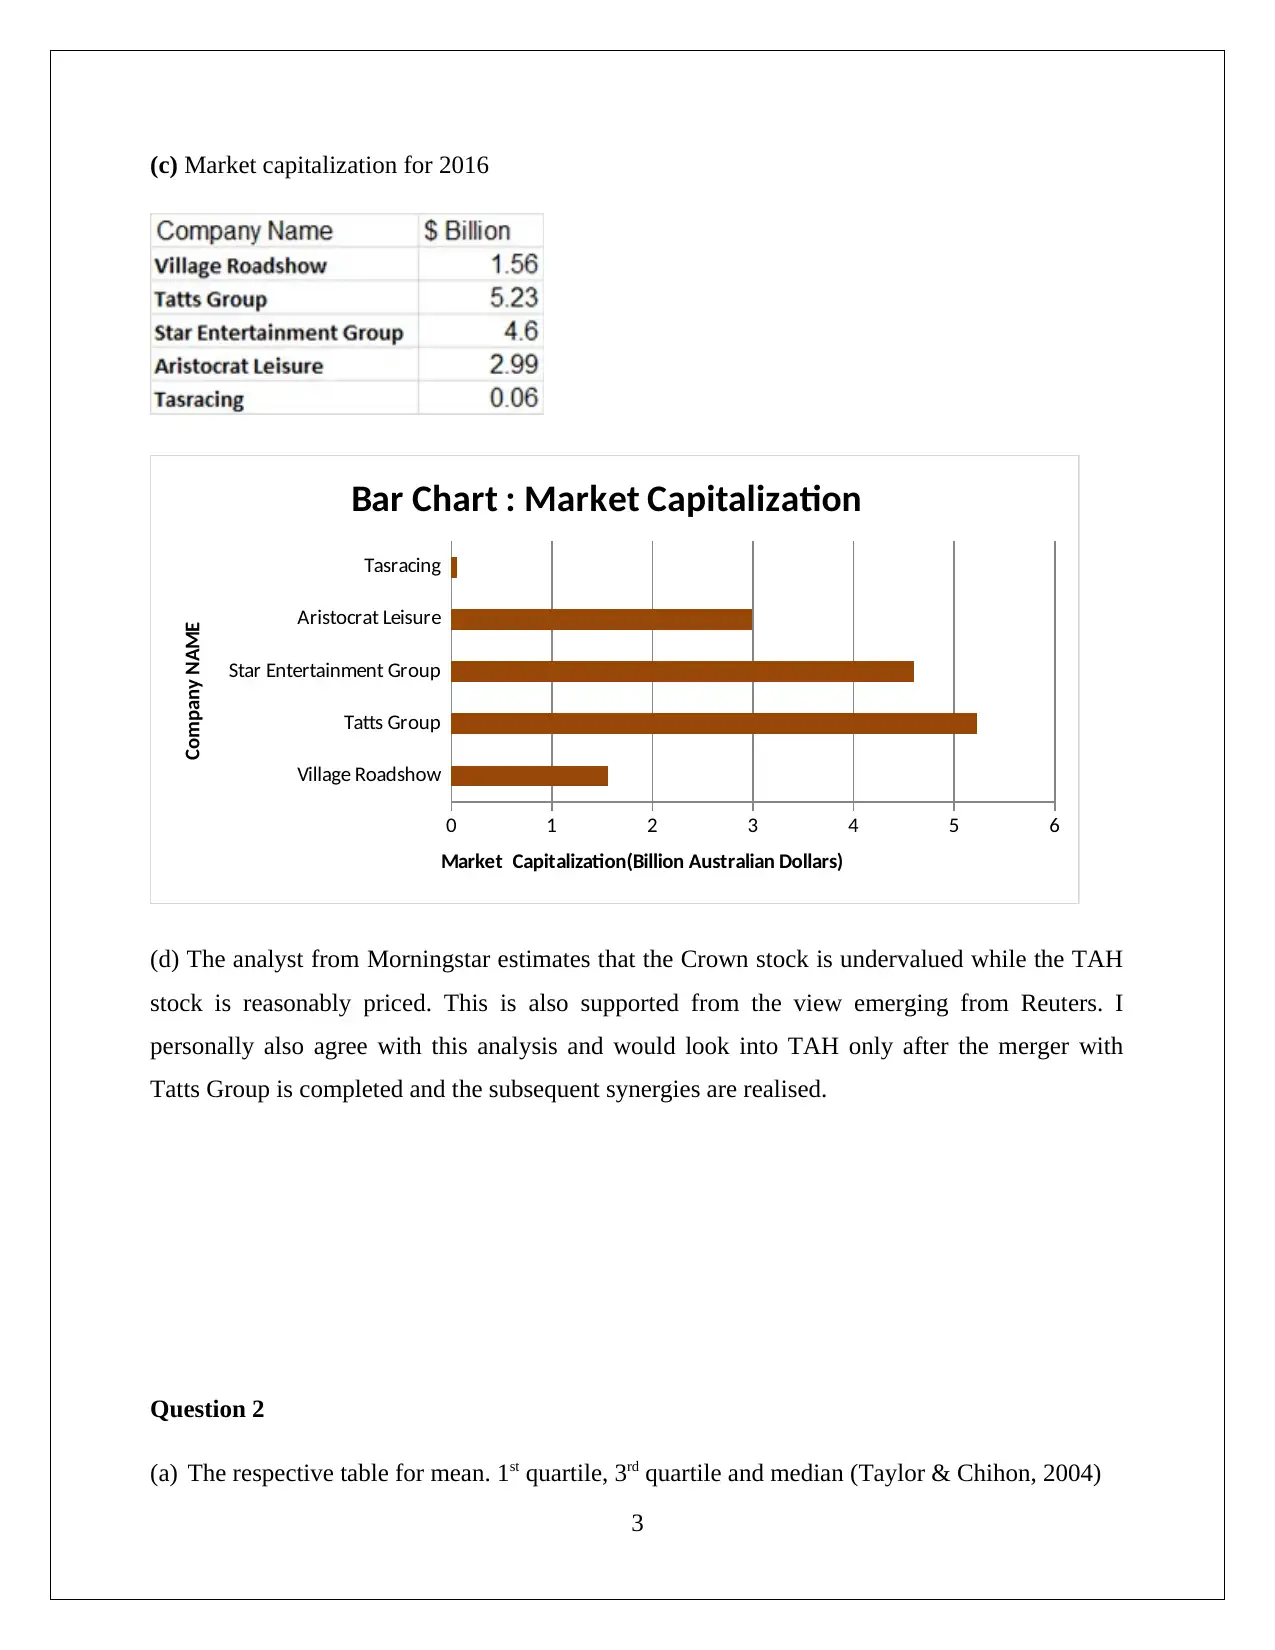
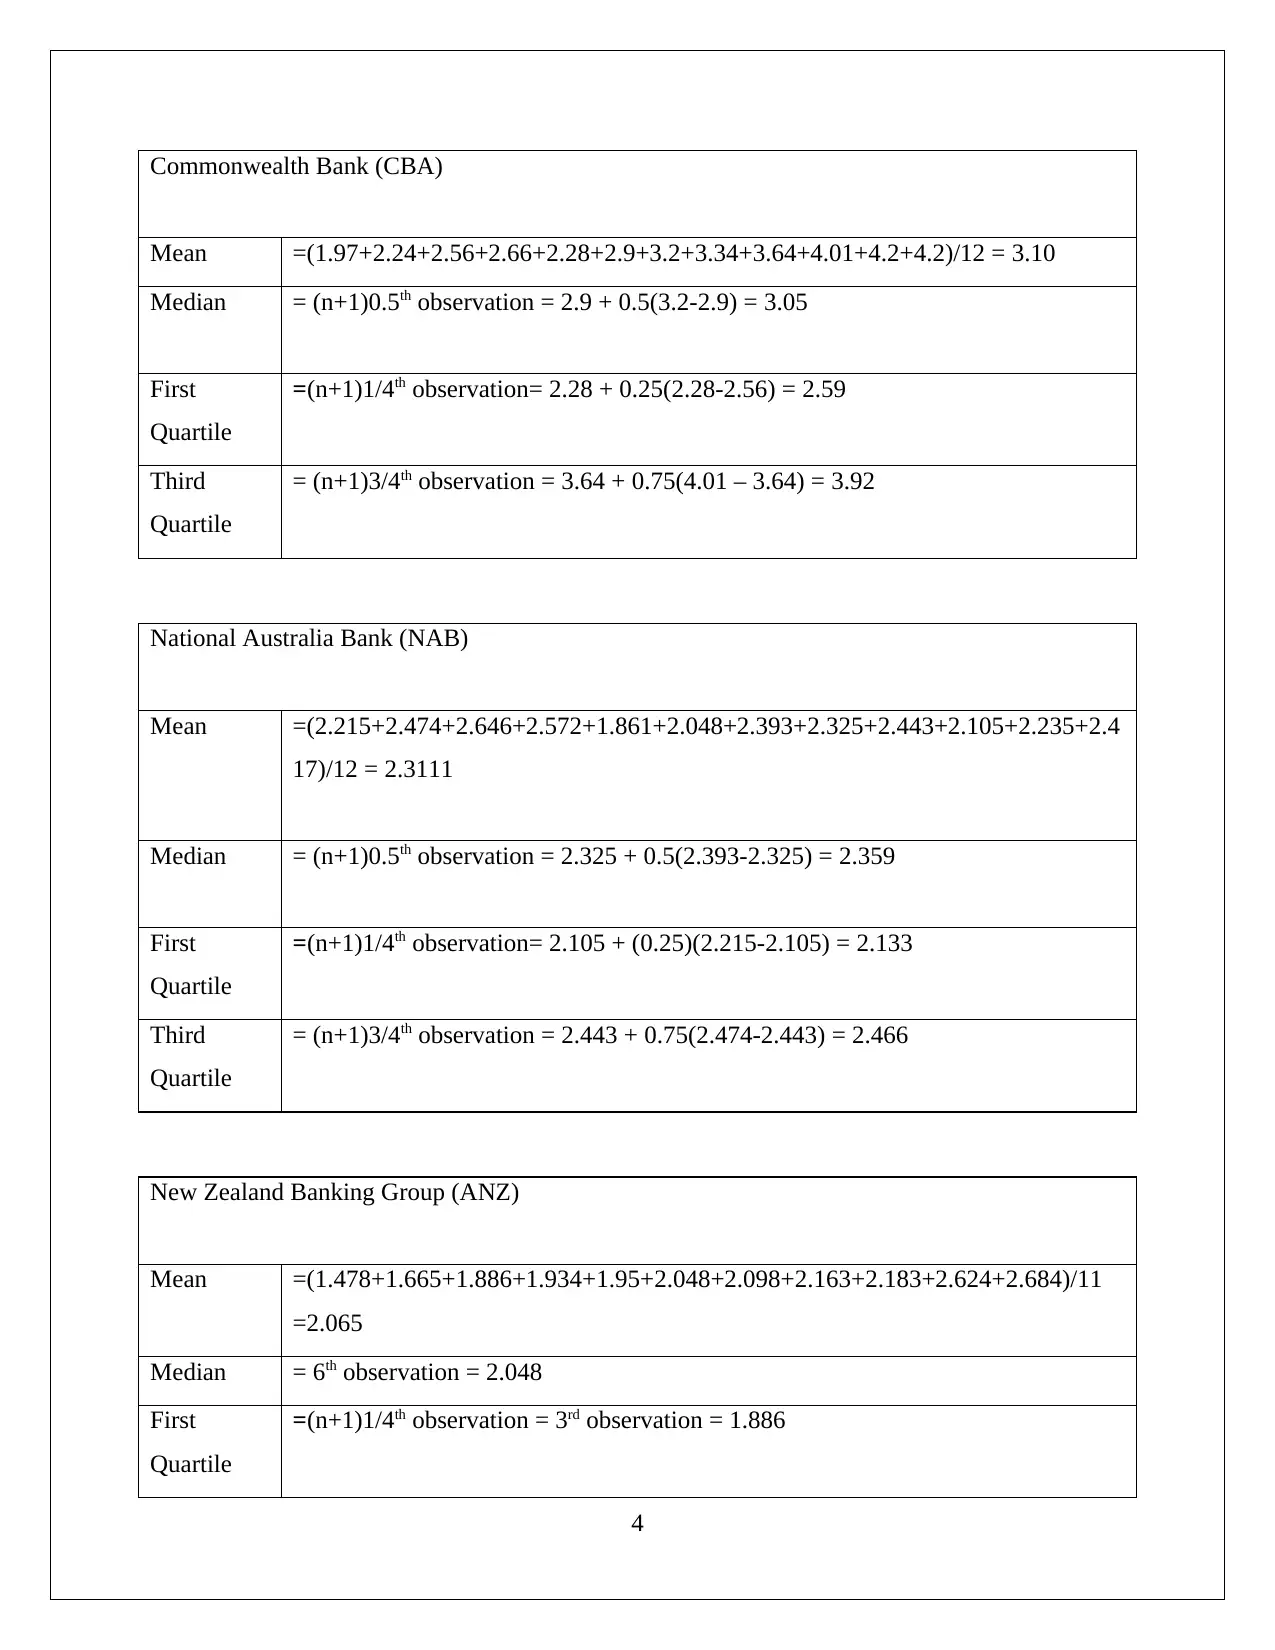
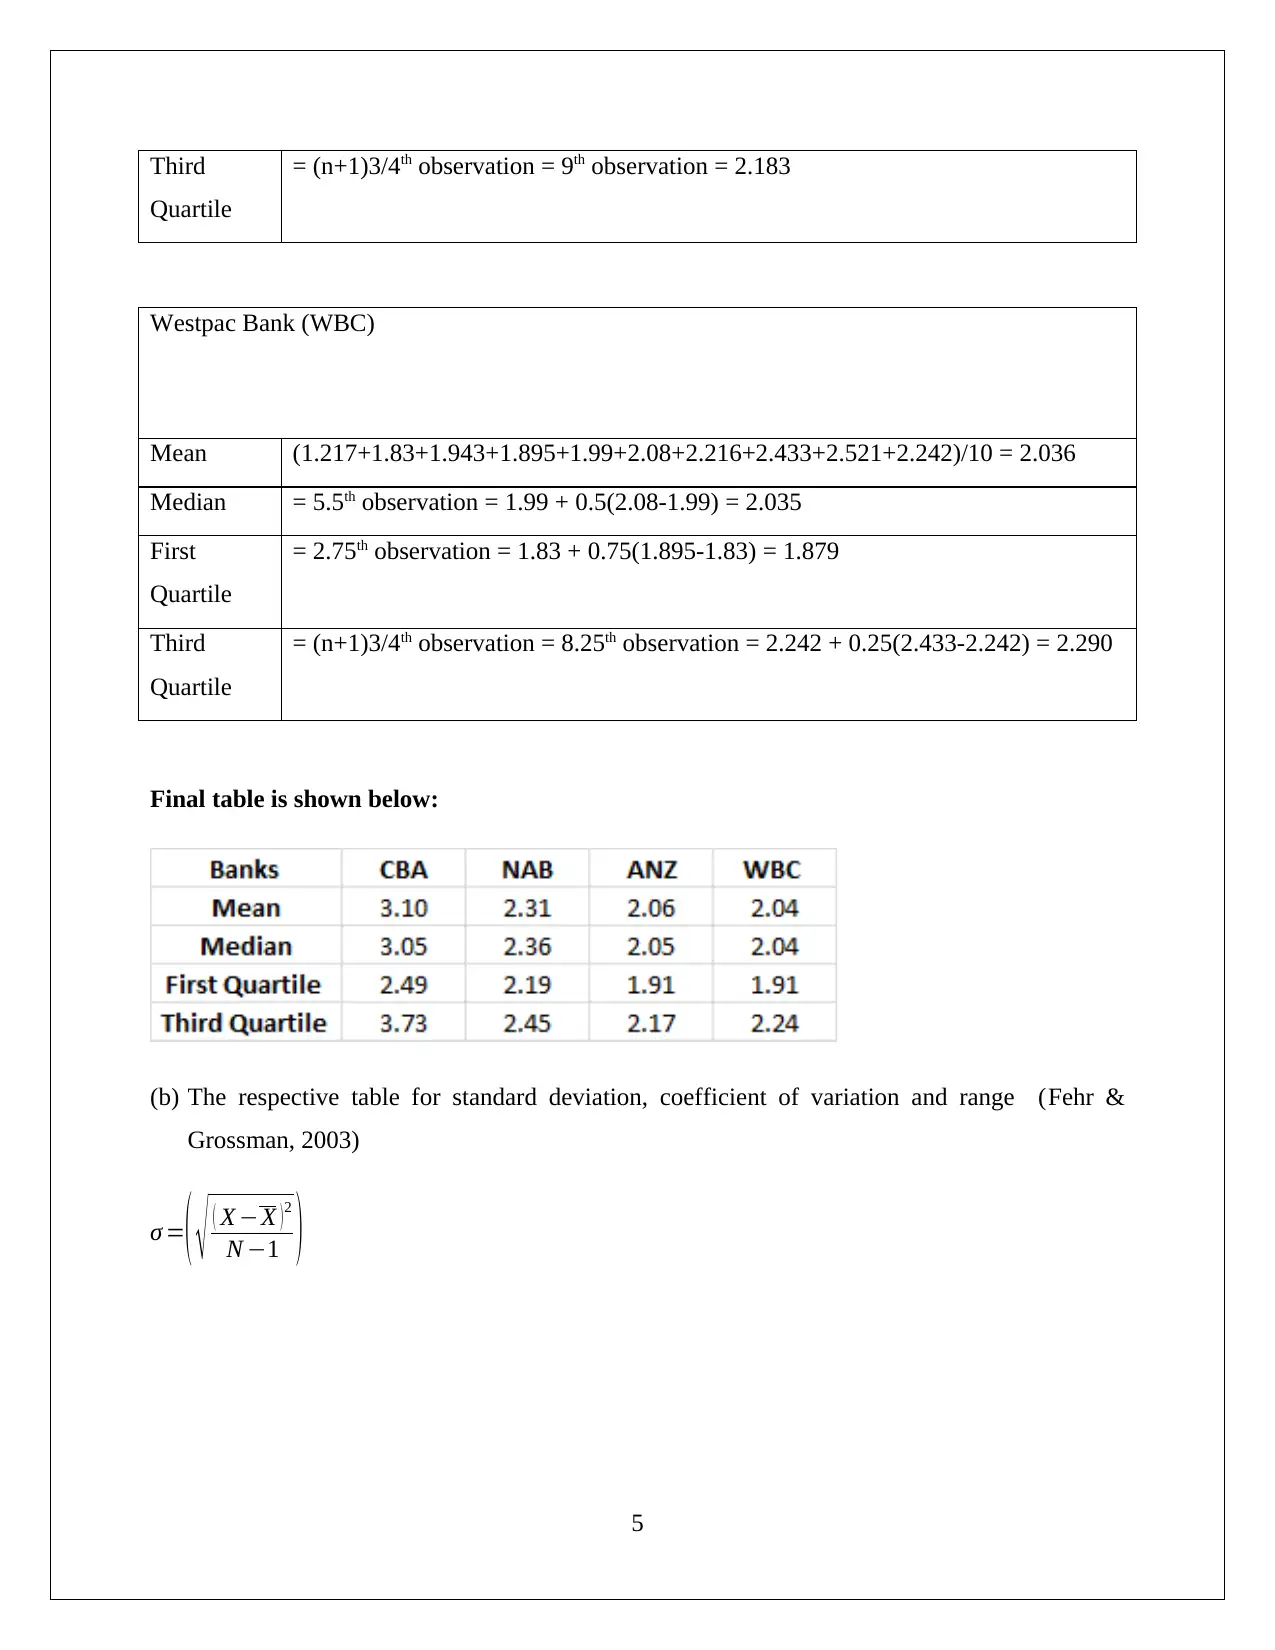
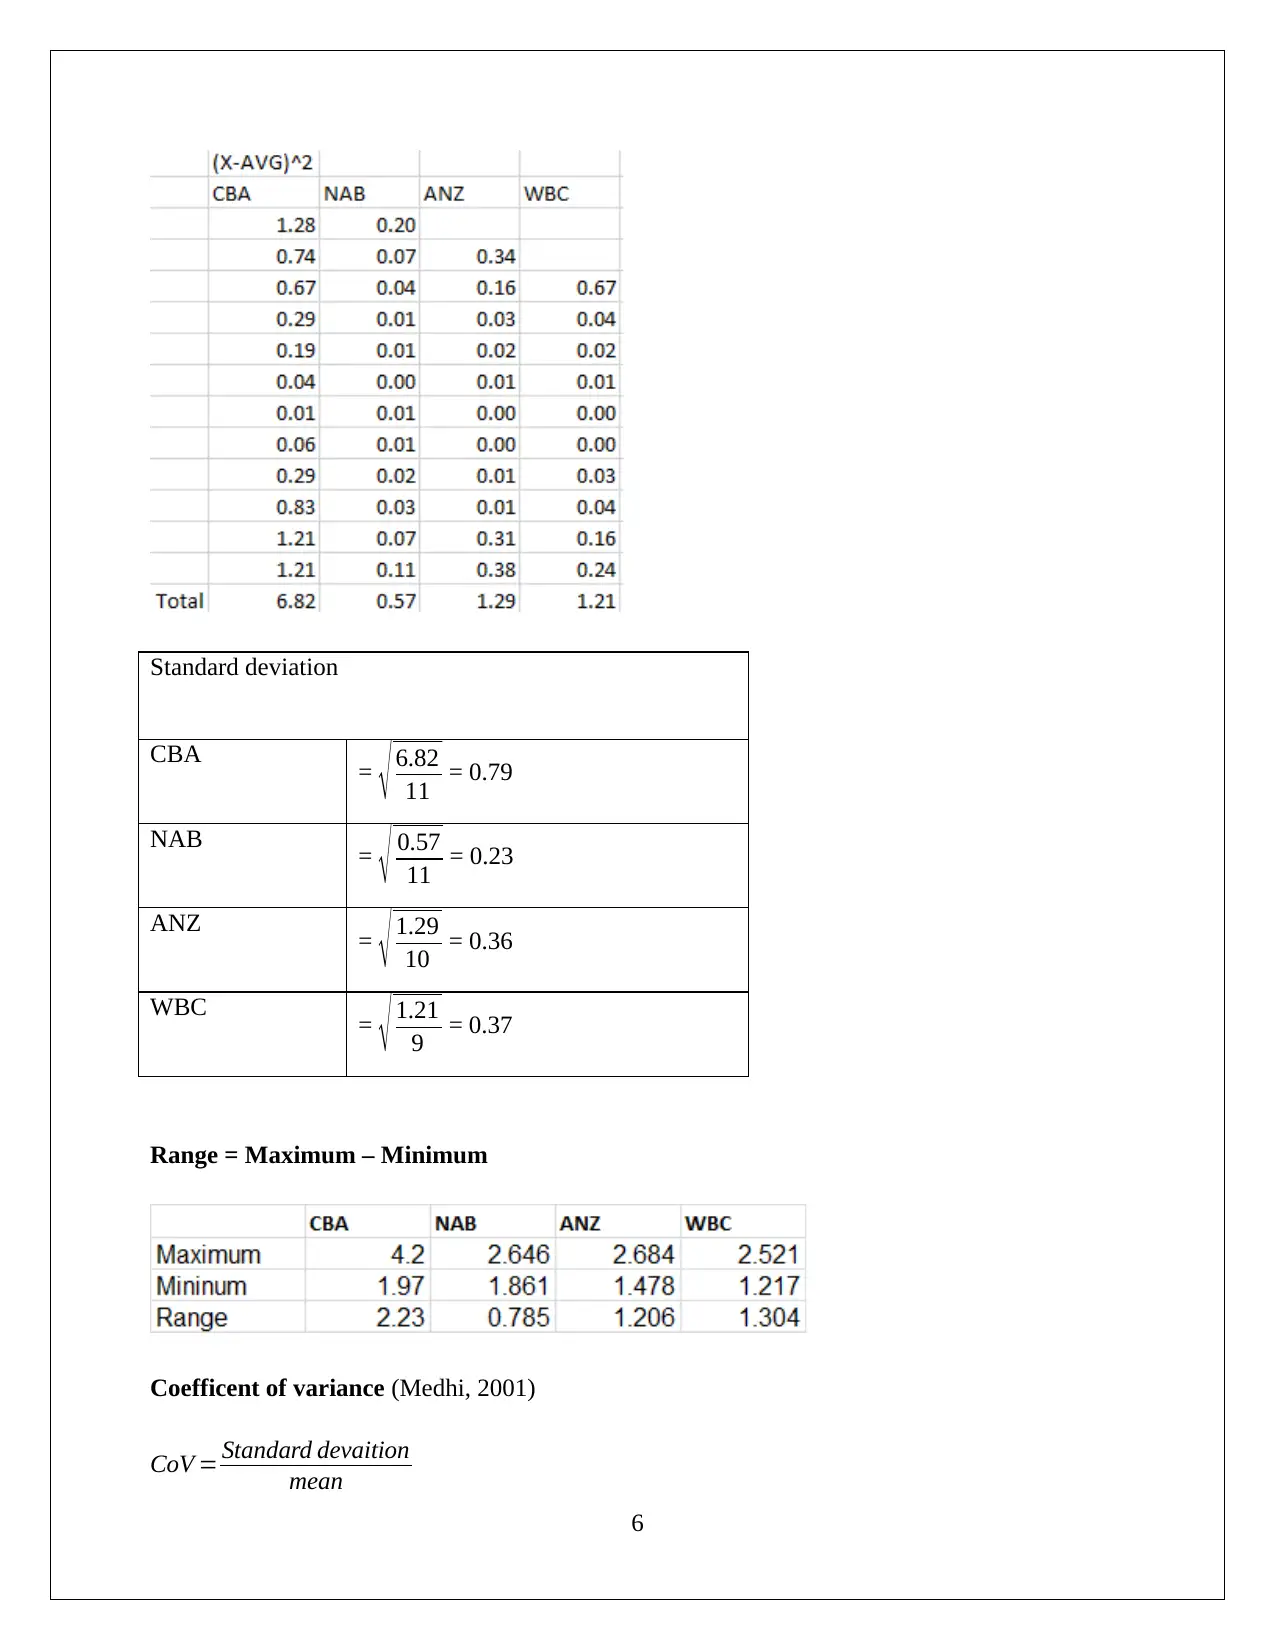
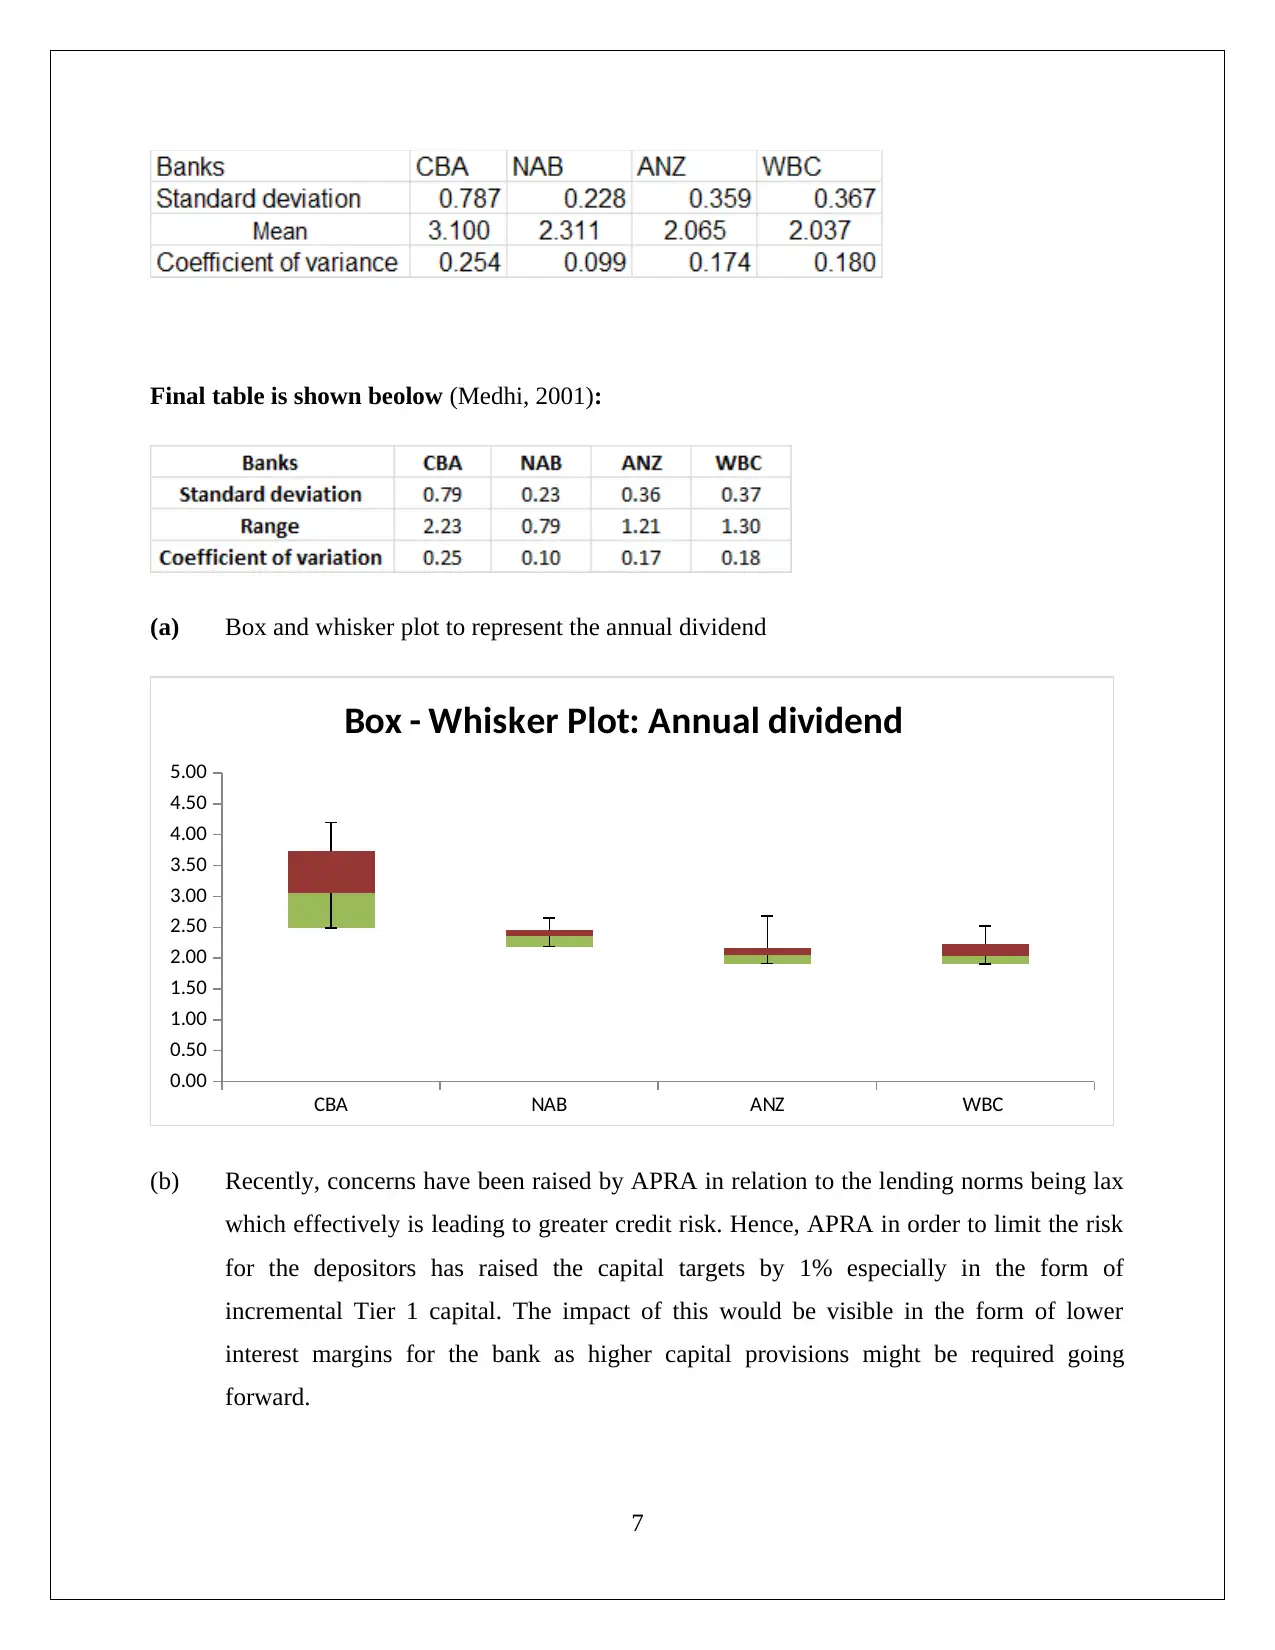
This document presents a comprehensive statistics assignment solution focused on financial data analysis. It includes analysis of stock prices (CWN.ASX and TAH.ASX) using stem and leaf plots and histograms, along with market capitalization considerations. The assignment further delves into the calculation of descriptive statistics such as mean, median, quartiles, standard deviation, and coefficient of variation for various banks (CBA, NAB, ANZ, WBC). The solution also covers probability calculations, including Poisson and normal distributions applied to weekly rainfall data, and hypothesis testing for various financial variables using p-values. Additionally, the assignment explores the relationship between ATAR scores and study disciplines, as well as the impact of APRA regulations on bank performance. The analysis is supported by relevant statistical methods and references, providing a detailed understanding of the application of statistics in financial decision-making.
tabler-icon-diamond-filled.svg

Contribute Materials

Your contribution can guide someone’s learning journey. Share your documents today.
Document Page
Statistics For Management Decision
Assessment -II
[Pick the date]
STUDENT ID
tabler-icon-diamond-filled.svg

Secure Best Marks with AI Grader

Need help grading? Try our AI Grader for instant feedback on your assignments.
Document Page
Question 1
(a)
Quarterly opening prices for CWN.ASX and TAH.ASX
Stem and leaf plot (TAH left leaf and CWN right leaf)
1
Document Page
Relative frequency histogram (CWN) along with frequency polygon (TAH)
0 to less
than 2 2 < 4 4 < 6 6 < 8 8 < 10 10 < 12 12 < 14 14 < 16 16 < 18
0
5
10
15
20
25
30
35
Relative frequency histogram and Frequency
Polygon
Opening Quarterly Price)
Relative frequency
2
Document Page
(c) Market capitalization for 2016
Village Roadshow
Tatts Group
Star Entertainment Group
Aristocrat Leisure
Tasracing
0 1 2 3 4 5 6
Bar Chart : Market Capitalization
Market Capitalization(Billion Australian Dollars)
Company NAME
(d) The analyst from Morningstar estimates that the Crown stock is undervalued while the TAH
stock is reasonably priced. This is also supported from the view emerging from Reuters. I
personally also agree with this analysis and would look into TAH only after the merger with
Tatts Group is completed and the subsequent synergies are realised.
Question 2
(a) The respective table for mean. 1st quartile, 3rd quartile and median (Taylor & Chihon, 2004)
3
tabler-icon-diamond-filled.svg

Secure Best Marks with AI Grader

Need help grading? Try our AI Grader for instant feedback on your assignments.
Document Page
Commonwealth Bank (CBA)
Mean =(1.97+2.24+2.56+2.66+2.28+2.9+3.2+3.34+3.64+4.01+4.2+4.2)/12 = 3.10
Median = (n+1)0.5th observation = 2.9 + 0.5(3.2-2.9) = 3.05
First
Quartile
=(n+1)1/4th observation= 2.28 + 0.25(2.28-2.56) = 2.59
Third
Quartile
= (n+1)3/4th observation = 3.64 + 0.75(4.01 – 3.64) = 3.92
National Australia Bank (NAB)
Mean =(2.215+2.474+2.646+2.572+1.861+2.048+2.393+2.325+2.443+2.105+2.235+2.4
17)/12 = 2.3111
Median = (n+1)0.5th observation = 2.325 + 0.5(2.393-2.325) = 2.359
First
Quartile
=(n+1)1/4th observation= 2.105 + (0.25)(2.215-2.105) = 2.133
Third
Quartile
= (n+1)3/4th observation = 2.443 + 0.75(2.474-2.443) = 2.466
New Zealand Banking Group (ANZ)
Mean =(1.478+1.665+1.886+1.934+1.95+2.048+2.098+2.163+2.183+2.624+2.684)/11
=2.065
Median = 6th observation = 2.048
First
Quartile
=(n+1)1/4th observation = 3rd observation = 1.886
4
Document Page
Third
Quartile
= (n+1)3/4th observation = 9th observation = 2.183
Westpac Bank (WBC)
Mean (1.217+1.83+1.943+1.895+1.99+2.08+2.216+2.433+2.521+2.242)/10 = 2.036
Median = 5.5th observation = 1.99 + 0.5(2.08-1.99) = 2.035
First
Quartile
= 2.75th observation = 1.83 + 0.75(1.895-1.83) = 1.879
Third
Quartile
= (n+1)3/4th observation = 8.25th observation = 2.242 + 0.25(2.433-2.242) = 2.290
Final table is shown below:
(b) The respective table for standard deviation, coefficient of variation and range (Fehr &
Grossman, 2003)
σ =( ( X X )2
N 1 )
5
Document Page
Standard deviation
CBA = 6.82
11 = 0.79
NAB = 0.57
11 = 0.23
ANZ = 1.29
10 = 0.36
WBC = 1.21
9 = 0.37
Range = Maximum – Minimum
Coefficent of variance (Medhi, 2001)
CoV = Standard devaition
mean
6
tabler-icon-diamond-filled.svg

Paraphrase This Document

Need a fresh take? Get an instant paraphrase of this document with our AI Paraphraser
Document Page
Final table is shown beolow (Medhi, 2001):
(a) Box and whisker plot to represent the annual dividend
CBA NAB ANZ WBC
0.00
0.50
1.00
1.50
2.00
2.50
3.00
3.50
4.00
4.50
5.00
Box - Whisker Plot: Annual dividend
(b) Recently, concerns have been raised by APRA in relation to the lending norms being lax
which effectively is leading to greater credit risk. Hence, APRA in order to limit the risk
for the depositors has raised the capital targets by 1% especially in the form of
incremental Tier 1 capital. The impact of this would be visible in the form of lower
interest margins for the bank as higher capital provisions might be required going
forward.
7
Document Page
Question 3
(a) After considering proportion of offers which has been made for different grades. It can be
seen that most popular for best student is found as “Engineering and Related
Technologies.”
Proportion = 30%.
(b) The value of probability that a selected student will study the “society and culture” and
also possess 80 or less than 80 as ATAR score.
Favourable case = (2814+2807+3806+5030 ¿=14,457.
Total possible case = 221060
Probability = ( 2814+2807+ 3806+5030
221060 )=0.0654
(c) The subject which shows highest proportion of student who has lowest ATAR grades =
Education
Proportion = 7.30 %
(d) The subject or discipline having highest representation from No ATAR and Non Year12
is health.
Reason: It is expected that the students who are not very intelligent in studies or do not
engage in the same may be more interested in physical sports and may be more fit. As a
result, a lot of these tend to get attracted towards courses related to health.
Question 4
8
Document Page
(a) Weekly rainfall: Poisson Distribution
Number of weeks = 52
Starting of first week = January 4, 2016
Total number of days which has reported rain = 135
Mean value = 135/52 = 2.596
(i) “The value of probability that in a week of a given year there would be no rainfall”
P ( x , μ ) = ( eμ μx
x ! ) (Medhi, 2001)
Where,
x=0 , μ=2.596 P= e μ μx
x !
¿ { e2.596 ( 2.596 ) 0
0 ! }
¿ 0.07451
1
¿ 0.0745
(ii) “The value of probability that there will be 2 days or more than 2 days of rainfall in a
week”
P ( x 2 ) =1P ( x<2)
From z table
P ( x<2 )=0.6299
P ( x 2 )=10.6299
9
tabler-icon-diamond-filled.svg

Secure Best Marks with AI Grader

Need help grading? Try our AI Grader for instant feedback on your assignments.
Document Page
¿ 0.37
(b) Weekly rainfall = Normal Distribution
Mean value of rainfall == 12.48
Standard deviation of rainfall = 14.58
(i) “The value of probability that in a week there will be rainfall between 8mm to 16 mm
rainfall”
Standard deviation = Standard deviation/sqrt (number of weeks) = ¿ ( 14.58
52 )=2.021
Here,
x1=8 , 16
μ=12.48 ,
σ =14.58
10
Document Page
P ( Z1 < Z< Z2 )=P (2.22< z <1.74 )
Z1 =( 812.48
2.021 )=2.22
Z2 =( 1612.48
2.021 )=1.74
P ( 2.22< z< 1.74 ) =0.9459(¿ z table)
(ii) “The total amount of rainfall only when 12% of week have the amount of rainfall or
higher”
Assume the amount is z mm.
P ( Rainfall amount > z ) =0.12
Z value thorough NORMSINV () = -1.174
Z=
( xμ
σ
n )
1.174=( x12.48
2.021 )
X = 10.10 mm amount of rainfall ‘
Question 5
(a) Normal probability plots (Medhi, 2001)
11
Document Page
Comment: Barring a few outliers, it is apparent that a linear trend is quite noticeable for all the
variables highlighted above and hence it would be fair to assume the given variables are
normally distributed.
(a) The value of confidence interval for independent variables is highlighted below:
12
tabler-icon-diamond-filled.svg

Paraphrase This Document

Need a fresh take? Get an instant paraphrase of this document with our AI Paraphraser
Document Page
(b) Hypothesis testing for the variables
The p value from the above table = 0.2065
Level of significance = 5%
13
Document Page
Null hypothesis would not be rejected as p value is higher than level of significance. The
conclusion can be drawn is that there is no statistically significant difference for those entities
which go bankrupt and those which do not.
(2) PS TS
The p value from the above table = 0
Level of significance = 5%
Null hypothesis would be rejected as p value is lower than level of significance. The conclusion
can be drawn is that there is a statistically significant difference between those entities which go
bankrupt and those which do not (Harmon, 2011).
(3) TC TS
14
Document Page
The p value from the above table = 0
Level of significance = 5%
Null hypothesis would be rejected as p value is lower than level of significance. The conclusion
can be drawn is that there is a statistically significant difference between those entities which go
bankrupt and those which do not (Lehman & Romano, 2006).
(4) TL TA
The p value from the above table = 0.0005
15
tabler-icon-diamond-filled.svg

Secure Best Marks with AI Grader

Need help grading? Try our AI Grader for instant feedback on your assignments.
Document Page
Level of significance = 5%
Null hypothesis would be rejected as p value is lower than level of significance. The conclusion
can be drawn is that there is a statistically significant difference between those entities which go
bankrupt and those which do not.
(5) WC TA
The p value from the above table = 0.0007
Level of significance = 5%
Null hypothesis would be rejected as p value is lower than level of significance. The conclusion
can be drawn is that there is a statistically significant difference between those entities which go
bankrupt and those which do not.
(6) OE TL
16
Document Page
The p value from the above table = 0.1248
Level of significance = 5%
Null hypothesis would not be rejected as p value is higher than level of significance. The
conclusion can be drawn is that there is no statistically significant difference for those entities
which go bankrupt and those which do not (Eriksson & Kovalainen , 2015).
17
Document Page
Reference
Eriksson, P. & Kovalainen, A. (2015). Quantitative methods in business research (3rd ed.). London:
Sage Publications.
Fehr, F. H., & Grossman, G. (2003). An introduction to sets, probability and hypothesis testing (3rd ed.).
Ohio: Heath.
Harmon, M. (2011). Hypothesis Testing in Excel - The Excel Statistical Master (7th ed.). Florida: Mark
Harmon.
Lehman, L. E. & Romano, P. J. (2006). Testing Statistical Hypotheses (3rd ed.). Berlin : Springer
Science & Business Media.
Medhi, J. (2001). Statistical Methods: An Introductory Text (4th ed.). Sydney: New Age International.
Taylor, K. J. & Cihon, C. (2004). Statistical Techniques for Data Analysis (2nd ed.). Melbourne: CRC
Press.
18
chevron_up_icon
1 out of 19
circle_padding
hide_on_mobile
zoom_out_icon
logo.png

Your All-in-One AI-Powered Toolkit for Academic Success.

Available 24*7 on WhatsApp / Email

[object Object]