Statistics for Financial Decisions - Weight and Customer Satisfaction

Verified

Added on  2020/04/21

|7
|1152
|75
Report
AI Summary
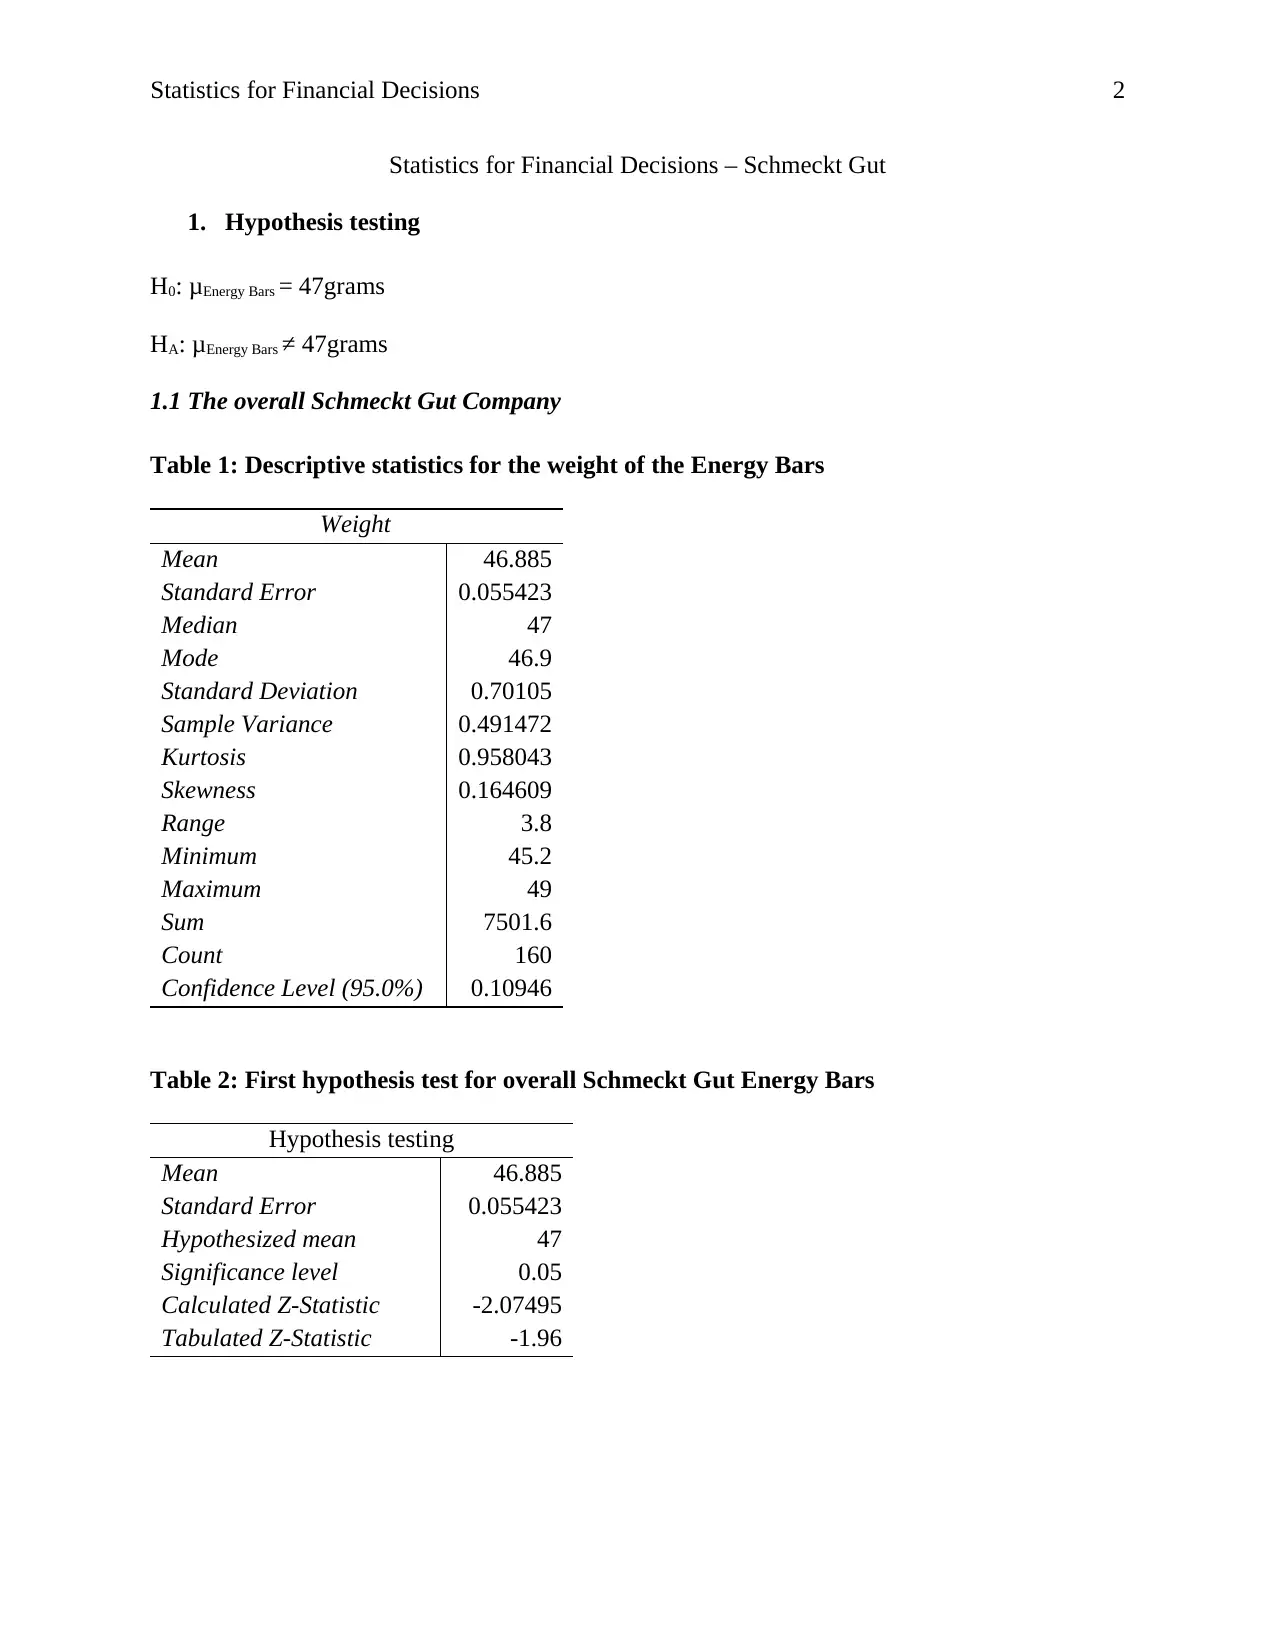
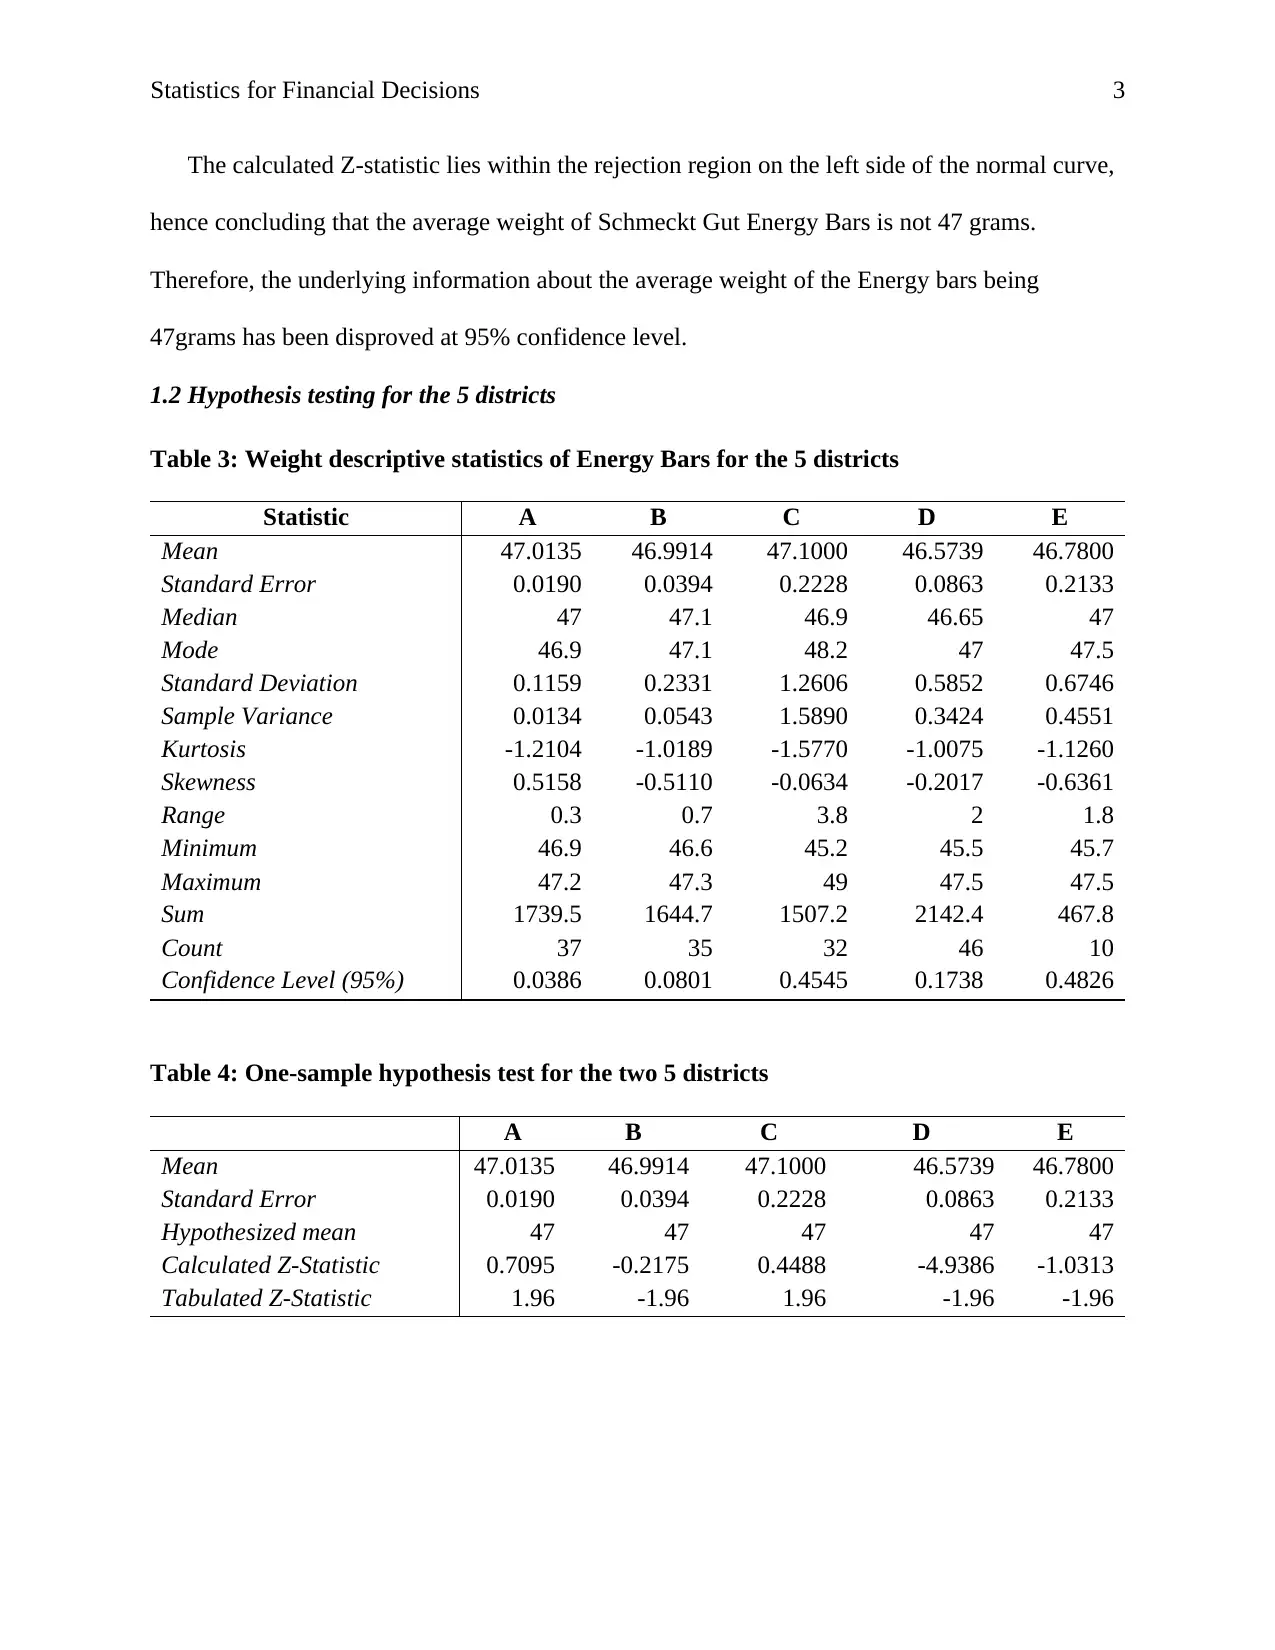
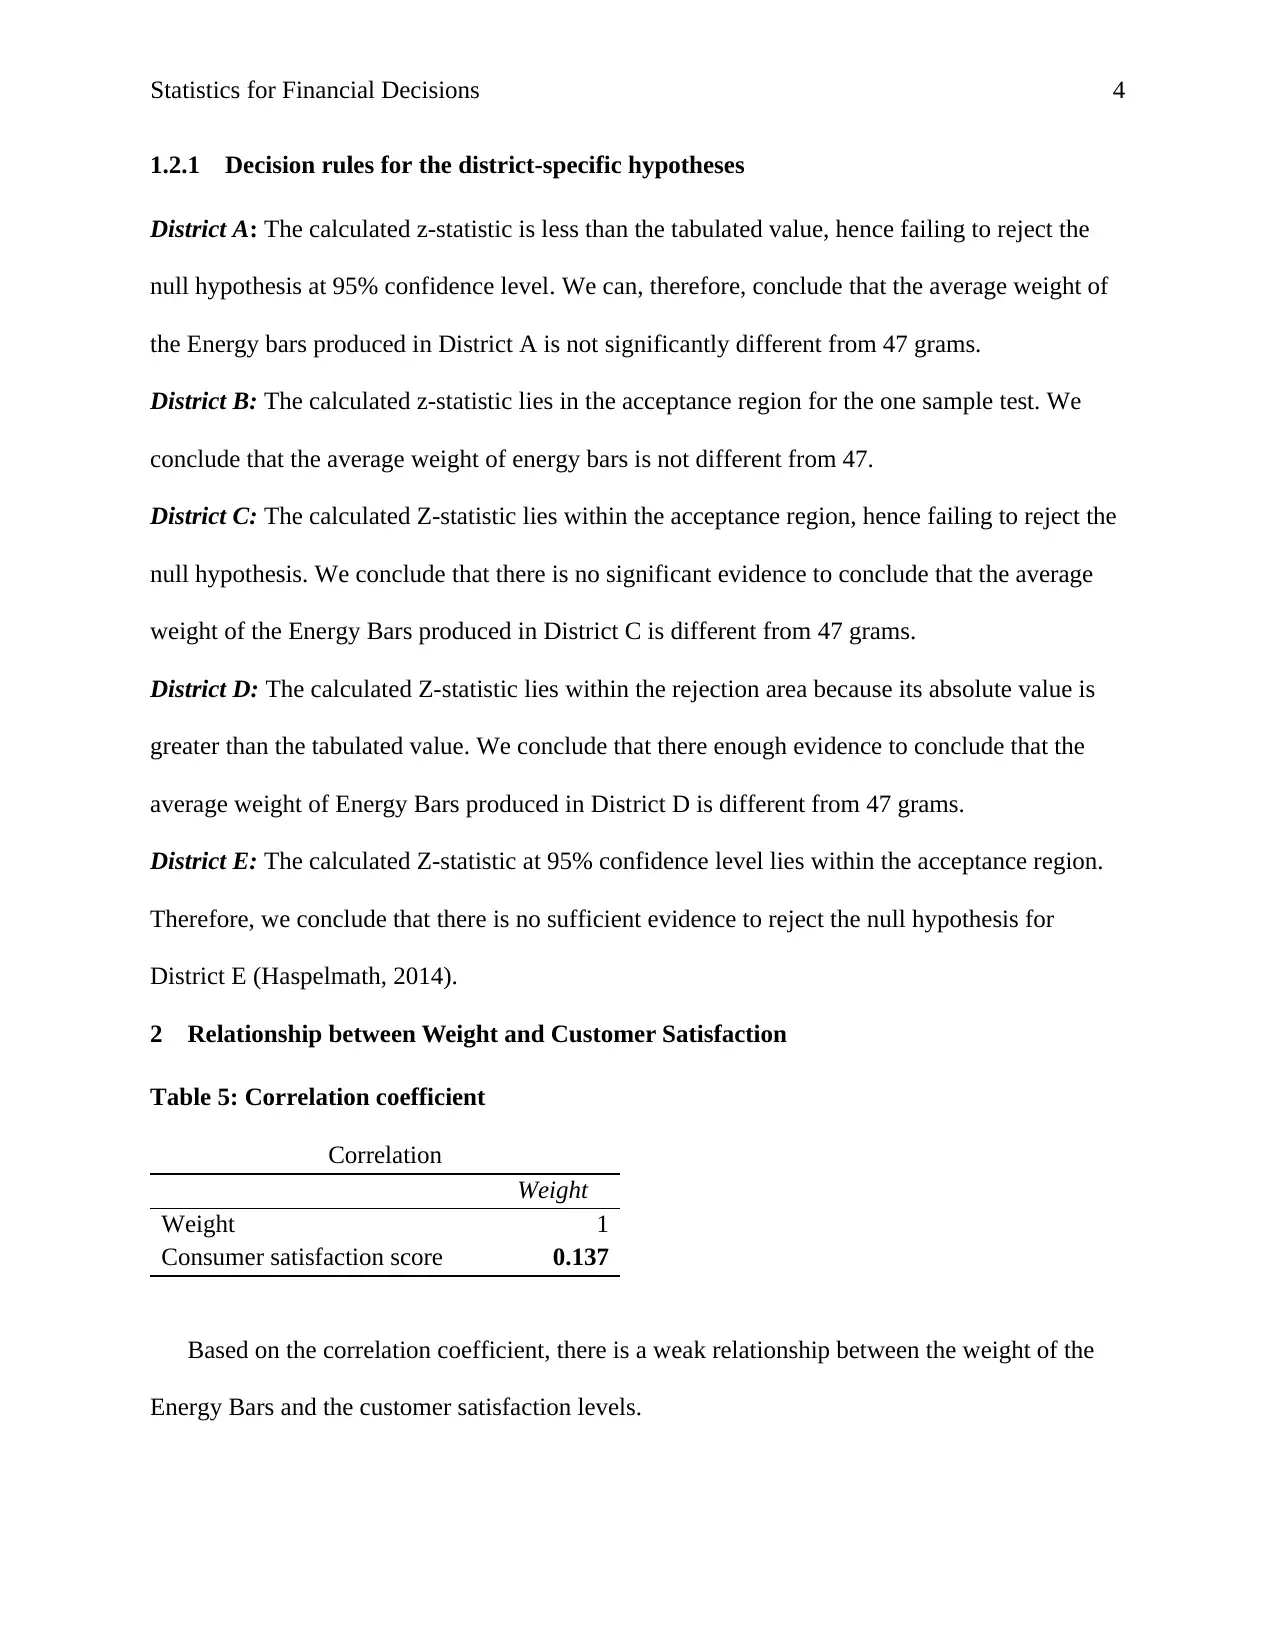
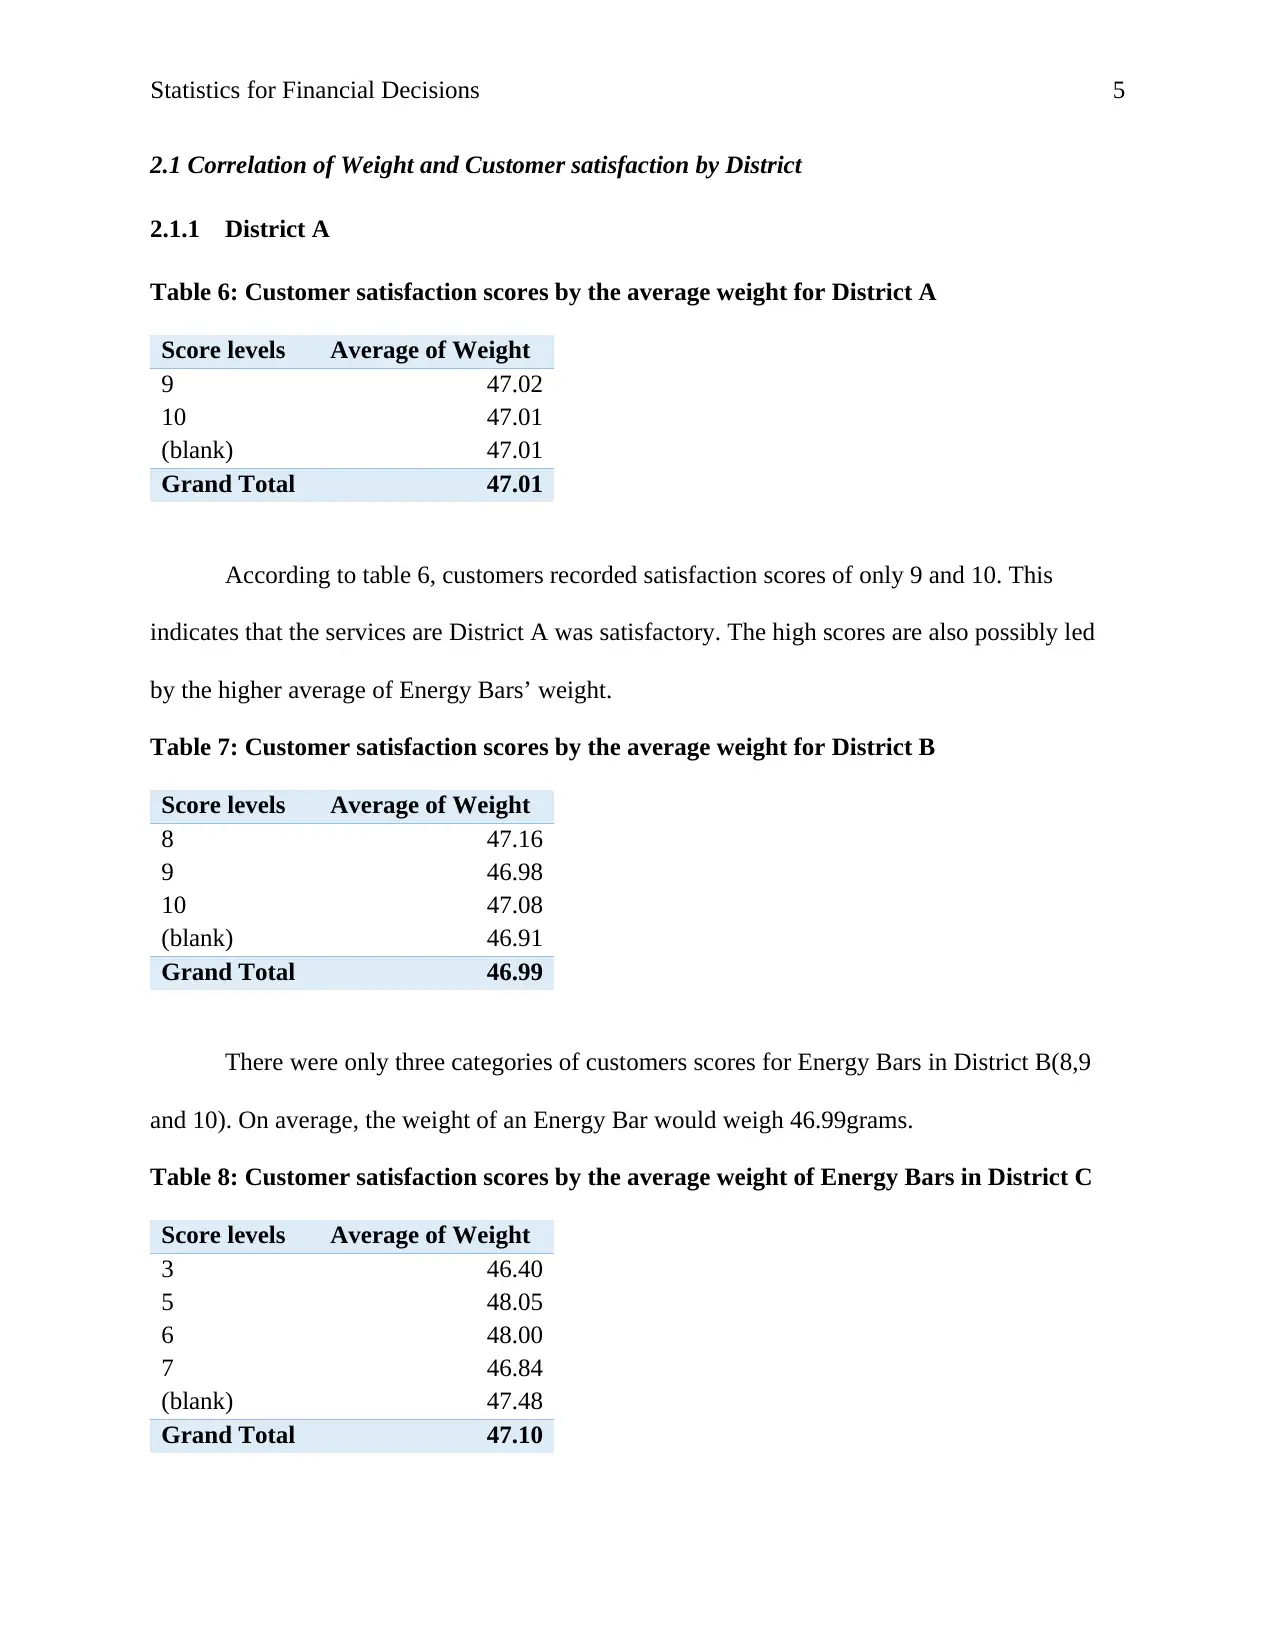
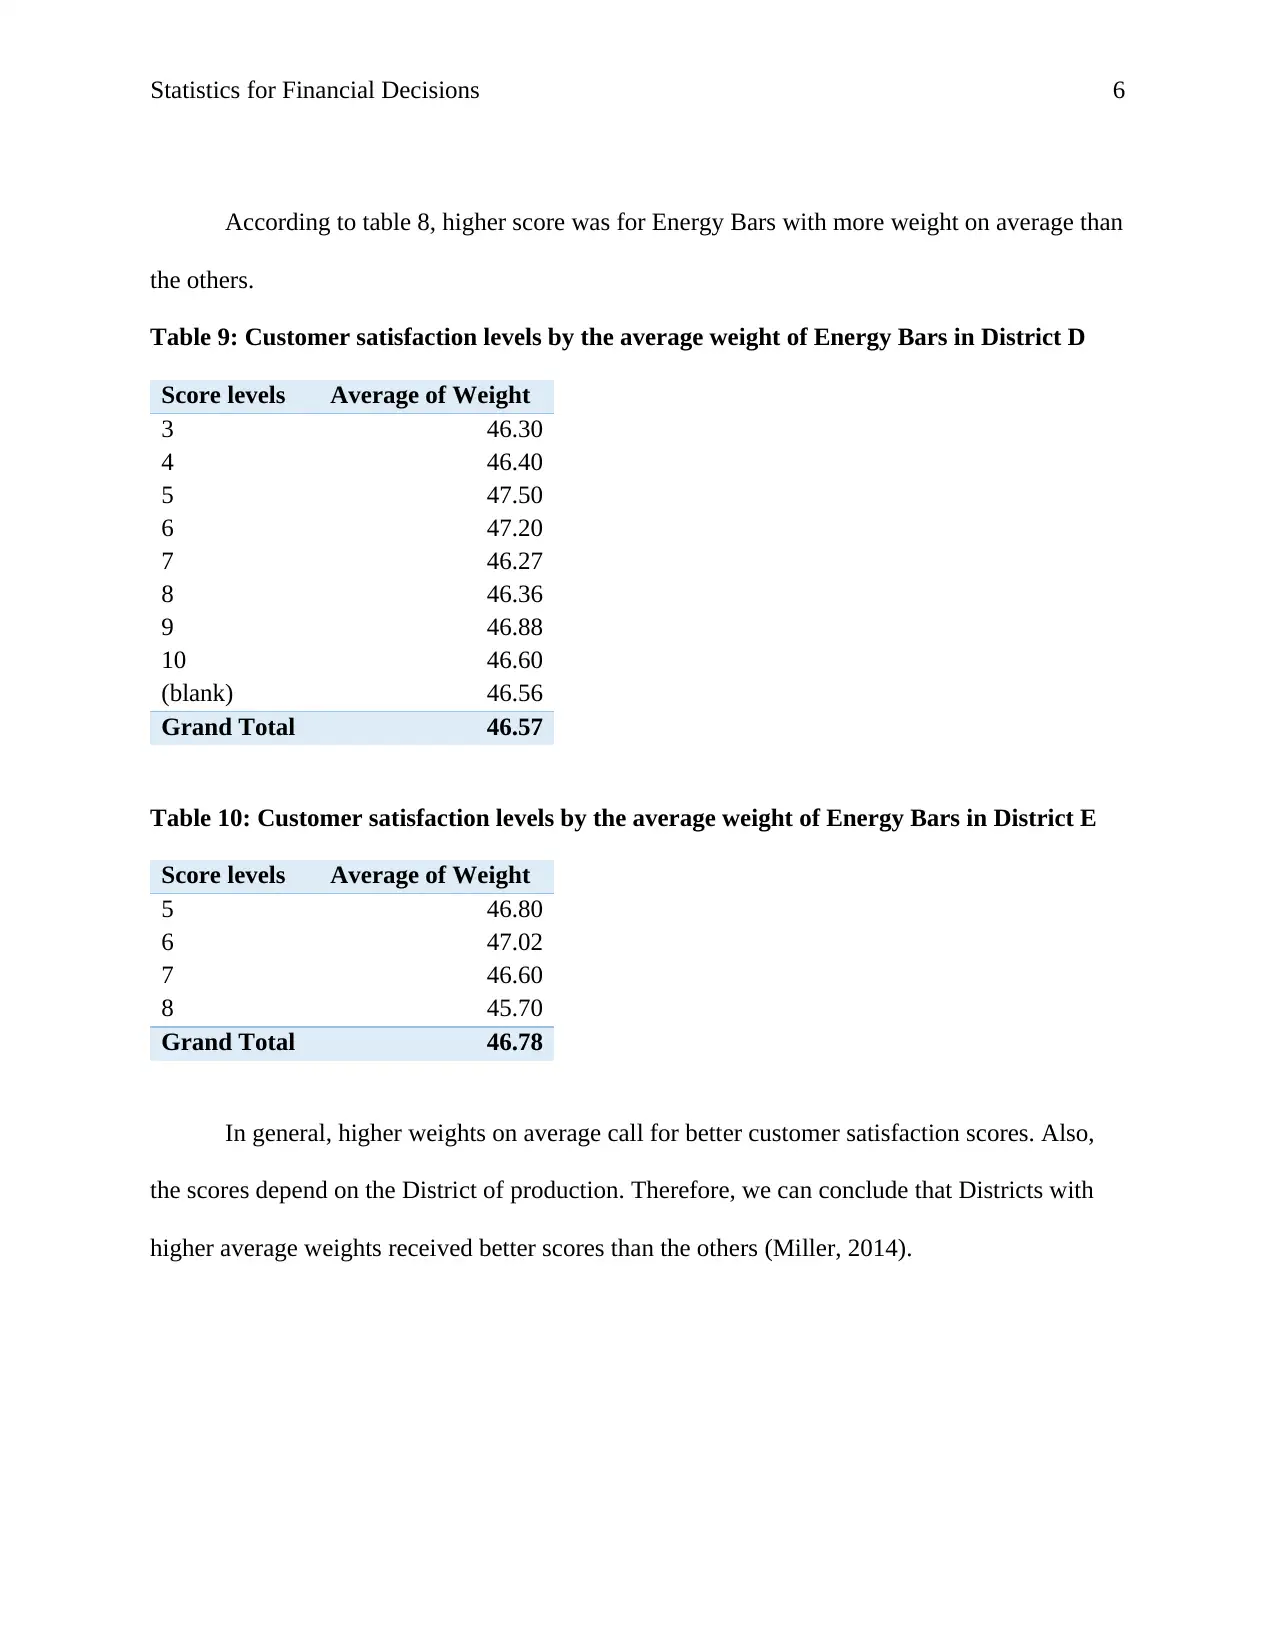
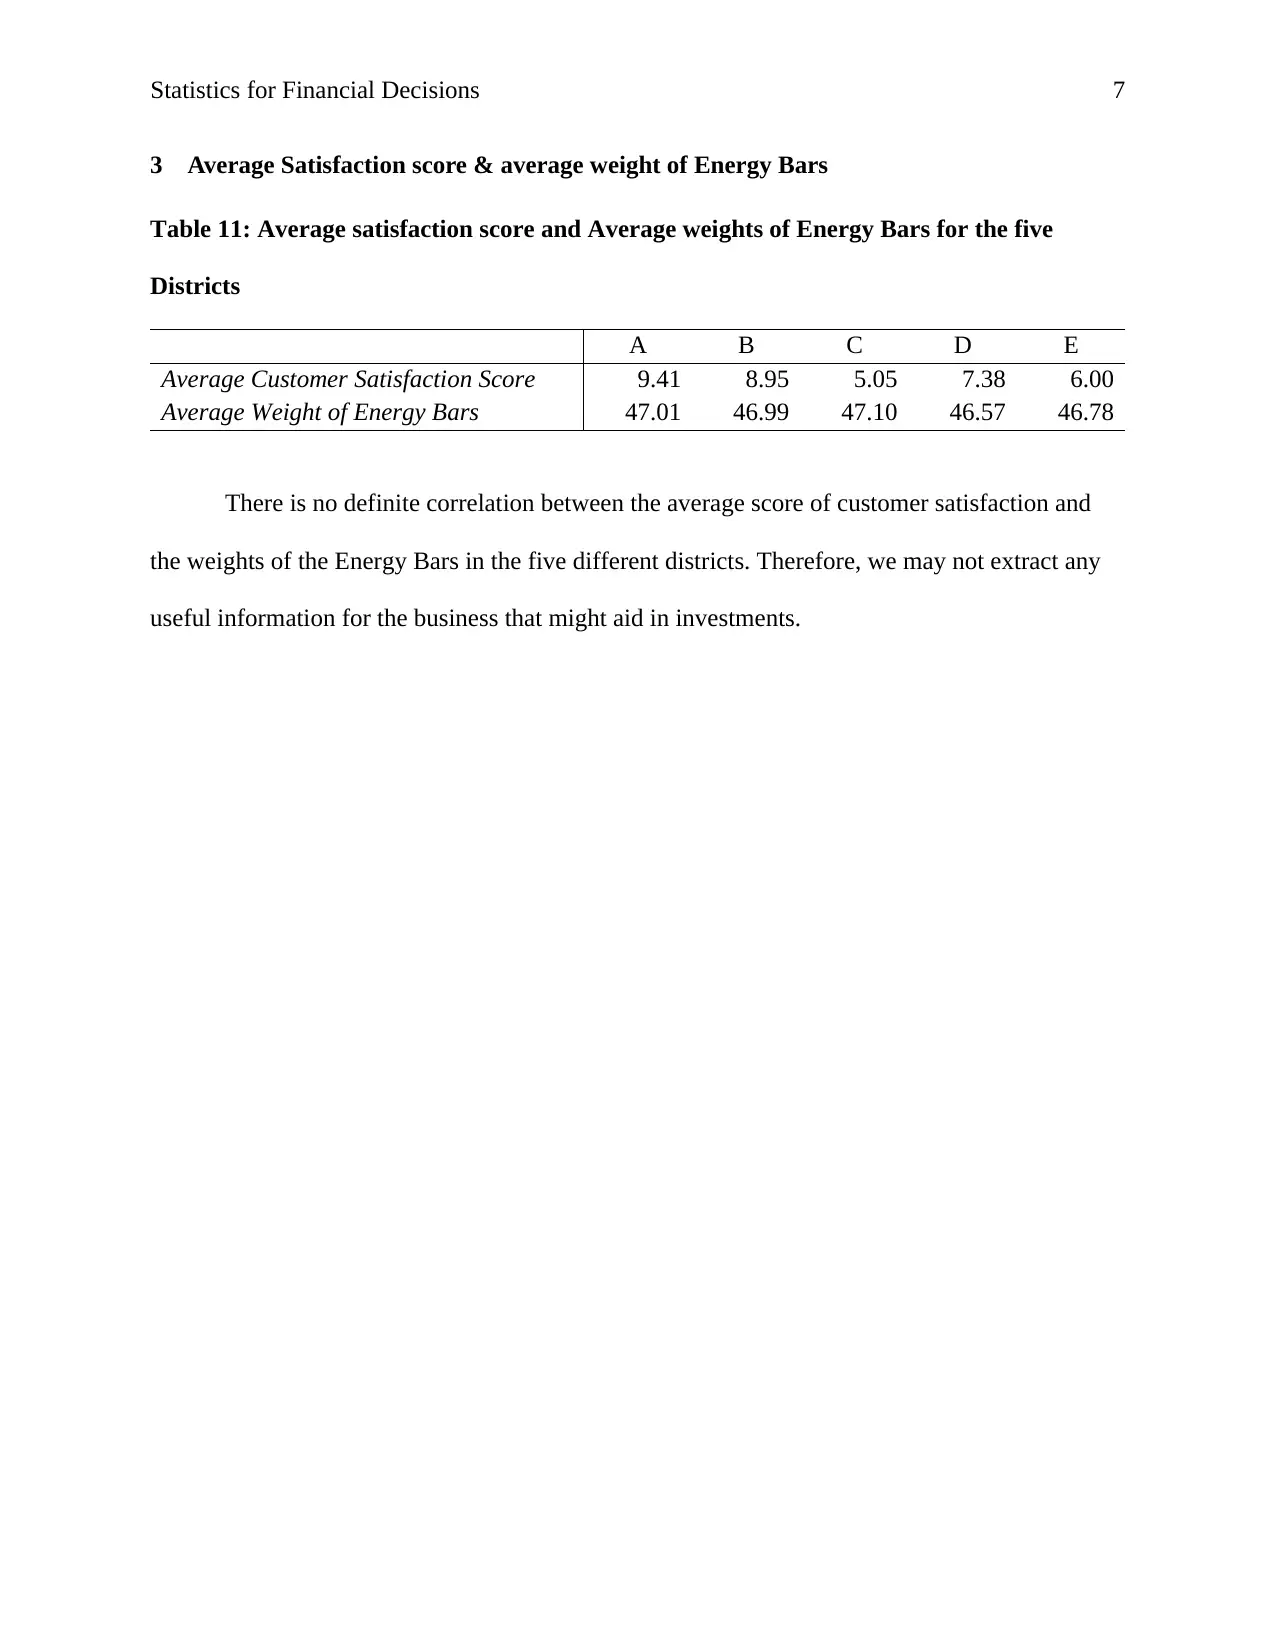
This report presents a statistical analysis of the Schmeckt Gut Company's energy bars, focusing on hypothesis testing to determine if the average weight of the bars is 47 grams. Descriptive statistics are provided for the overall company and for five different districts, including mean, standard error, and confidence levels. The analysis involves calculating Z-statistics and comparing them to tabulated values to accept or reject the null hypothesis. The report also examines the relationship between energy bar weight and customer satisfaction, using correlation coefficients and customer satisfaction scores categorized by district. The findings suggest a weak correlation between weight and customer satisfaction overall, but district-specific analyses reveal variations in satisfaction based on average weight. The report concludes with a summary of the average customer satisfaction scores and average weights of the energy bars in each district, highlighting the absence of a clear correlation that could aid in investment decisions. References to supporting literature are included.
Document Page
Statistics for Financial Decisions 1
STATISTICS FOR FINANCIAL DECISIONS – SCHMECKT GUT
Name
Course Number
Date
Faculty Name
tabler-icon-diamond-filled.svg

Paraphrase This Document

Need a fresh take? Get an instant paraphrase of this document with our AI Paraphraser
Document Page
Statistics for Financial Decisions 2
Statistics for Financial Decisions – Schmeckt Gut
1. Hypothesis testing
H0: μEnergy Bars = 47grams
HA: μEnergy Bars ≠ 47grams
1.1 The overall Schmeckt Gut Company
Table 1: Descriptive statistics for the weight of the Energy Bars
Weight
Mean 46.885
Standard Error 0.055423
Median 47
Mode 46.9
Standard Deviation 0.70105
Sample Variance 0.491472
Kurtosis 0.958043
Skewness 0.164609
Range 3.8
Minimum 45.2
Maximum 49
Sum 7501.6
Count 160
Confidence Level (95.0%) 0.10946
Table 2: First hypothesis test for overall Schmeckt Gut Energy Bars
Hypothesis testing
Mean 46.885
Standard Error 0.055423
Hypothesized mean 47
Significance level 0.05
Calculated Z-Statistic -2.07495
Tabulated Z-Statistic -1.96
Document Page
Statistics for Financial Decisions 3
The calculated Z-statistic lies within the rejection region on the left side of the normal curve,
hence concluding that the average weight of Schmeckt Gut Energy Bars is not 47 grams.
Therefore, the underlying information about the average weight of the Energy bars being
47grams has been disproved at 95% confidence level.
1.2 Hypothesis testing for the 5 districts
Table 3: Weight descriptive statistics of Energy Bars for the 5 districts
Statistic A B C D E
Mean 47.0135 46.9914 47.1000 46.5739 46.7800
Standard Error 0.0190 0.0394 0.2228 0.0863 0.2133
Median 47 47.1 46.9 46.65 47
Mode 46.9 47.1 48.2 47 47.5
Standard Deviation 0.1159 0.2331 1.2606 0.5852 0.6746
Sample Variance 0.0134 0.0543 1.5890 0.3424 0.4551
Kurtosis -1.2104 -1.0189 -1.5770 -1.0075 -1.1260
Skewness 0.5158 -0.5110 -0.0634 -0.2017 -0.6361
Range 0.3 0.7 3.8 2 1.8
Minimum 46.9 46.6 45.2 45.5 45.7
Maximum 47.2 47.3 49 47.5 47.5
Sum 1739.5 1644.7 1507.2 2142.4 467.8
Count 37 35 32 46 10
Confidence Level (95%) 0.0386 0.0801 0.4545 0.1738 0.4826
Table 4: One-sample hypothesis test for the two 5 districts
A B C D E
Mean 47.0135 46.9914 47.1000 46.5739 46.7800
Standard Error 0.0190 0.0394 0.2228 0.0863 0.2133
Hypothesized mean 47 47 47 47 47
Calculated Z-Statistic 0.7095 -0.2175 0.4488 -4.9386 -1.0313
Tabulated Z-Statistic 1.96 -1.96 1.96 -1.96 -1.96
Document Page
Statistics for Financial Decisions 4
1.2.1 Decision rules for the district-specific hypotheses
District A: The calculated z-statistic is less than the tabulated value, hence failing to reject the
null hypothesis at 95% confidence level. We can, therefore, conclude that the average weight of
the Energy bars produced in District A is not significantly different from 47 grams.
District B: The calculated z-statistic lies in the acceptance region for the one sample test. We
conclude that the average weight of energy bars is not different from 47.
District C: The calculated Z-statistic lies within the acceptance region, hence failing to reject the
null hypothesis. We conclude that there is no significant evidence to conclude that the average
weight of the Energy Bars produced in District C is different from 47 grams.
District D: The calculated Z-statistic lies within the rejection area because its absolute value is
greater than the tabulated value. We conclude that there enough evidence to conclude that the
average weight of Energy Bars produced in District D is different from 47 grams.
District E: The calculated Z-statistic at 95% confidence level lies within the acceptance region.
Therefore, we conclude that there is no sufficient evidence to reject the null hypothesis for
District E (Haspelmath, 2014).
2 Relationship between Weight and Customer Satisfaction
Table 5: Correlation coefficient
Correlation
Weight
Weight 1
Consumer satisfaction score 0.137
Based on the correlation coefficient, there is a weak relationship between the weight of the
Energy Bars and the customer satisfaction levels.
tabler-icon-diamond-filled.svg

Paraphrase This Document

Need a fresh take? Get an instant paraphrase of this document with our AI Paraphraser
Document Page
Statistics for Financial Decisions 5
2.1 Correlation of Weight and Customer satisfaction by District
2.1.1 District A
Table 6: Customer satisfaction scores by the average weight for District A
Score levels Average of Weight
9 47.02
10 47.01
(blank) 47.01
Grand Total 47.01
According to table 6, customers recorded satisfaction scores of only 9 and 10. This
indicates that the services are District A was satisfactory. The high scores are also possibly led
by the higher average of Energy Bars’ weight.
Table 7: Customer satisfaction scores by the average weight for District B
Score levels Average of Weight
8 47.16
9 46.98
10 47.08
(blank) 46.91
Grand Total 46.99
There were only three categories of customers scores for Energy Bars in District B(8,9
and 10). On average, the weight of an Energy Bar would weigh 46.99grams.
Table 8: Customer satisfaction scores by the average weight of Energy Bars in District C
Score levels Average of Weight
3 46.40
5 48.05
6 48.00
7 46.84
(blank) 47.48
Grand Total 47.10
Document Page
Statistics for Financial Decisions 6
According to table 8, higher score was for Energy Bars with more weight on average than
the others.
Table 9: Customer satisfaction levels by the average weight of Energy Bars in District D
Score levels Average of Weight
3 46.30
4 46.40
5 47.50
6 47.20
7 46.27
8 46.36
9 46.88
10 46.60
(blank) 46.56
Grand Total 46.57
Table 10: Customer satisfaction levels by the average weight of Energy Bars in District E
Score levels Average of Weight
5 46.80
6 47.02
7 46.60
8 45.70
Grand Total 46.78
In general, higher weights on average call for better customer satisfaction scores. Also,
the scores depend on the District of production. Therefore, we can conclude that Districts with
higher average weights received better scores than the others (Miller, 2014).
Document Page
Statistics for Financial Decisions 7
3 Average Satisfaction score & average weight of Energy Bars
Table 11: Average satisfaction score and Average weights of Energy Bars for the five
Districts
A B C D E
Average Customer Satisfaction Score 9.41 8.95 5.05 7.38 6.00
Average Weight of Energy Bars 47.01 46.99 47.10 46.57 46.78
There is no definite correlation between the average score of customer satisfaction and
the weights of the Energy Bars in the five different districts. Therefore, we may not extract any
useful information for the business that might aid in investments.
chevron_up_icon
1 out of 7
circle_padding
hide_on_mobile
zoom_out_icon
[object Object]