Statistics for Management: Analysis of Earnings and Ordering

Verified

Added on  2020/10/05

|19
|3721
|88
Report
AI Summary
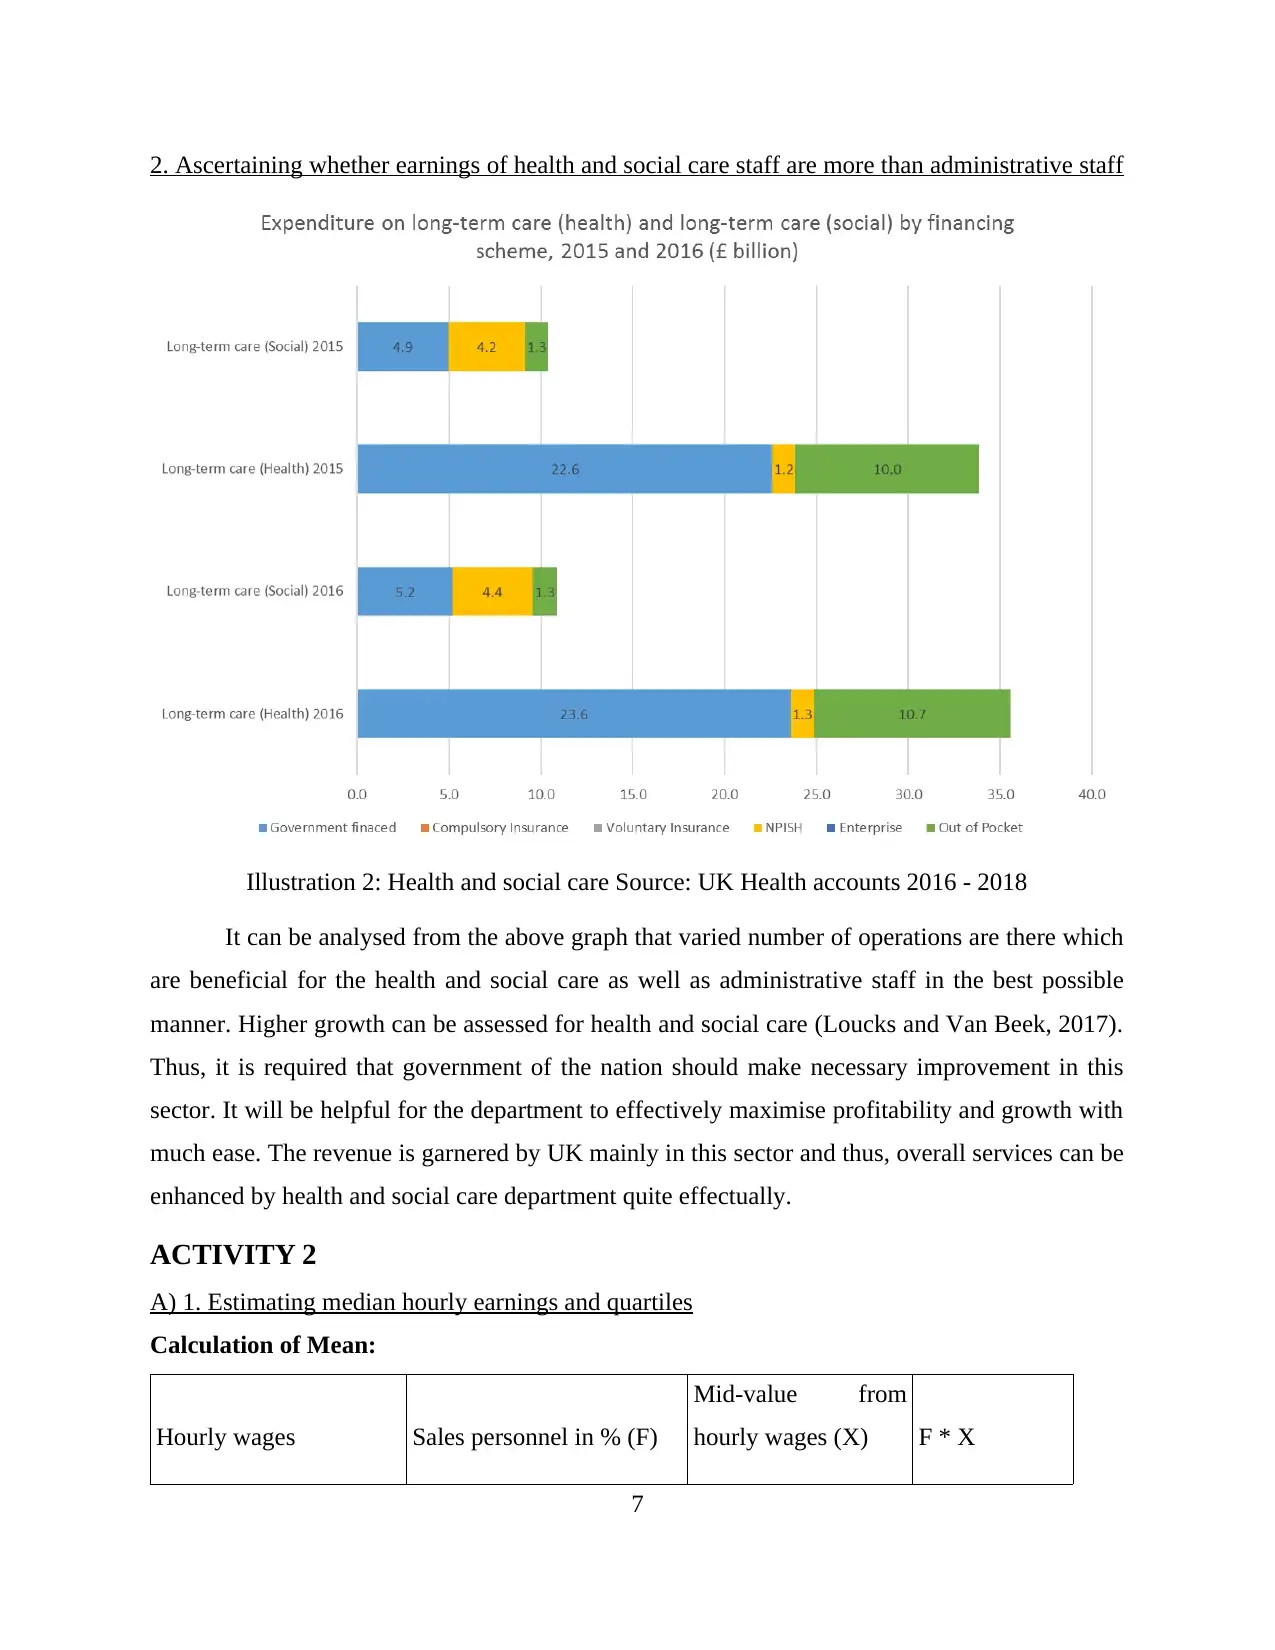
This report provides a comprehensive statistical analysis of various management aspects. It begins with an examination of annual earnings in both public and private sectors, comparing changes in gross earnings and the gender pay gap. The report then delves into data from the Office for National Statistics (ONS), comparing earnings across different sectors like education and finance, and health and social care versus administrative staff. Further analysis includes estimating median hourly earnings, computing mean and standard deviation, and comparing earnings in two regions. The report also explores operational aspects, such as delivery quantities, calculating the Economic Order Quantity (EOQ), and providing recommendations on ordering policies. Finally, the report presents visual representations of the data through line charts and ogives, summarizing key findings and conclusions. The report utilizes statistical tools to interpret data, identify trends, and make informed decisions related to employment, earnings, and operational efficiency. This report is valuable for students seeking insights into data analysis and statistical applications in business management.
Document Page
Statistics for Management
tabler-icon-diamond-filled.svg

Paraphrase This Document

Need a fresh take? Get an instant paraphrase of this document with our AI Paraphraser
Document Page
TABLE OF CONTENTS
INTRODUCTION...........................................................................................................................1
ACTIVITY 1....................................................................................................................................1
A) Annual earnings of employees in public and private sector..............................................1
1. Changes in gross earnings annually in both sector.............................................................1
2. Gap between male and female in gross earnings................................................................3
B) Statistics given by ONS (Office for National Statistics)...................................................6
1. Gap between education and finance...................................................................................6
2. Ascertaining whether earnings of health and social care staff are more than administrative
staff.........................................................................................................................................7
ACTIVITY 2....................................................................................................................................7
A) 1. Estimating median hourly earnings and quartiles.........................................................7
2. Compute mean and standard deviation for hourly earnings...............................................9
B) Comparison of earnings in two regions...........................................................................10
ACTIVITY 3..................................................................................................................................10
A) Deliveries made in each year..........................................................................................10
B) Determining number of bags currently delivered with delivery.....................................11
C) Calculating EOQ (Economic Order Quantity)................................................................12
D) Providing recommendation and comparing new and existing ordering policies............13
ACTIVITY 4..................................................................................................................................13
A) Producing line chart of male and female gross annual earnings for public and private sector
..............................................................................................................................................13
B) Preparing ogive as per Activity 2 of hourly earnings......................................................15
CONCLUSION..............................................................................................................................15
REFERENCES..............................................................................................................................16
Document Page
INTRODUCTION
The implication of statistical tools in business operations are helpful and beneficial as, to
have appropriate revenue generation as well as execution of the operations. It comprises with the
mathematical observations and techniques to resolve the huge data set and analyse the logical
reasons behind issues. However, in the following study there will be determination of details
relevant with employments in public and private sector. Similarly, to analyse the requirement of
industrial operations such as production level as well as profitability through various methods of
analysis, statistical tools are applied.
ACTIVITY 1
A) Annual earnings of employees in public and private sector
1. Changes in gross earnings annually in both sector
Male
Year Private sector
employees
Change in salary
on annual basis
in %
Public sector
employees
Change in
salary on
annual basis in
%
2010 31264 27000
2011 31380 0.37% 27233 0.86%
2012 31816 1.39% 27705 1.73%
2013 32541 2.28% 28201 1.79%
2014 32878 1.04% 28442 0.85%
2015 33685 2.45% 28881 1.54%
2016 34011 0.97% 29679 2.76%
1
Document Page
2010 2011 2012 2013 2014 2015 2016
0
5000
10000
15000
20000
25000
30000
35000
Private
Public
Interpretation- It can be interpreted from the above graph that there has been drastic
changes in salaries of male workers from 2010 to 2016. It is clarified from the fact that male
employees in private entity have more earnings as compared to public sector. Moreover, earnings
in percentage are drafted in the table. It was 0.37 % in 2011 financial year, increased to 1.39 %
and further raised to 2.28 % in 2012 and 2013 respectively. Moreover, it reached to 1.04 % in
2014 and 2.45 % in 2015 and 0.97 % in 2016. On the other hand, public entity employees'
salaries are also increased but not more than private sector.
Female
Year Private sector
employees
Change in salary
on annual basis
in %
Public sector
employees
Change in
salary on
annual basis in
%
2010 26113 19532
2011 26470 1.37% 19565 0.17%
2012 26636 0.63% 20313 3.82%
2
tabler-icon-diamond-filled.svg

Paraphrase This Document

Need a fresh take? Get an instant paraphrase of this document with our AI Paraphraser
Document Page
2013 27338 2.64% 20698 1.90%
2014 27705 1.34% 21017 1.54%
2015 27900 0.70% 21403 1.84%
2016 28053 0.55% 22251 3.96%
2010 2011 2012 2013 2014 2015 2016
0
5000
10000
15000
20000
25000
30000
Private
Public
Interpretation- It can be analysed from the above table that earnings of private sector
employee's in female are more as compared to females in public sector. It is evident from the
figures that % in change annual earnings were 1.37 % in 2011, 0.63 in 2012, increased to 2.64 %
in next year, 1.34 % in 2014 and 0.70 % in the financial year 2015 and 0.55 % in 2016 (Chiu, &
Chen, 2018). While, public sector employees, salaries were incremented to 0.17 % in 2011, 3.82
% in 2012, 1.90 % in 2013, 1.54 % in financial year 2014 and 1.84 % as well as 3.96 % in 2015
and 2016 respectively.
2. Gap between male and female in gross earnings
Private entity
Year Male workers Female workers Total Gap
2010 31254 26113 5141
3
Document Page
2011 31380 26470 4910
2012 31816 26636 5180
2013 32541 27338 5203
2014 32878 27705 5173
2015 33685 27900 5785
2016 34011 28053 5958
2010 2011 2012 2013 2014 2015 2016
0
1000
2000
3000
4000
5000
6000
Interpretation- The above graph shows changes or gap found in private sector males and
females from the period of 2010 to 2016. It clarifies that gross annual earnings of male
employees are more than females in this sector. This is evident from the data that salaries are
maximised from 2010 to 2016. The total gap found in 2010 was 5141, 4910 in 2011, 5180 in
2012, 5203 in the financial year 2013, 5173 in 2014, increased to 5785 in 2015 and 5958 in
2016.
Public entity
Year Male workers Female workers Total Gap
4
Document Page
2010 27000 19532 7468
2011 27233 19565 7668
2012 27705 20313 7392
2013 28201 20698 7503
2014 28442 21017 7425
2015 28881 21403 7478
2016 29679 22251 7428
2010 2011 2012 2013 2014 2015 2016
7250
7300
7350
7400
7450
7500
7550
7600
7650
7700
Interpretation- It can be interpreted that annual gross earnings of male workers is much
higher than female workers in the public sector (David Sam Jayakumar, Solairaju and Sulthan,
2018). The total gap analysed in above listed periods are average of 7400 and thus, it is justified
that male earnings are more in recent years. On the other hand, there are no such changes and
gaps in public sector earnings. In relation to comparison of private and public sector, higher gap
is found in public entity employees.
5
tabler-icon-diamond-filled.svg

Paraphrase This Document

Need a fresh take? Get an instant paraphrase of this document with our AI Paraphraser
Document Page
The male and female gross earnings' gap can be assessed from above charts. It shows
clearly that males are paid higher pays in comparison to females. The gap is much in private and
public sector. However, it has been reduced over the year and government is planning to provide
equal wages to employees irrespective of their genders.
B) Statistics given by ONS (Office for National Statistics)
1. Gap between education and finance
Illustr
ation 1: Example of UK's employment environment
(Source: Trends in self-employment in the UK: 2001 to 2015, 2018)
The above graph which shows gap between education and finance sectors of the nation
highlihting gap in effective way. It can be found that there are various government policies
which have been implemented by UK government in order to reduce the impact of GFC (Global
Financial Crisis) and to inject overall growth of economy in the best possible manner. In above
listed sectors, there are fields of part-time and full-time employment (Chatterjee and et.al, 2017).
It can be assessed that financial sector has higher growth in comparison to education sector.
Hence, full-time employment is leading among other entities which is financial entity.
6
Document Page
2. Ascertaining whether earnings of health and social care staff are more than administrative staff
Illustration 2: Health and social care Source: UK Health accounts 2016 - 2018
It can be analysed from the above graph that varied number of operations are there which
are beneficial for the health and social care as well as administrative staff in the best possible
manner. Higher growth can be assessed for health and social care (Loucks and Van Beek, 2017).
Thus, it is required that government of the nation should make necessary improvement in this
sector. It will be helpful for the department to effectively maximise profitability and growth with
much ease. The revenue is garnered by UK mainly in this sector and thus, overall services can be
enhanced by health and social care department quite effectually.
ACTIVITY 2
A) 1. Estimating median hourly earnings and quartiles
Calculation of Mean:
Hourly wages Sales personnel in % (F)
Mid-value from
hourly wages (X) F * X
7
Document Page
0-10 8 5 40
01/10/20 46 15 690
20-30 26 25 650
30-40 14 35 490
40-50 6 45 270
Total 100 2140
Mean ∑FX 2140 21.4
∑F 100
Calculation of Median:
Hourly wages Employees (F) R (frequency)
Cumulative
Frequency CRF
0-10 8 8.00% 8 8.00%
01/10/20 46 46.00% 54 54.00%
20-30 26 26.00% 80 80.00%
30-40 14 14.00% 94 94.00%
40-50 6 6.00% 100 100.00%
Total 100
It can be interpreted from the above calculation of mean and median that revenue
generated by workers on the basis of hourly wages are being determined. From such calculation,
8
tabler-icon-diamond-filled.svg

Paraphrase This Document

Need a fresh take? Get an instant paraphrase of this document with our AI Paraphraser
Document Page
employee's worked hourly basis of less than 10 hours have earning capacity of 8 %. Similarly,
when hourly wages are in between 10-20, 46 % of revenue is generated. On the other hand, 26 %
of revenue was 14 % and 40-50 was 6 %. Thus, it can be said that major revenue is generated
from 10-20 and 20-30 collectively of 72 %. Moreover, mean calculated is 21.4 which is good as
it is helpful in assessing the earnings of sales personnel.
2. Compute mean and standard deviation for hourly earnings
Hourly wages Employees (F)
Mid-value
from
hourly
wages (X) F * X Dx= X-A FDX FDX
0-10 8 5 40 -20 -160 3200
01/10/20 46 15 690 -10 -460 4600
20-30 26 25 650 0 0 0
30-40 14 35 490 10 140 1400
40-50 6 45 270 20 120 2400
Total 100 2140 -360 11600
Interpretation: The above chart shows that hourly worked accomplished by South-East
employees in effective way (Noor-Ul-Amin, Mushtaq and Hanif, 2018). The standard deviation
and mean are computed in order to attain proper analysis of the data. It can be interpreted that
value of mean calculated amounts to 21.4 and on the other hand, standard deviation is 10.15. It
clearly shows that standard deviation is lower than that of mean value. Hence, it is clarified that
9
Document Page
labour hours employed are productive and as such, there will be nearly recruitment of fewer
workers in order to accomplish desired production in the best possible manner.
The difference in mean and standard deviation value is different which means that there
is no need for recruitment of workers for accomplishing production in a better way. Furthermore,
among the other regions of employees, South-East workers are more productive and as mean is
21.4 and standard deviation comes to 10.15. Thus, it can be analysed that South-East region
workers are far better in terms of efficiencies than North-West region.
B) Comparison of earnings in two regions
Interpretation: The statistical tools have been applied to ascertain earning capacity of
two different regions of the nation. Analysis is done by implementing mean, standard deviation
and median to effectively analyse two regions and provide conclusion thereof of North-West and
South-East workers. It can be assessed that employees of South-East region are highly efficient
and productive in comparison to other region (Cawthorn and Mariani, 2017). This is evident
from the fact that value of mean of South-East employees is 21.4 while of North-west employees
is 16.70 which is lower in comparison to the South-East workers in effective way and hence,
enhanced revenue is garnered by employees. On the other hand, standard deviation of North-
west workers is 7.4 and of other region is 10.15. It shows that South-East employees have more
median value. Such value of 19.13 and 14.50 of South-East and North-west respectively. It can
be said that median of South-East region is more in this aspect as well. Hence, it can be assessed
that personnel of South-East region are highly productive then other region.
The earnings have been calculated in above table showing total earnings made by North-
West and South-East region workers. The mean value, median value and standard deviation of
South-East employees are high in comparison to other region. This is evident from the fact that
median value of South-East is more by 4.63, mean by 4.7 and standard deviation by 2.75 which
10
chevron_up_icon
1 out of 19
circle_padding
hide_on_mobile
zoom_out_icon
[object Object]