Statistics Assignment: Frequency Distributions Analysis, Data

Verified

Added on  2019/09/23

|4
|280
|395
Homework Assignment
AI Summary
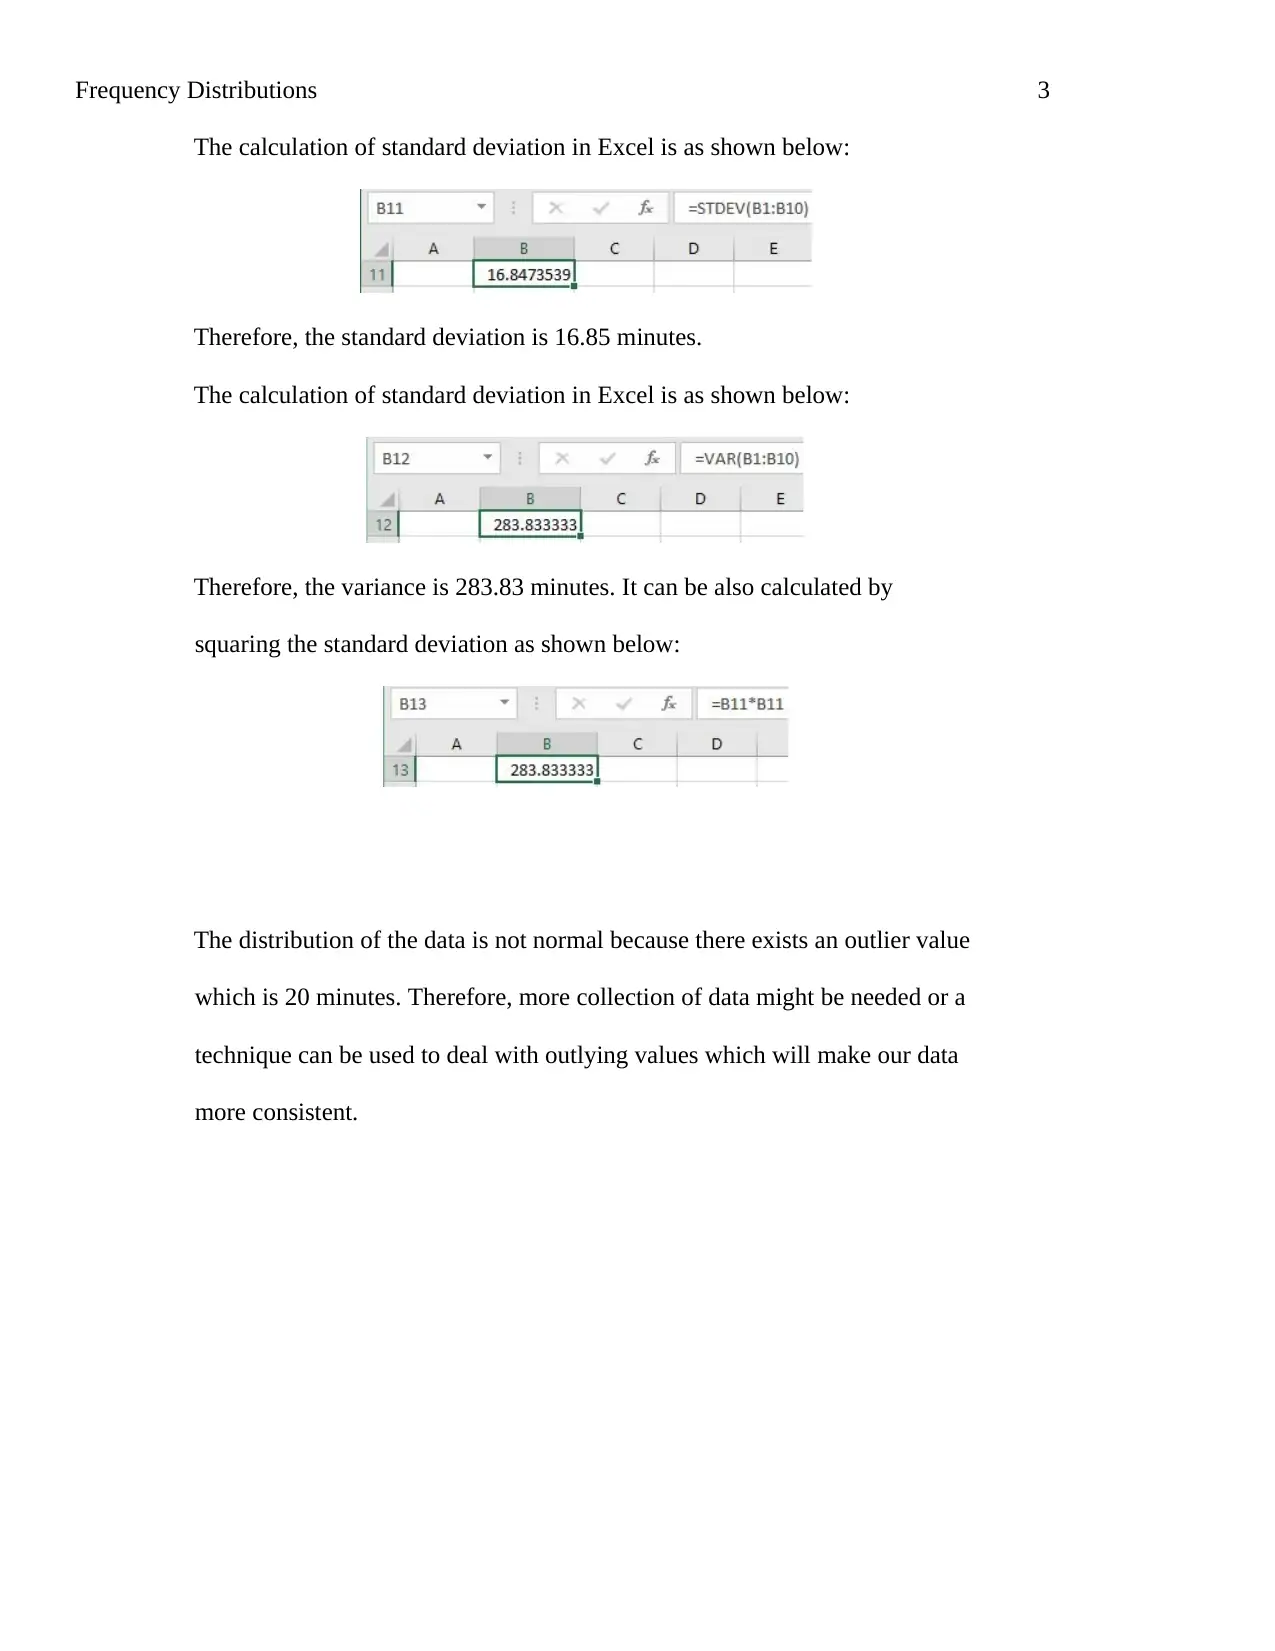
This assignment focuses on analyzing frequency distributions using a given dataset of television viewing times. The student calculates the standard deviation and variance of the data, demonstrating the use of Excel for these calculations. The assignment identifies an outlier in the data and discusses the implications of this outlier, suggesting further data collection or techniques to handle the outlier. The assignment concludes with a list of references including statistical textbooks and resources. The assignment provides a practical application of statistical concepts, highlighting the importance of data analysis and the identification of potential issues within a dataset.
Document Page
Frequency Distributions 1
Frequency Distributions
Laura Peña-Duval
MAT201 / Basic Statistic
May 17, 2017
Professor Qian Liu
tabler-icon-diamond-filled.svg

Paraphrase This Document

Need a fresh take? Get an instant paraphrase of this document with our AI Paraphraser
Document Page
Frequency Distributions 2
The data collected in first module are the values of time in minutes I spend watching
television is as shown below:
Day1 73 Minutes
Day2 80 Minutes
Day3 65 Minutes
Day4 20 Minutes
Day5 69 Minutes
Day6 75 Minutes
Day7 72 Minutes
Day8 73 Minutes
Day9 68 Minutes
Day1070 Minutes
Frequency distribution table of the above data:
Time Frequency
20 Minutes1
65 Minutes1
68 Minutes1
69 Minutes1
70 Minutes1
72 Minutes1
73 Minutes2
75 Minutes1
80 Minutes1
Document Page
Frequency Distributions 3
The calculation of standard deviation in Excel is as shown below:
Therefore, the standard deviation is 16.85 minutes.
The calculation of standard deviation in Excel is as shown below:
Therefore, the variance is 283.83 minutes. It can be also calculated by
squaring the standard deviation as shown below:
The distribution of the data is not normal because there exists an outlier value
which is 20 minutes. Therefore, more collection of data might be needed or a
technique can be used to deal with outlying values which will make our data
more consistent.
Document Page
Frequency Distributions 4
References
Bluman, Allan. G.(2009), Elementary Statistics. New York, NY:
McGraw-Hill
Mann, Prem S.(2012), Introductory Statistics. New Jersey, NJ:
John Wiley & Sons, Inc.
Rumsey, Deborah(2010), Statistics Essentials for Dummies. New
Jersey, NJ: John Wiley & Sons, Inc. Ross, Sheldon M.(2010), A
First Course in Probability, New Jersey, NJ: Pearson Prentice Hall
chevron_up_icon
1 out of 4
circle_padding
hide_on_mobile
zoom_out_icon
[object Object]