Statistics Assignment: Analyzing GDP and Sample Means Data

Verified

Added on  2020/05/03

|4
|475
|156
Homework Assignment
AI Summary
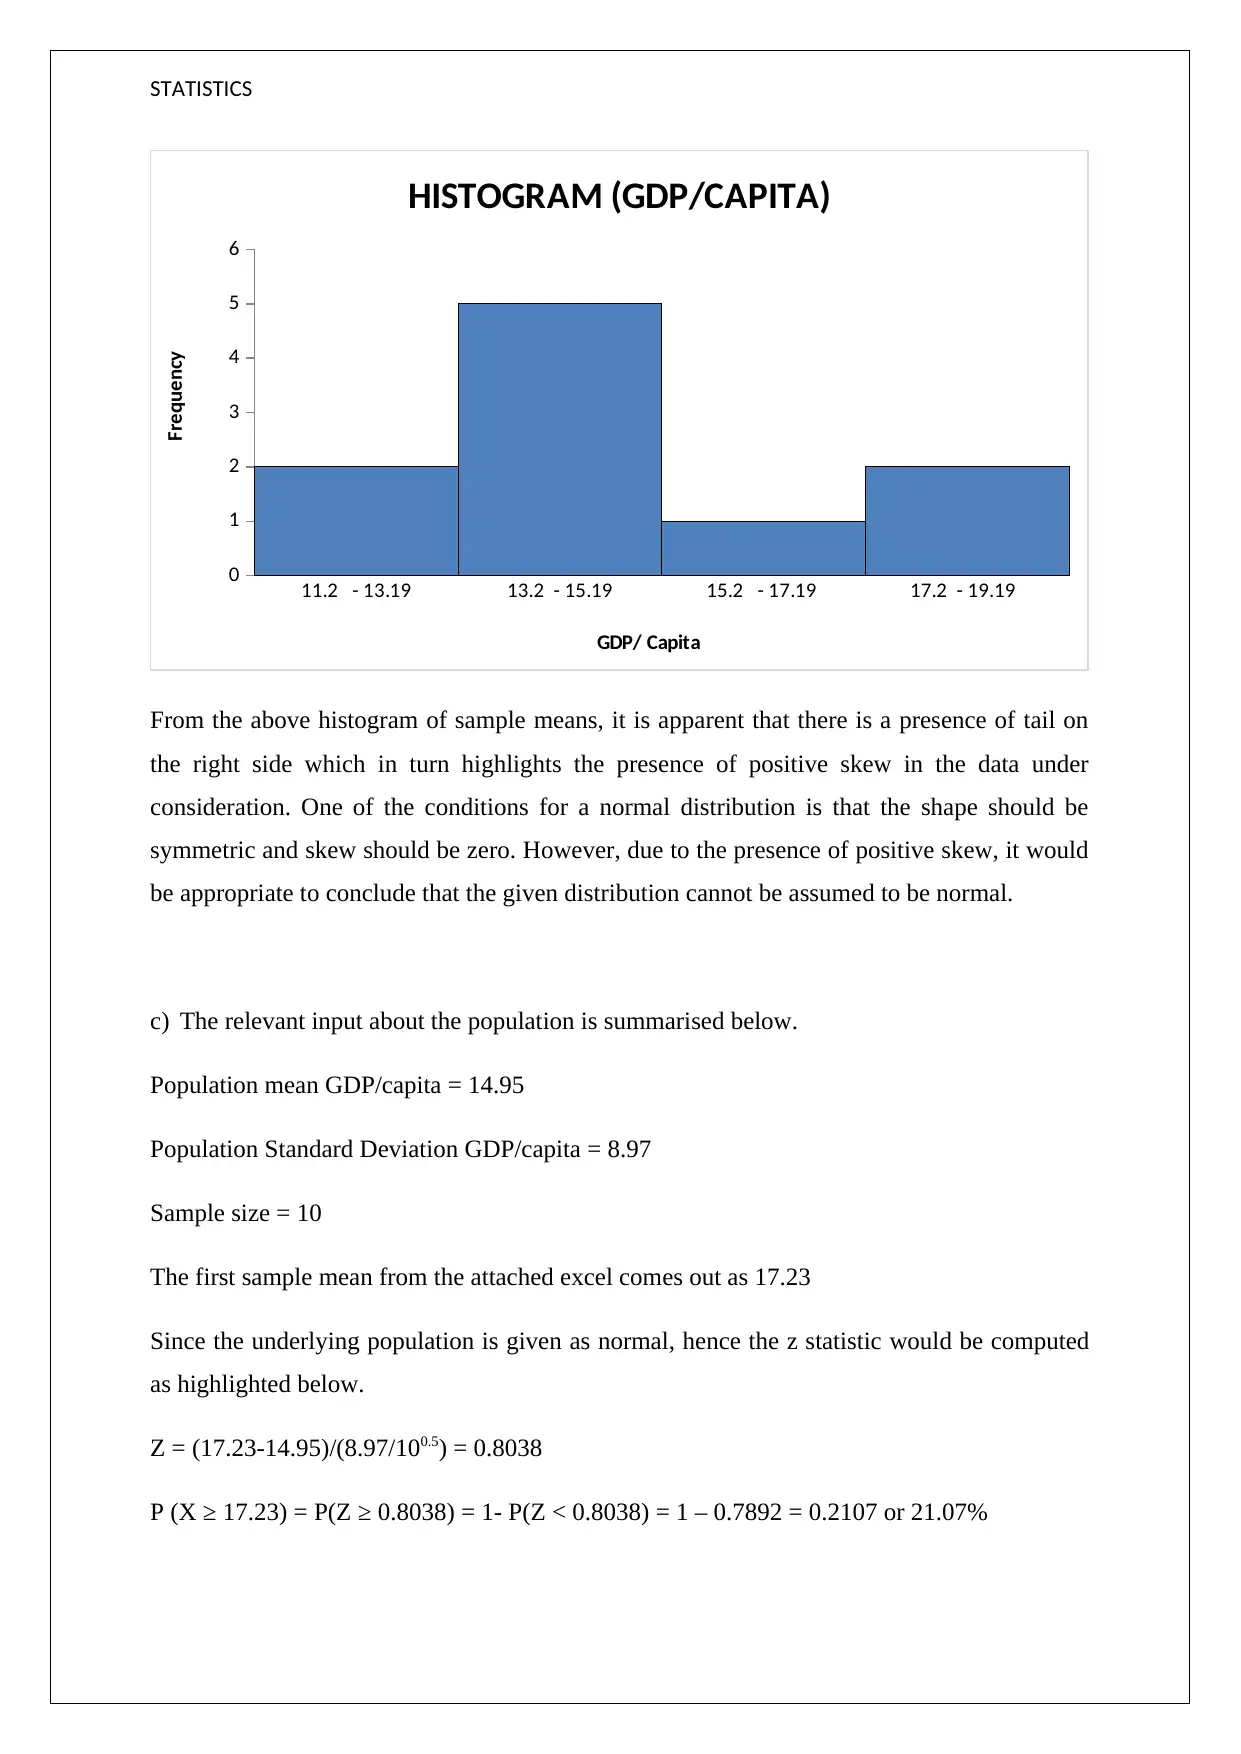
This statistics assignment analyzes GDP data, focusing on sample means, standard deviations, and the characteristics of the distribution. The assignment computes the sample mean, population mean, and population standard deviation. It also calculates the z-statistic to determine the probability of the population mean being at least equal to or greater than the sample mean. The solution highlights the presence of positive skew in the data, indicating that the distribution cannot be assumed to be normal. The assignment emphasizes statistical concepts like normal distribution, skewness, and probability calculations, providing a comprehensive analysis of the GDP data through various statistical measures and tests. The solution also includes a histogram of sample means to visualize the distribution of the data.
Document Page
STATISTICS
STUDENT ID:
[Pick the date]
tabler-icon-diamond-filled.svg

Paraphrase This Document

Need a fresh take? Get an instant paraphrase of this document with our AI Paraphraser
Document Page
STATISTICS
a) The various random samples have been selected and the GDP/capita has been computed.
Further, the mean of the 10 samples is as highlighted below.
SAMPLE MEAN
1 17.23
2 19.15
3 13.20
4 15.76
5 14.44
6 11.26
7 13.62
8 13.43
9 13.18
10 14.84
The standard deviation of the above 10 values has been computed as 2.27. Also, the
respective mean of the above 10 GDP/capita comes out as 14.61. The respective mean
GDP/capita and population standard deviation has been computed as 14.95 and 8.97. It is
apparent from the above values that while the sample mean is close to the population mean
but the same cannot be said about the standard deviation. The population data tends to
represent countries which are significantly different from each other which is why the
standard deviation is higher. However, for the sample considering the averaging effect on the
mean values, the standard deviation was bound to be low. This is because the standard
deviation has not been computed on absolute values of the countries but rather the average
values of sample of 10 values which tends to lower the overall dispersion through averaging
effect. Thus, if the raw data would have been taken for standard deviation computation of
sample, then it is possible that the results obtained would not be so different.
b) The requisite histogram for 10 sample means is indicated below.
Document Page
STATISTICS
11.2 - 13.19 13.2 - 15.19 15.2 - 17.19 17.2 - 19.19
0
1
2
3
4
5
6
HISTOGRAM (GDP/CAPITA)
GDP/ Capita
Frequency
From the above histogram of sample means, it is apparent that there is a presence of tail on
the right side which in turn highlights the presence of positive skew in the data under
consideration. One of the conditions for a normal distribution is that the shape should be
symmetric and skew should be zero. However, due to the presence of positive skew, it would
be appropriate to conclude that the given distribution cannot be assumed to be normal.
c) The relevant input about the population is summarised below.
Population mean GDP/capita = 14.95
Population Standard Deviation GDP/capita = 8.97
Sample size = 10
The first sample mean from the attached excel comes out as 17.23
Since the underlying population is given as normal, hence the z statistic would be computed
as highlighted below.
Z = (17.23-14.95)/(8.97/100.5) = 0.8038
P (X ≥ 17.23) = P(Z ≥ 0.8038) = 1- P(Z < 0.8038) = 1 – 0.7892 = 0.2107 or 21.07%
Document Page
STATISTICS
Thus, for the population mean to be atleast equal to or greater than the sample mean of 17.23,
the theoretical probability is 21.07% or 0.2107 as computed above.
chevron_up_icon
1 out of 4
circle_padding
hide_on_mobile
zoom_out_icon
[object Object]