BUS708: Gender Inequality and Wage Analysis Report - Statistics
VerifiedAdded on 2021/05/31
|8
|1242
|500
Report
AI Summary
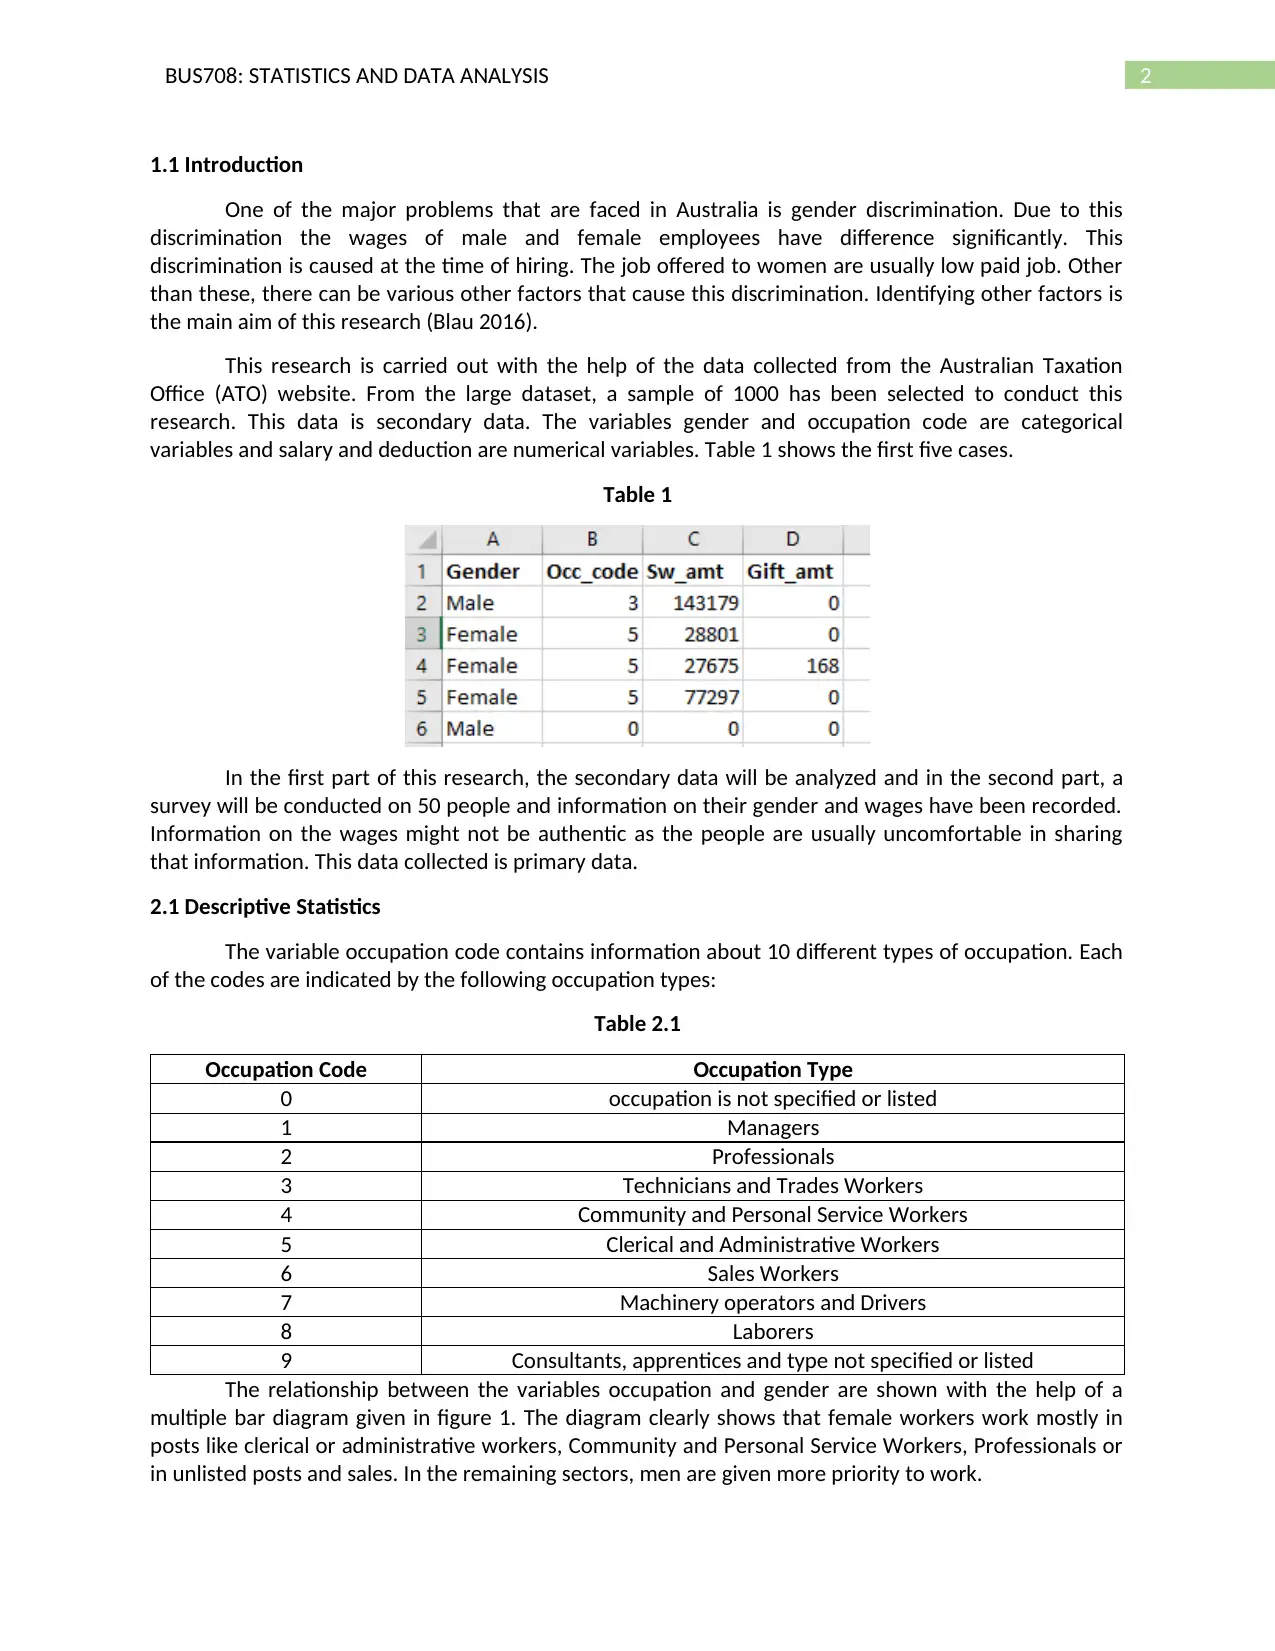
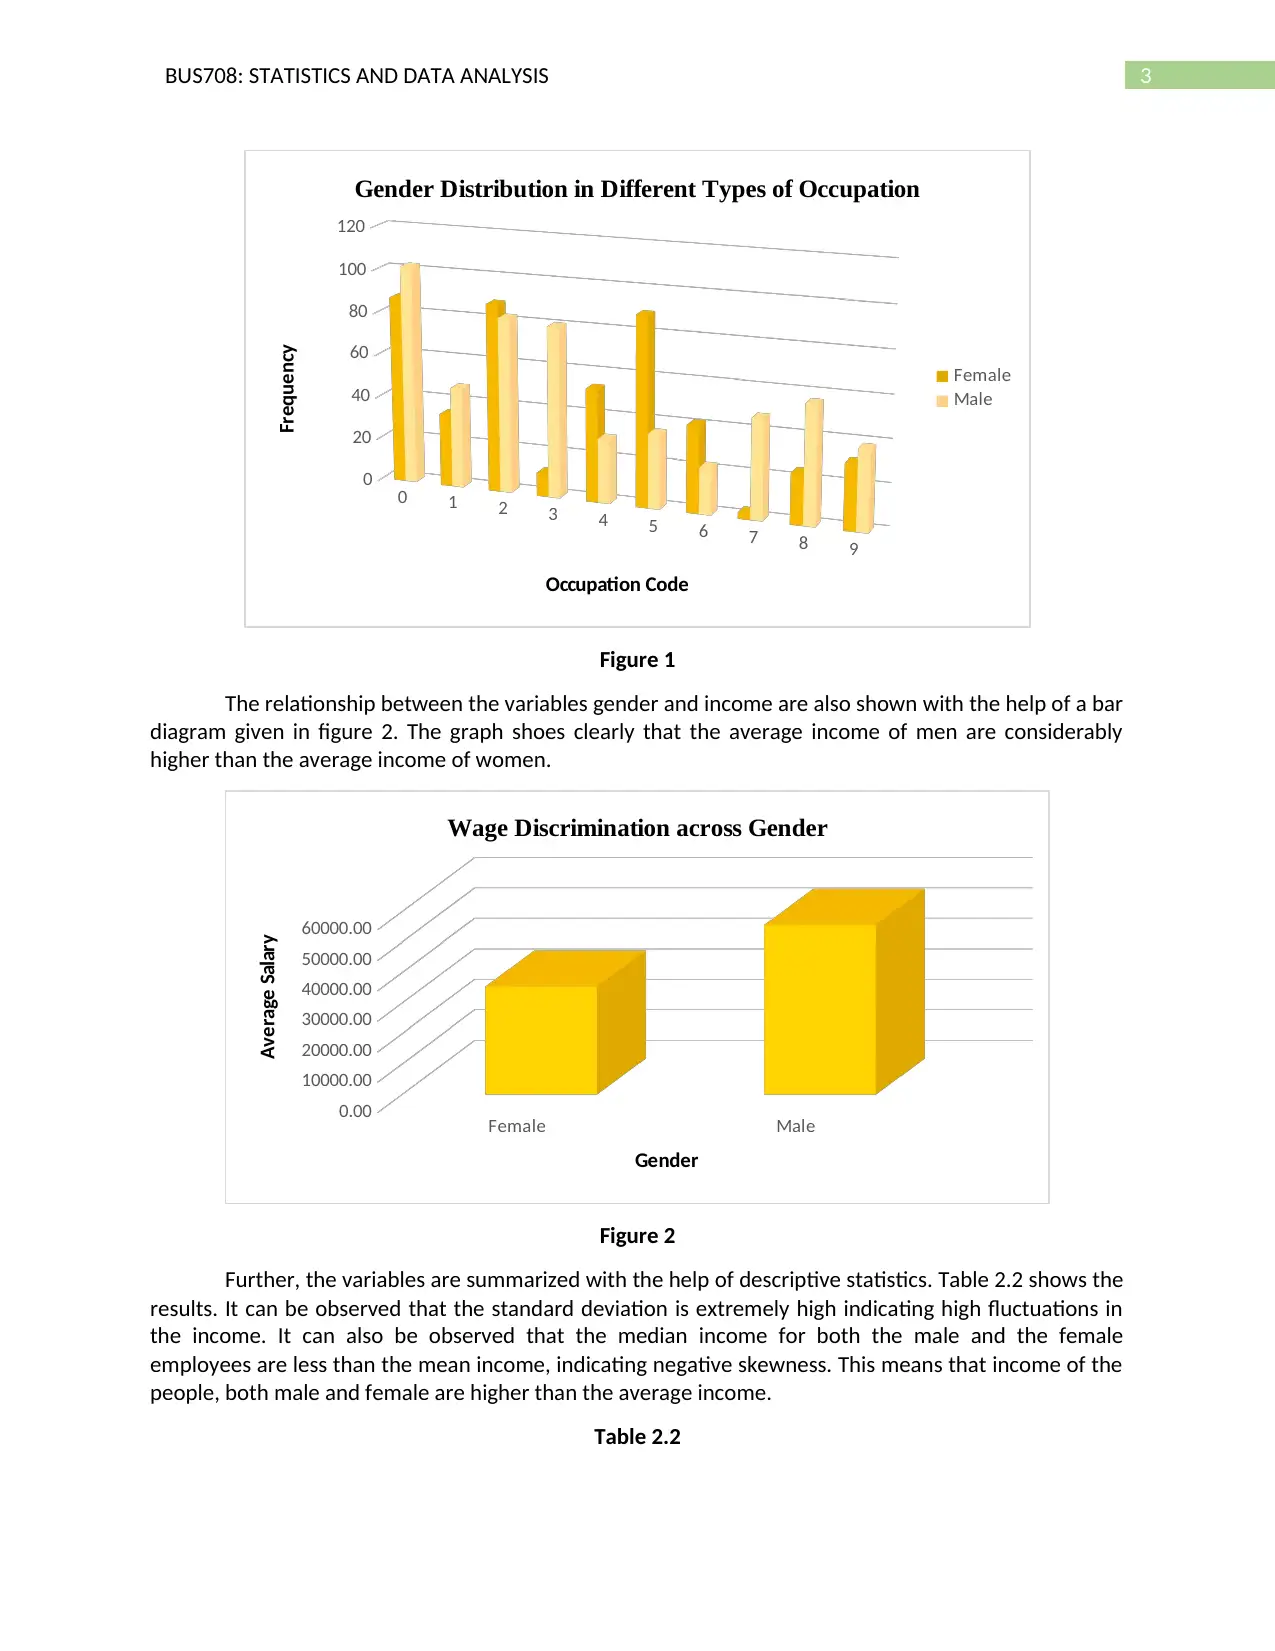
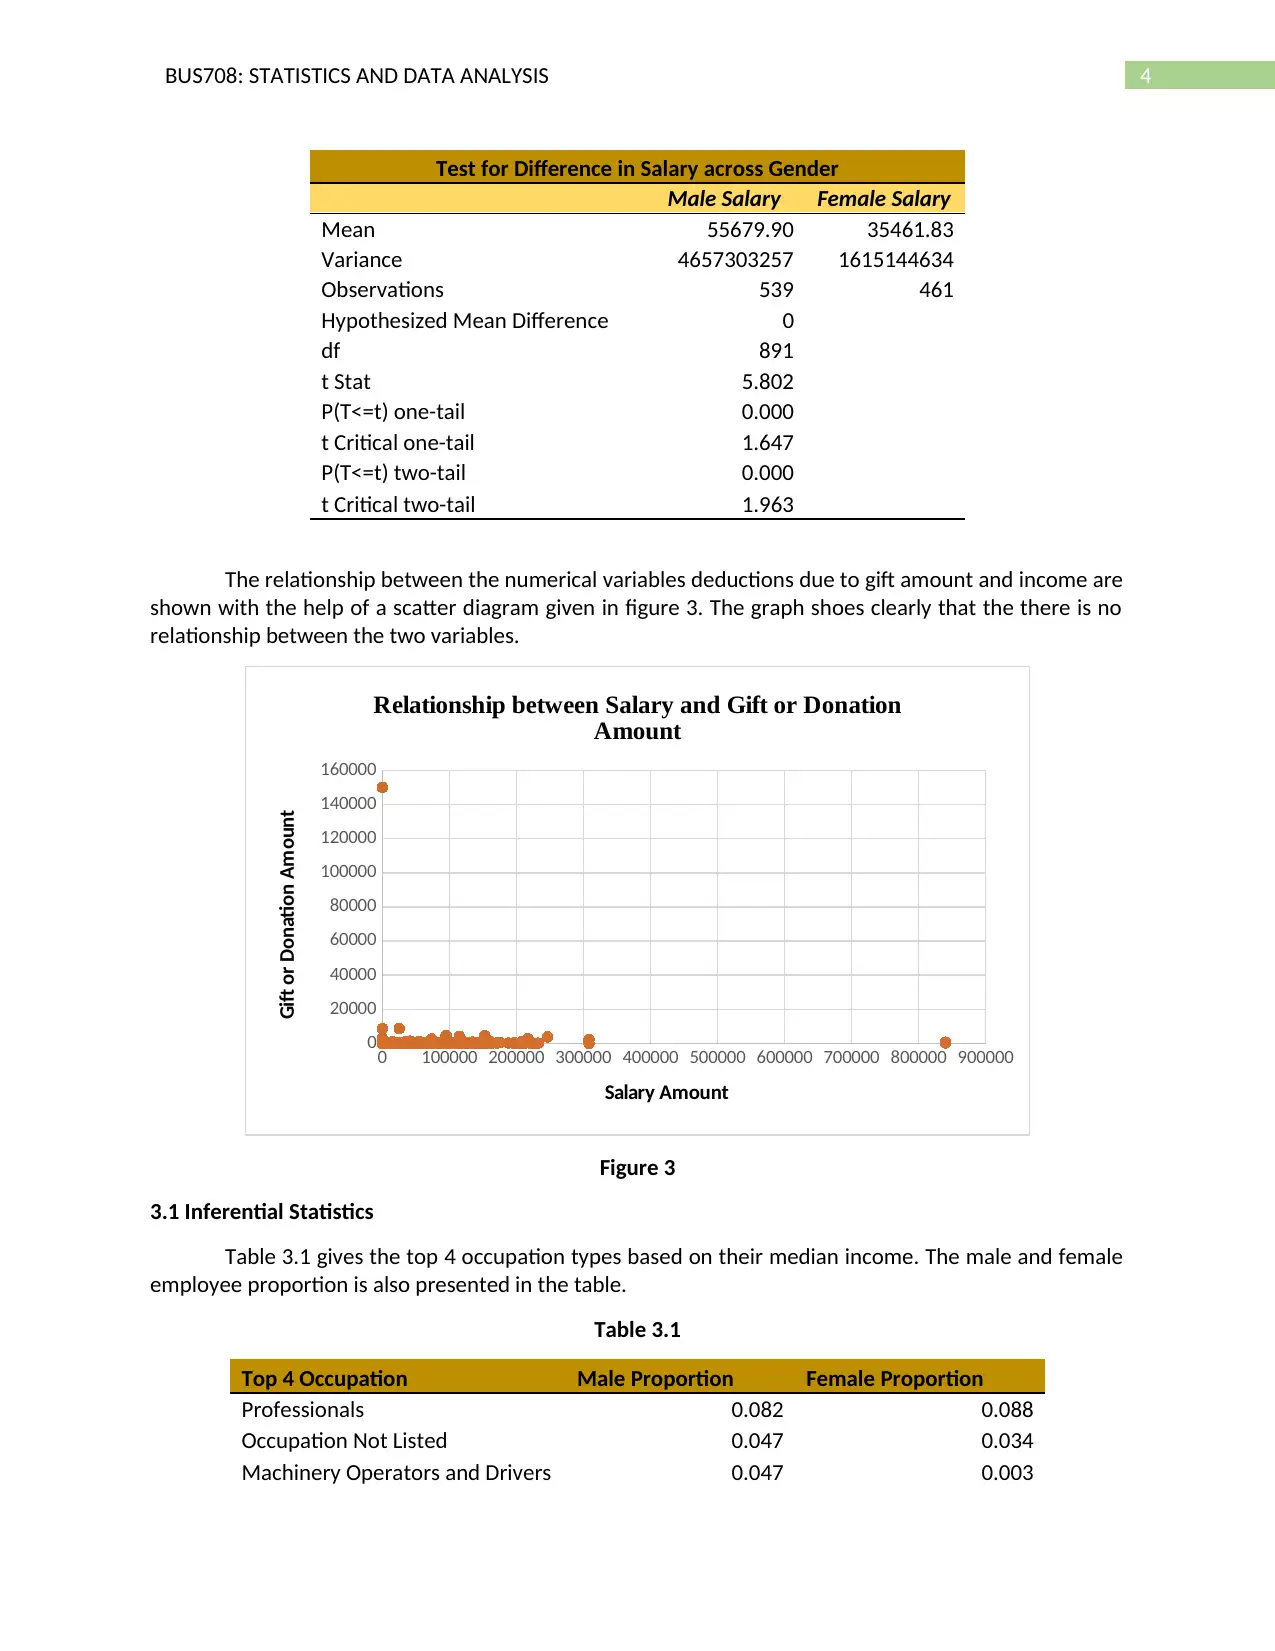
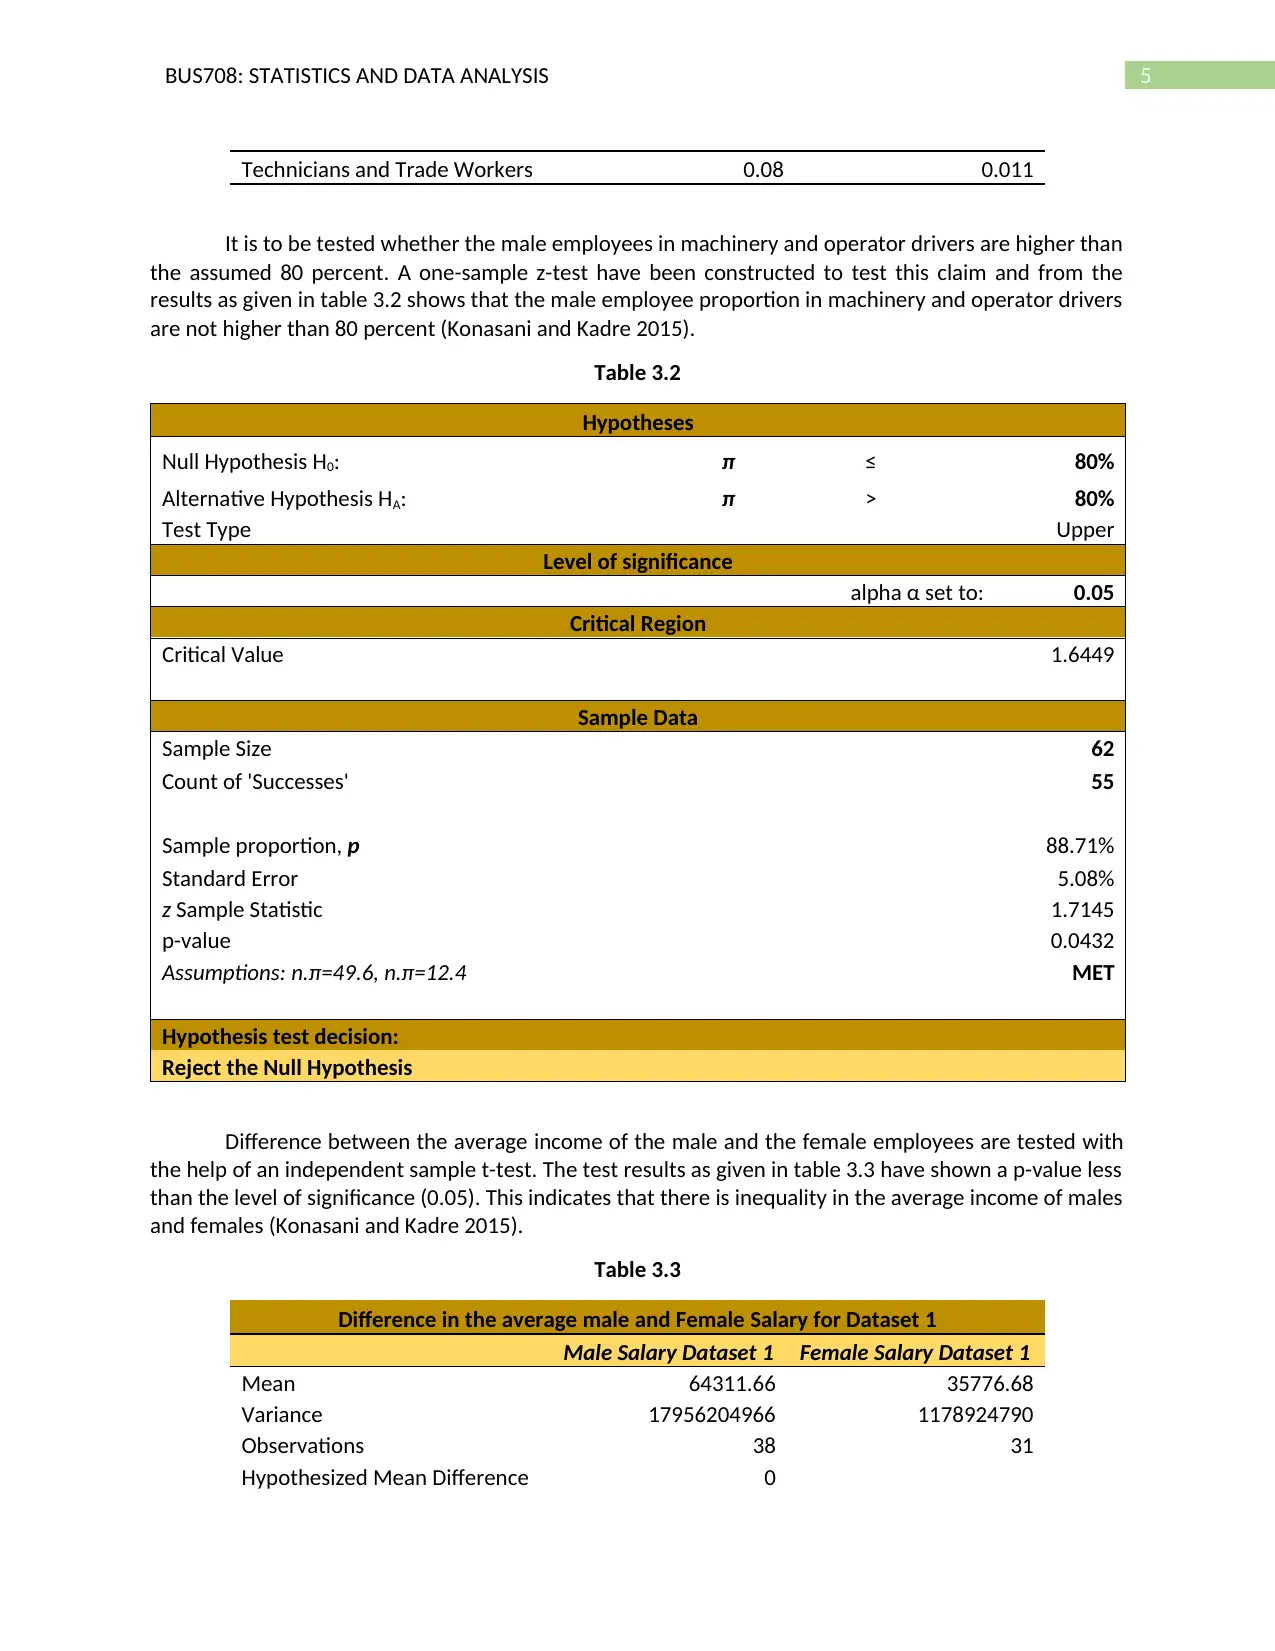
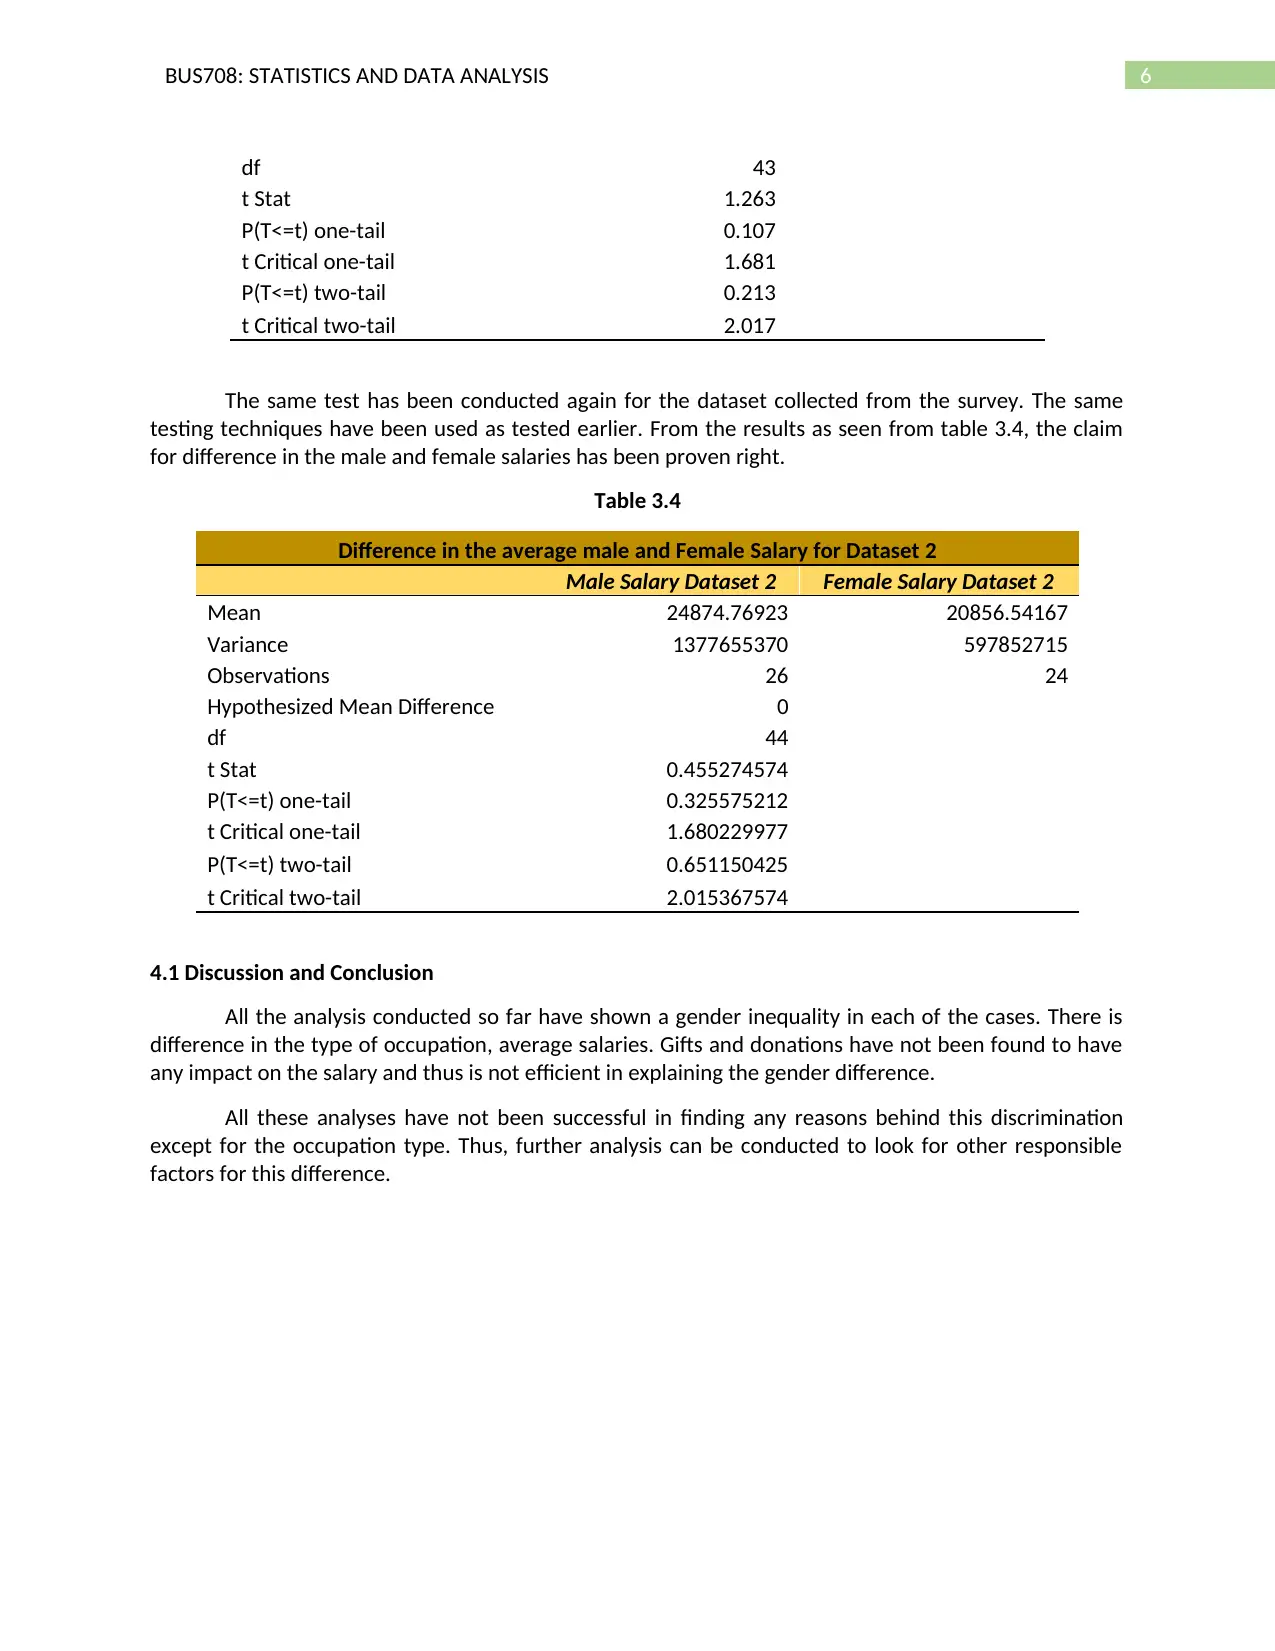
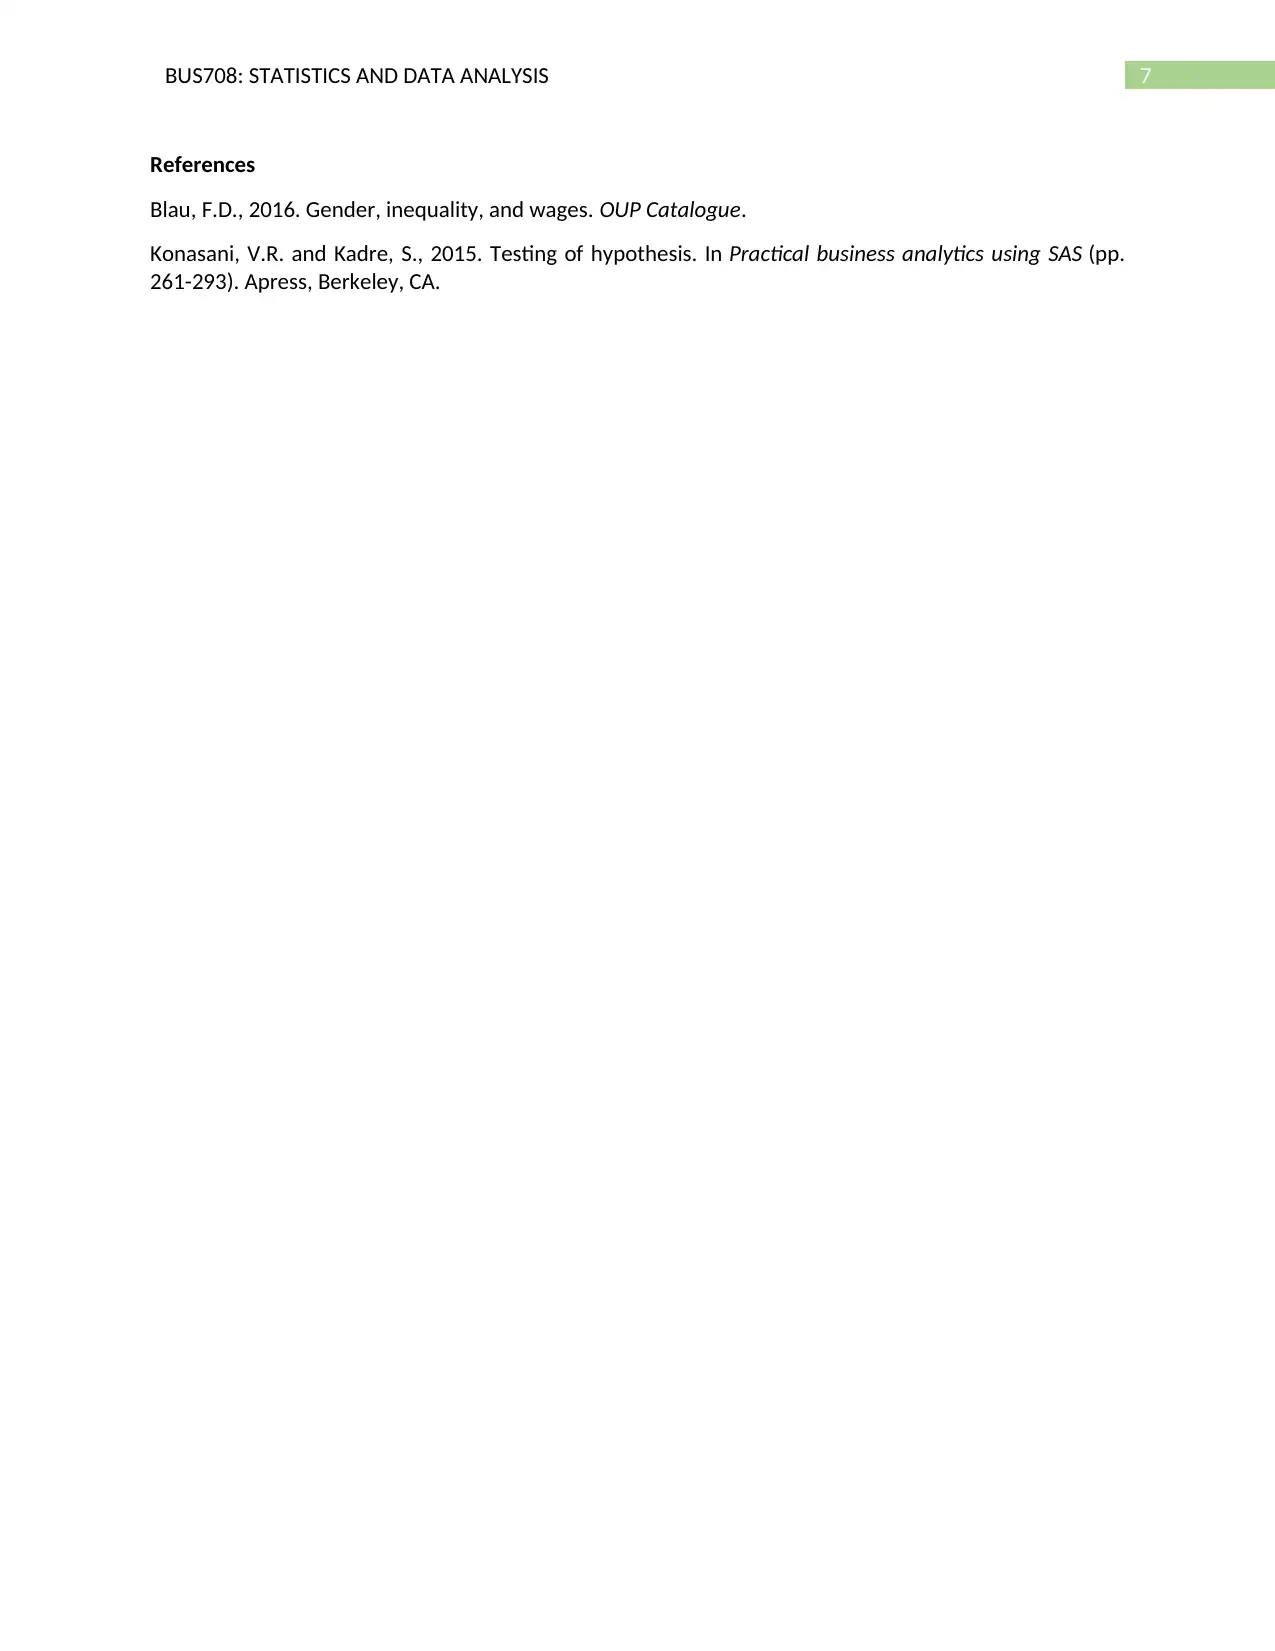
This report presents a statistical analysis of gender-based wage inequality in Australia, utilizing data from the Australian Taxation Office. The study employs descriptive statistics, including mean, variance, and standard deviation, to highlight salary differences between genders across various occupation types. Inferential statistics, such as independent sample t-tests and one-sample z-tests, are used to compare average incomes and test hypotheses regarding male employee proportions. The analysis reveals significant disparities in wages and occupation distribution, indicating gender discrimination. The report also examines the relationship between income and deductions due to gifts, finding no significant correlation. The findings underscore the persistence of gender inequality in the workplace and suggest the need for further investigation into the underlying causes of wage disparities.

Running Head: BUS708 – STATISTICS AND DATA ANALYSIS
BUS708
Statistics and Data Analysis
Name of the Student
Name of the University
Student ID
BUS708
Statistics and Data Analysis
Name of the Student
Name of the University
Student ID
Paraphrase This Document
Need a fresh take? Get an instant paraphrase of this document with our AI Paraphraser

1BUS708: STATISTICS AND DATA ANALYSIS
Table of Contents
1.1 Introduction...........................................................................................................................................2
2.1 Descriptive Statistics..............................................................................................................................2
3.1 Inferential Statistics...............................................................................................................................4
4.1 Discussion and Conclusion.....................................................................................................................6
References...................................................................................................................................................7

2BUS708: STATISTICS AND DATA ANALYSIS
1.1 Introduction
One of the major problems that are faced in Australia is gender discrimination. Due to this
discrimination the wages of male and female employees have difference significantly. This
discrimination is caused at the time of hiring. The job offered to women are usually low paid job. Other
than these, there can be various other factors that cause this discrimination. Identifying other factors is
the main aim of this research (Blau 2016).
This research is carried out with the help of the data collected from the Australian Taxation
Office (ATO) website. From the large dataset, a sample of 1000 has been selected to conduct this
research. This data is secondary data. The variables gender and occupation code are categorical
variables and salary and deduction are numerical variables. Table 1 shows the first five cases.
Table 1
In the first part of this research, the secondary data will be analyzed and in the second part, a
survey will be conducted on 50 people and information on their gender and wages have been recorded.
Information on the wages might not be authentic as the people are usually uncomfortable in sharing
that information. This data collected is primary data.
2.1 Descriptive Statistics
The variable occupation code contains information about 10 different types of occupation. Each
of the codes are indicated by the following occupation types:
Table 2.1
Occupation Code Occupation Type
0 occupation is not specified or listed
1 Managers
2 Professionals
3 Technicians and Trades Workers
4 Community and Personal Service Workers
5 Clerical and Administrative Workers
6 Sales Workers
7 Machinery operators and Drivers
8
⊘ This is a preview!⊘
Do you want full access?
Subscribe today to unlock all pages.

Trusted by 1+ million students worldwide

3BUS708: STATISTICS AND DATA ANALYSIS
0 1 2 3 4 5 6 7 8 9
0
20
40
60
80
100
120
Gender Distribution in Different Types of Occupation
Female
Male
Occupation Code
Frequency
Figure 1
The relationship between the variables gender and income are also shown with the help of a bar
diagram given in figure 2. The graph shoes clearly that the average income of men are considerably
higher than the average income of women.
Female Male
0.00
10000.00
20000.00
30000.00
40000.00
50000.00
60000.00
Wage Discrimination across Gender
Gender
Average Salary
Figure 2
Further, the variables are summarized with the help of descriptive statistics. Table 2.2 shows the
results. It can be observed that the standard deviation is extremely high indicating high fluctuations in
the income. It can also be observed that the median income for both the male and the female
employees are less than the mean income, indicating negative skewness. This means that income of the
people, both male and female are higher than the average income.
Table 2.2
Paraphrase This Document
Need a fresh take? Get an instant paraphrase of this document with our AI Paraphraser

4BUS708: STATISTICS AND DATA ANALYSIS
Test for Difference in Salary across Gender
Male Salary Female Salary
Mean 55679.90 35461.83
Variance 4657303257 1615144634
Observations 539 461
Hypothesized Mean Difference 0
df 891
t Stat 5.802
P(T<=t) one-tail 0.000
t Critical one-tail 1.647
P(T<=t) two-tail 0.000
t Critical two-tail
Test for Difference in Salary across Gender
Male Salary Female Salary
Mean 55679.90 35461.83
Variance 4657303257 1615144634
Observations 539 461
Hypothesized Mean Difference 0
df 891
t Stat 5.802
P(T<=t) one-tail 0.000
t Critical one-tail 1.647
P(T<=t) two-tail 0.000
t Critical two-tail

5BUS708: STATISTICS AND DATA ANALYSIS
Technicians and Trade Workers 0.08 0.011
It is to be tested whether the male employees in machinery and operator drivers are higher than
the assumed 80 percent. A one-sample z-test have been constructed to test this claim and from the
results as given in table 3.2 shows that the male employee proportion in machinery and operator drivers
are not higher than 80 percent (Konasani and Kadre 2015).
Table 3.2
Hypotheses
Null Hypothesis H0: π ≤ 80%
Alternative Hypothesis HA: π > 80%
Test Type Upper
Level of significance
alpha α set to: 0.05
Critical Region
Critical Value 1.6449
Sample Data
Sample Size 62
Count of 'Successes' 55
Sample proportion, p 88.71%
Standard Error 5.08%
z Sample Statistic 1.7145
p-value 0.0432
Assumptions: n.π=49.6, n.π=12.4 MET
Hypothesis test decision:
Reject the Null Hypothesis
Difference between the average income of the male and the female employees are tested with
the help of an independent sample t-test. The test results as given in table 3.3 have shown a p-value less
than the level of significance (0.05). This indicates that there is inequality in the average income of males
and females (Konasani and Kadre 2015).
Table 3.3
Difference in the average male and Female Salary for Dataset 1
Male Salary Dataset 1 Female Salary Dataset 1
Mean 64311.66 35776.68
Variance 17956204966 1178924790
Observations 38 31
Hypothesized Mean Difference 0
⊘ This is a preview!⊘
Do you want full access?
Subscribe today to unlock all pages.

Trusted by 1+ million students worldwide

6BUS708: STATISTICS AND DATA ANALYSIS
df 43
t Stat 1.263
P(T<=t) one-tail 0.107
t Critical one-tail 1.681
P(T<=t) two-tail 0.213
t Critical two-tail 2.017
The same test has been conducted again for the dataset collected from the survey. The same
testing techniques have been used as tested earlier. From the results as seen from table 3.4, the claim
for difference in the male and female salaries has been proven right.
Table 3.4
Difference in the average male and Female Salary for Dataset 2
Male Salary Dataset 2 Female Salary Dataset 2
Mean 24874.76923 20856.54167
Variance 1377655370 597852715
Observations 26 24
Hypothesized Mean Difference 0
df 44
t Stat 0.455274574
P(T<=t) one-tail 0.325575212
t Critical one-tail 1.680229977
P(T<=t) two-tail 0.651150425
t Critical two-tail 2.015367574
4.1 Discussion and Conclusion
All the analysis conducted so far have shown a gender inequality in each of the cases. There is
difference in the type of occupation, average salaries. Gifts and donations have not been found to have
any impact on the salary and thus is not efficient in explaining the gender difference.
All these analyses have not been successful in finding any reasons behind this discrimination
except for the occupation type. Thus, further analysis can be conducted to look for other responsible
factors for this difference.
Paraphrase This Document
Need a fresh take? Get an instant paraphrase of this document with our AI Paraphraser

7BUS708: STATISTICS AND DATA ANALYSIS
References
Blau, F.D., 2016. Gender, inequality, and wages. OUP Catalogue.
Konasani, V.R. and Kadre, S., 2015. Testing of hypothesis. In Practical business analytics using SAS (pp.
261-293). Apress, Berkeley, CA.
References
Blau, F.D., 2016. Gender, inequality, and wages. OUP Catalogue.
Konasani, V.R. and Kadre, S., 2015. Testing of hypothesis. In Practical business analytics using SAS (pp.
261-293). Apress, Berkeley, CA.
1 out of 8
Related Documents

Your All-in-One AI-Powered Toolkit for Academic Success.
+13062052269
info@desklib.com
Available 24*7 on WhatsApp / Email
Unlock your academic potential
Copyright © 2020–2025 A2Z Services. All Rights Reserved. Developed and managed by ZUCOL.