Statistics Homework: GPA Distribution, Hypothesis Testing, Confidence

Verified

Added on  2023/04/22

|4
|638
|143
Homework Assignment
AI Summary
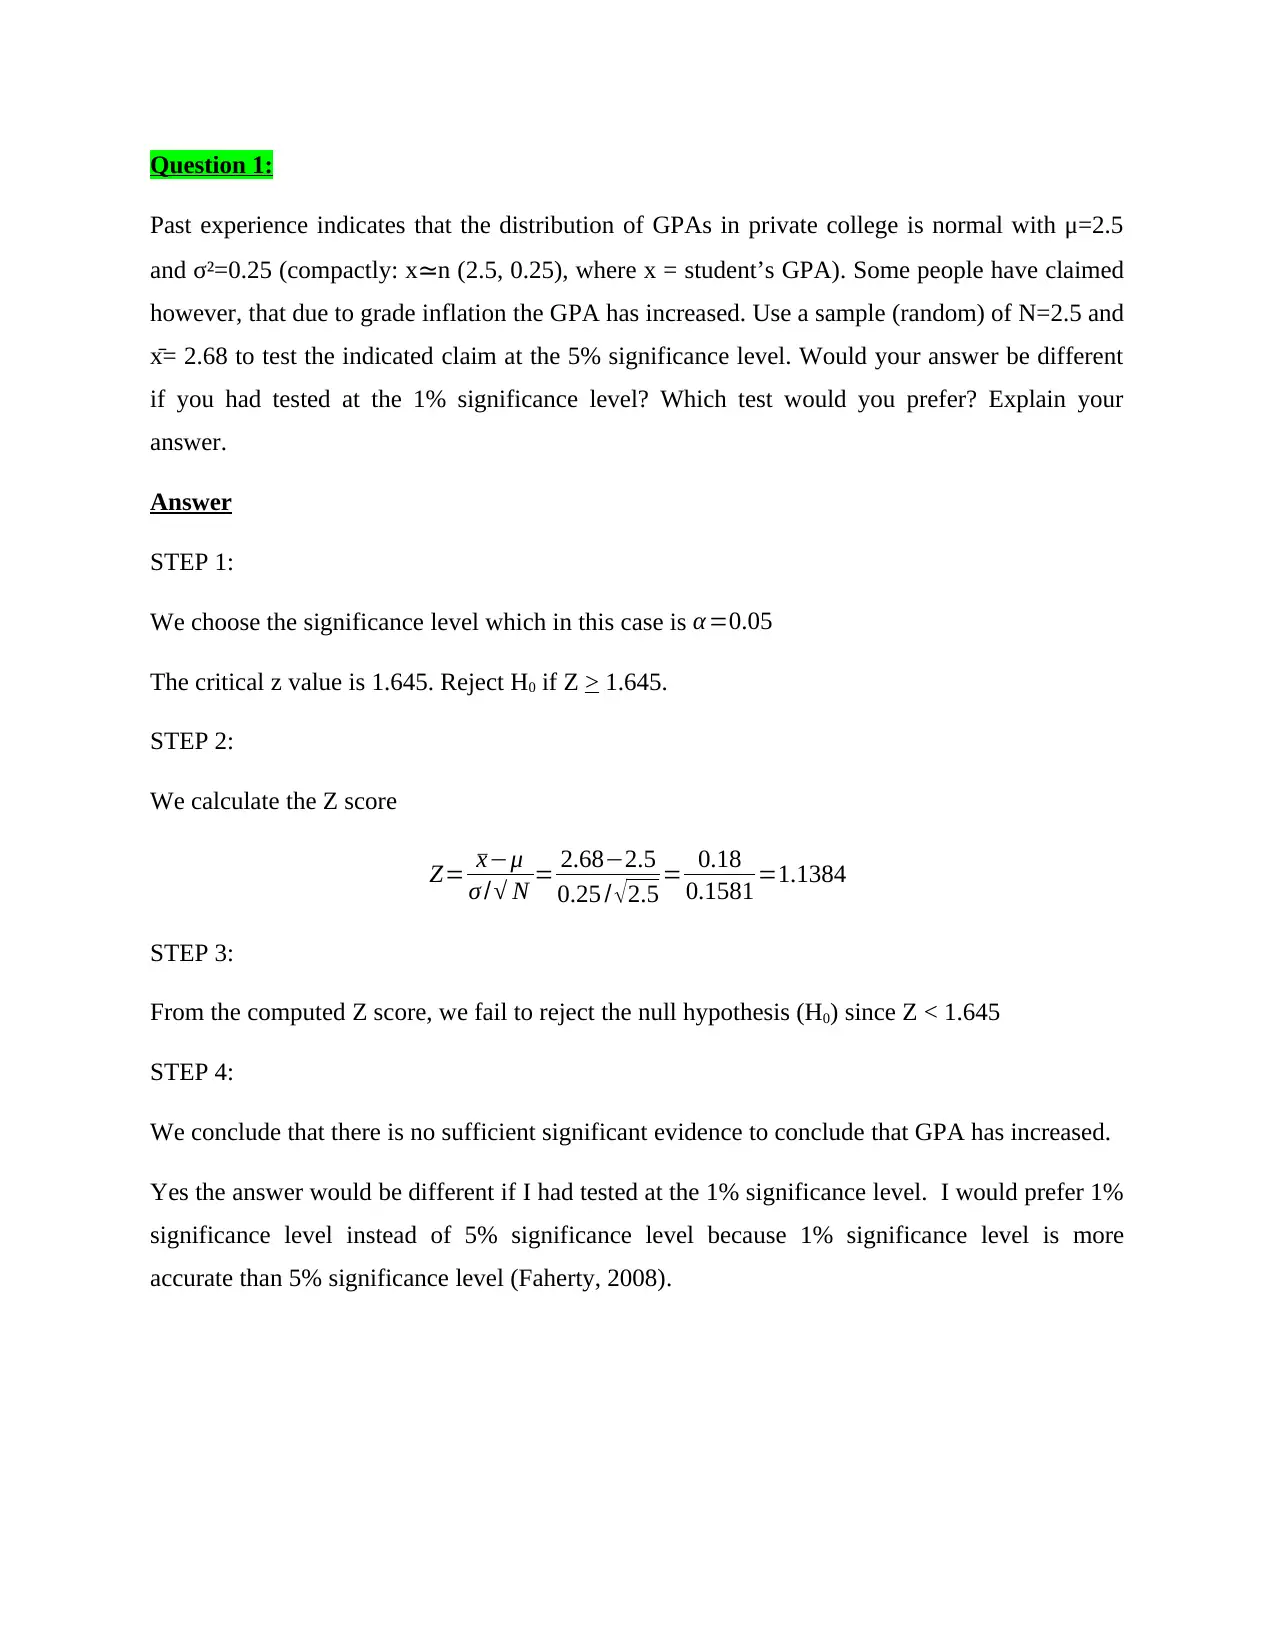
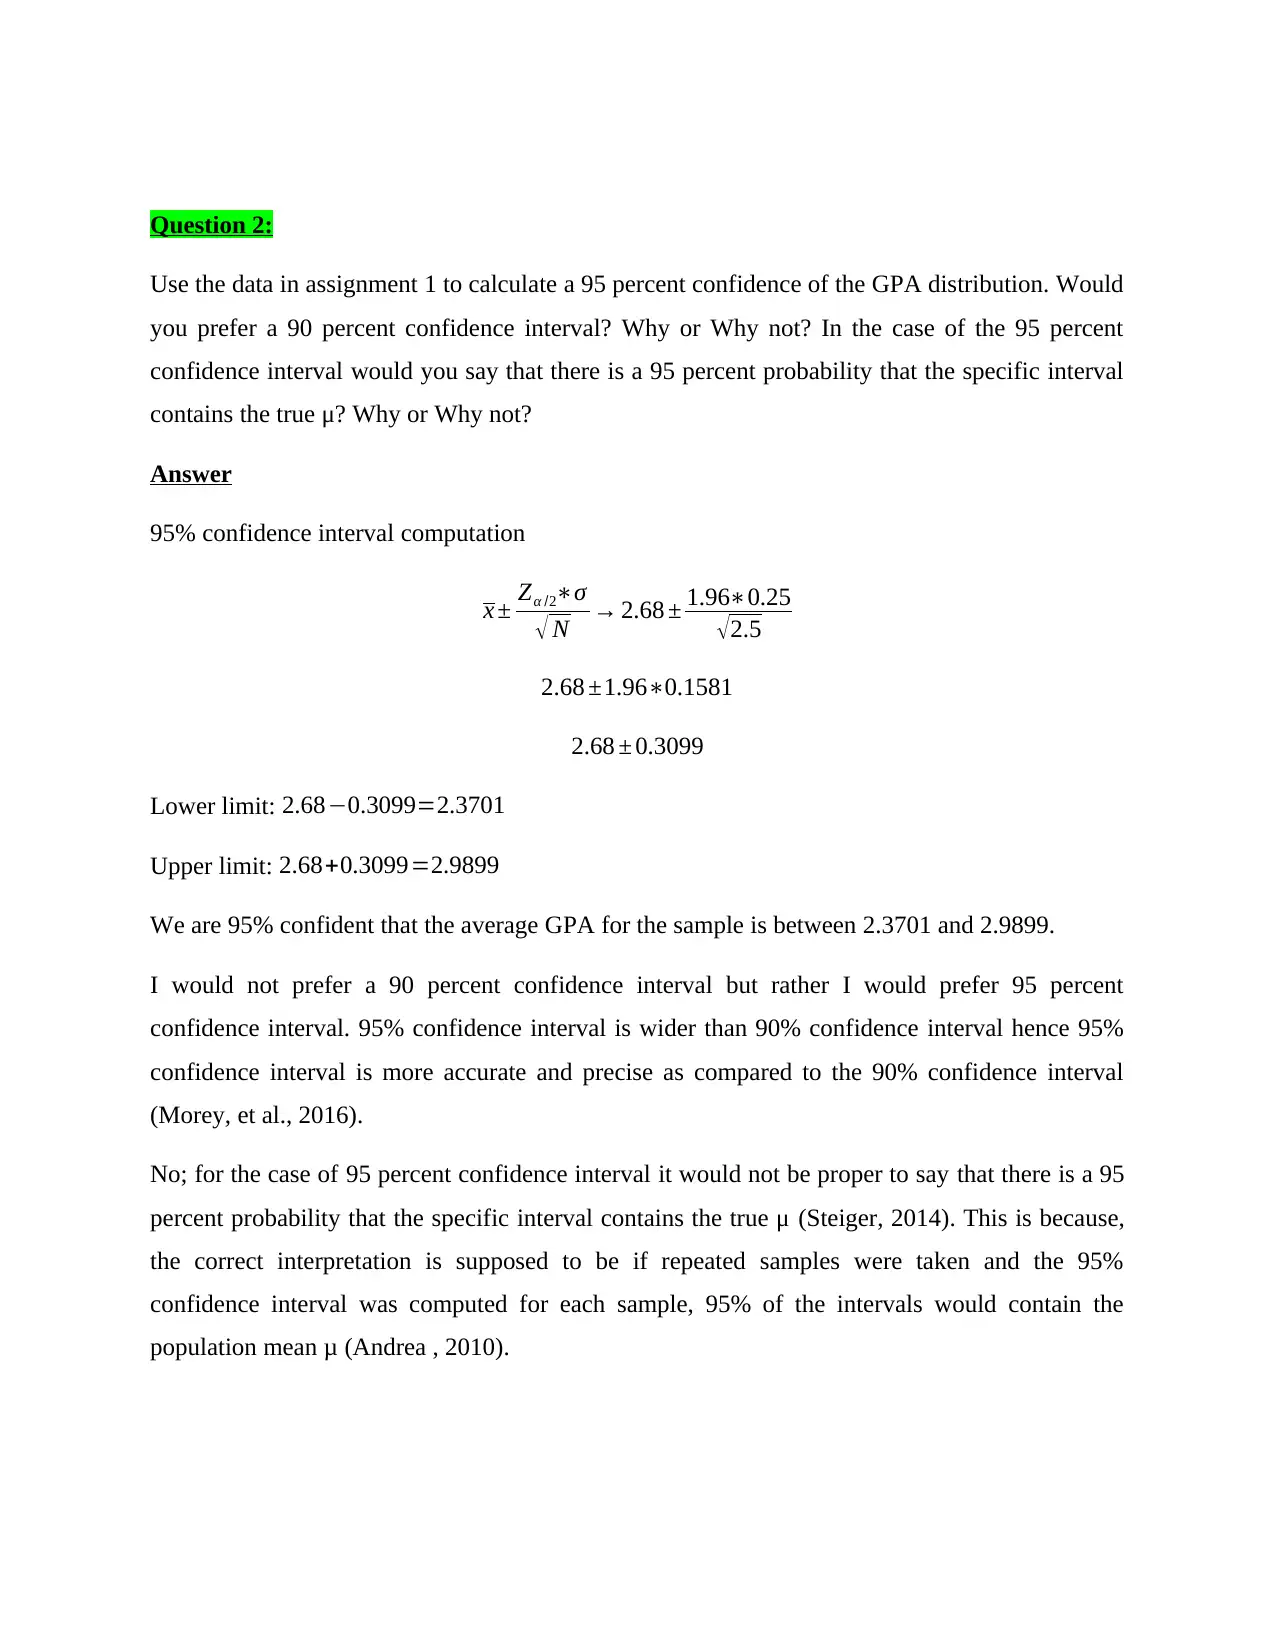
This statistics assignment delves into hypothesis testing and confidence interval calculations related to GPA distribution in a private college. The first question examines whether the GPA has increased due to grade inflation, using a significance level of 5% and 1%. The conclusion is that there isn't sufficient evidence to support the claim at the 5% level. The assignment further explains why a 1% significance level might be preferred for its increased accuracy. The second question involves calculating a 95% confidence interval for the GPA distribution and justifies the preference for a 95% interval over a 90% interval due to its wider range and greater accuracy. The assignment clarifies that the 95% confidence interval does not imply a 95% probability of containing the true mean, but rather that 95% of intervals from repeated samples would contain the population mean. Desklib provides students access to similar solved assignments and resources for enhanced learning.
tabler-icon-diamond-filled.svg

Contribute Materials

Your contribution can guide someone’s learning journey. Share your documents today.
Document Page
Statistics
Name:
Institution:
21st February 2019
tabler-icon-diamond-filled.svg

Secure Best Marks with AI Grader

Need help grading? Try our AI Grader for instant feedback on your assignments.
Document Page
Question 1:
Past experience indicates that the distribution of GPAs in private college is normal with μ=2.5
and σ²=0.25 (compactly: xn (2.5, 0.25), where x = student’s GPA). Some people have claimed
however, that due to grade inflation the GPA has increased. Use a sample (random) of N=2.5 and
x̄= 2.68 to test the indicated claim at the 5% significance level. Would your answer be different
if you had tested at the 1% significance level? Which test would you prefer? Explain your
answer.
Answer
STEP 1:
We choose the significance level which in this case is α =0.05
The critical z value is 1.645. Reject H0 if Z > 1.645.
STEP 2:
We calculate the Z score
Z= ¯xμ
σ / N = 2.682.5
0.25 / 2.5 = 0.18
0.1581 =1.1384
STEP 3:
From the computed Z score, we fail to reject the null hypothesis (H0) since Z < 1.645
STEP 4:
We conclude that there is no sufficient significant evidence to conclude that GPA has increased.
Yes the answer would be different if I had tested at the 1% significance level. I would prefer 1%
significance level instead of 5% significance level because 1% significance level is more
accurate than 5% significance level (Faherty, 2008).
Document Page
Question 2:
Use the data in assignment 1 to calculate a 95 percent confidence of the GPA distribution. Would
you prefer a 90 percent confidence interval? Why or Why not? In the case of the 95 percent
confidence interval would you say that there is a 95 percent probability that the specific interval
contains the true μ? Why or Why not?
Answer
95% confidence interval computation
x ± Zα /2σ
N 2.68 ± 1.960.25
2.5
2.68 ±1.960.1581
2.68 ± 0.3099
Lower limit: 2.680.3099=2.3701
Upper limit: 2.68+0.3099=2.9899
We are 95% confident that the average GPA for the sample is between 2.3701 and 2.9899.
I would not prefer a 90 percent confidence interval but rather I would prefer 95 percent
confidence interval. 95% confidence interval is wider than 90% confidence interval hence 95%
confidence interval is more accurate and precise as compared to the 90% confidence interval
(Morey, et al., 2016).
No; for the case of 95 percent confidence interval it would not be proper to say that there is a 95
percent probability that the specific interval contains the true μ (Steiger, 2014). This is because,
the correct interpretation is supposed to be if repeated samples were taken and the 95%
confidence interval was computed for each sample, 95% of the intervals would contain the
population mean μ (Andrea , 2010).
Document Page
References
Andrea , K., 2010. Overlapping Confidence Intervals and Statistical Significance. Cornell
Statistical Consulting Unit, 5(2), pp. 45-61.
Faherty, V., 2008. Probability and statistical significance. Applied Quantitative Analysis for
Social Services, 12(5), p. 127–138.
Morey, R. D. et al., 2016. The fallacy of placing confidence in confidence intervals.
Psychonomic Bulletin & Review, 23(1), p. 103–123.
Steiger, J. H., 2014. Beyond the F test: Effect size confidence intervals and tests of close fit in
the analysis of variance and contrast analysis. Psychological Methods, 9(2), p. 164–182.
chevron_up_icon
1 out of 4
circle_padding
hide_on_mobile
zoom_out_icon
logo.png

Your All-in-One AI-Powered Toolkit for Academic Success.

Available 24*7 on WhatsApp / Email

[object Object]