MATH1031 Business Statistics: Analyzing Gross Value Added Report
VerifiedAdded on 2023/06/10
|9
|909
|252
Report
AI Summary
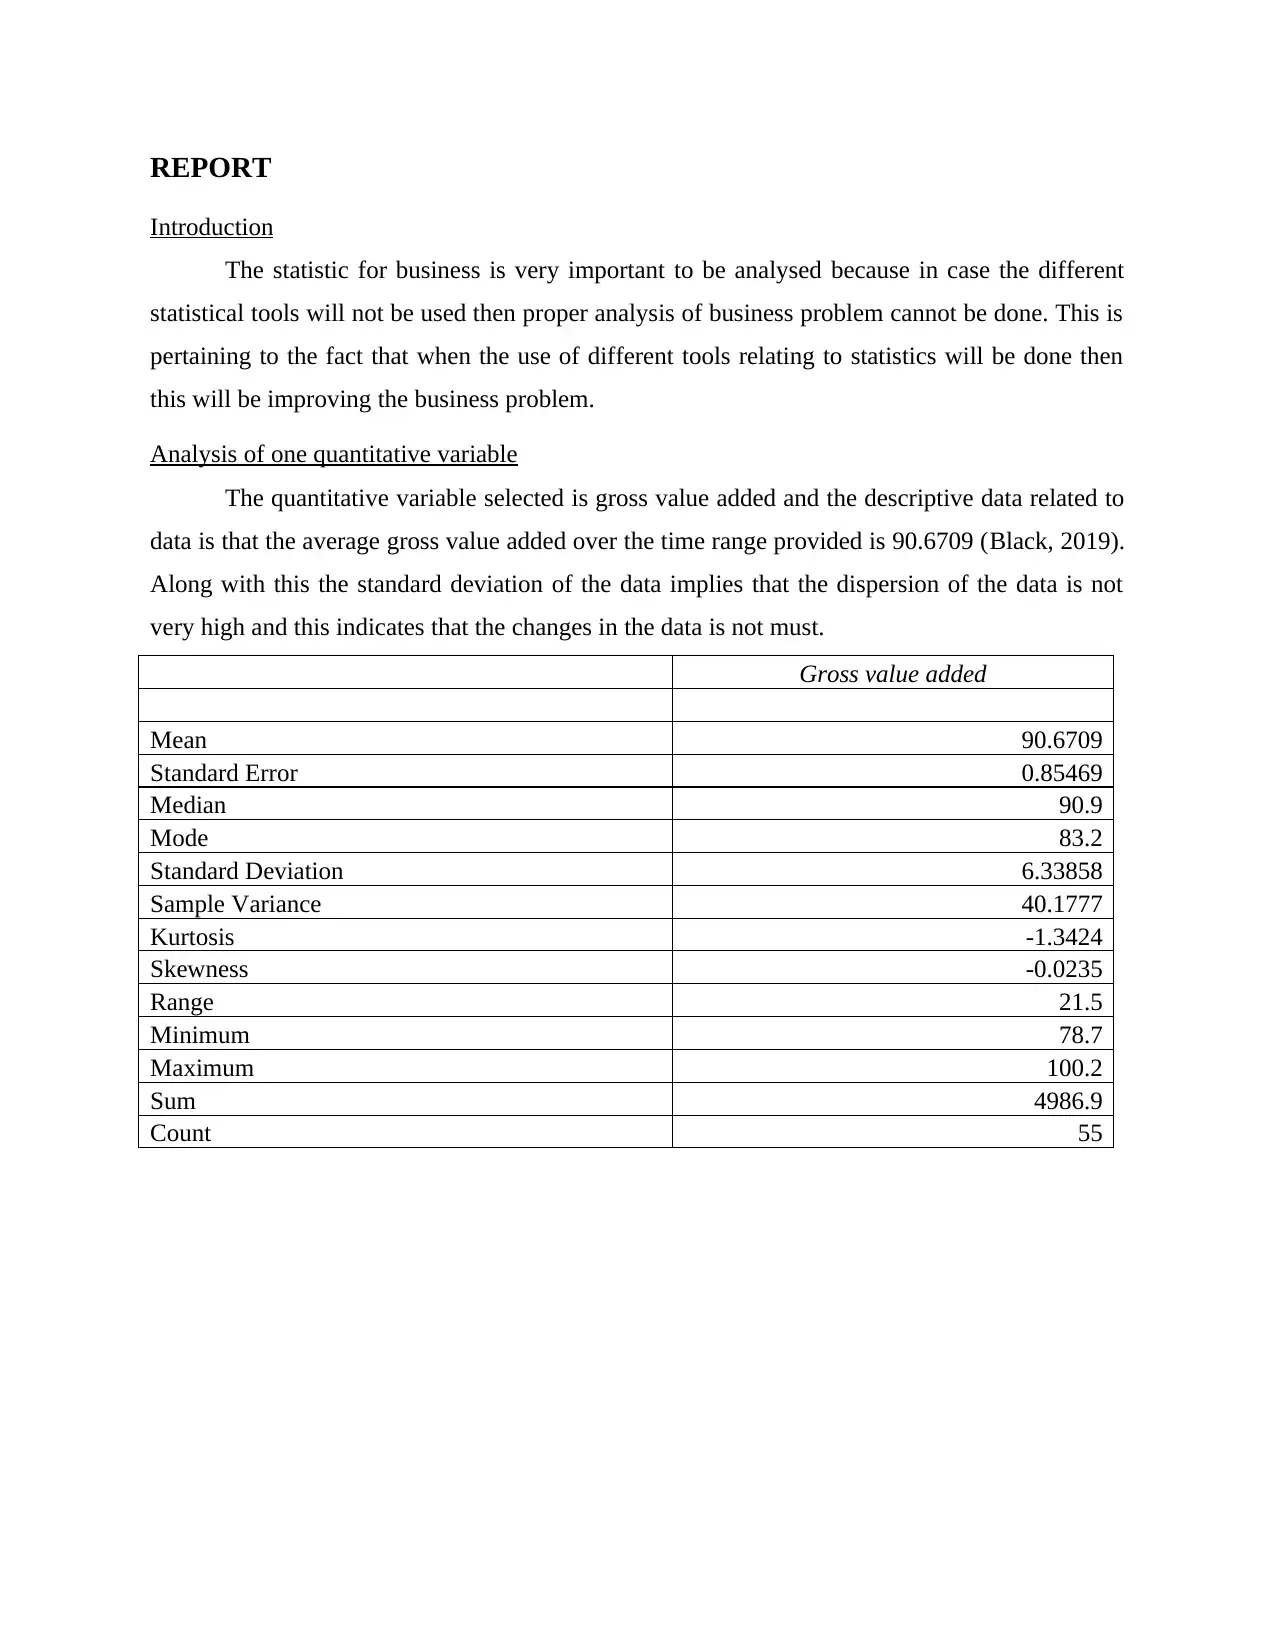
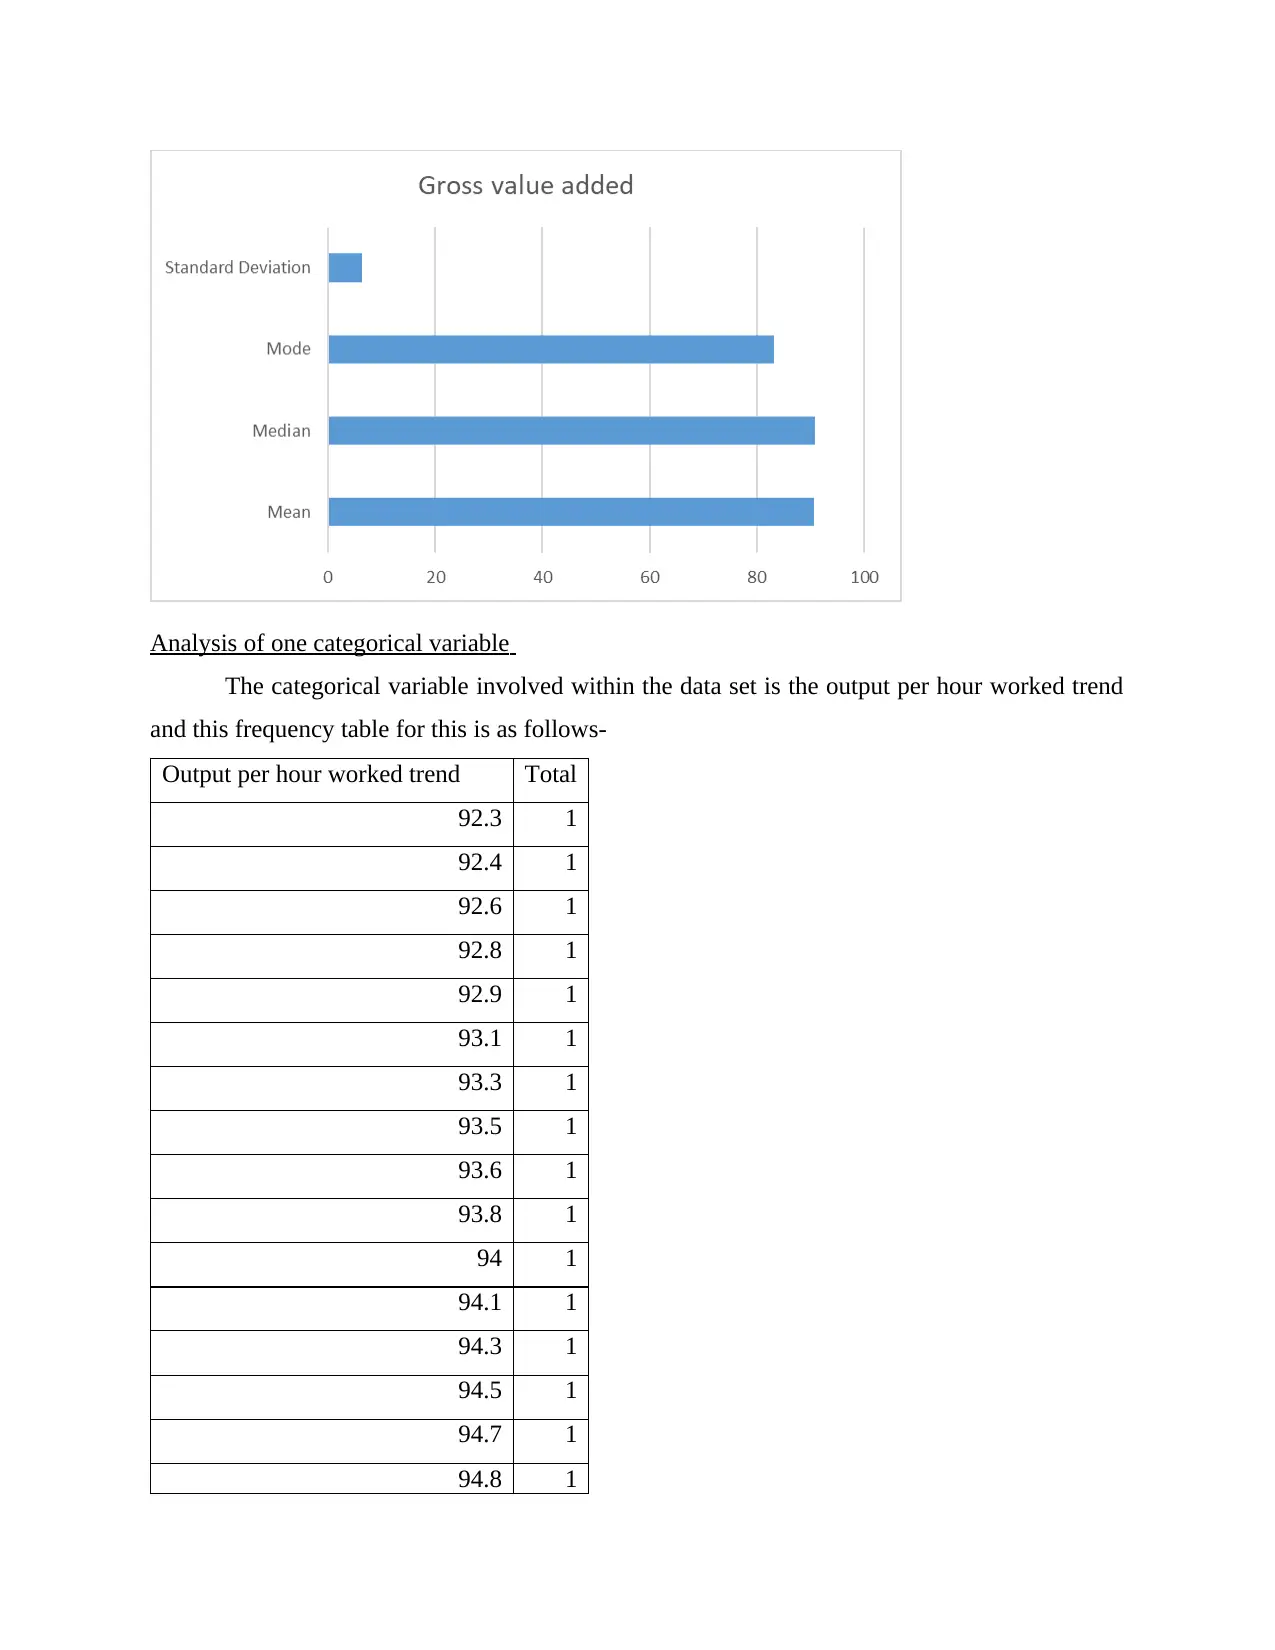
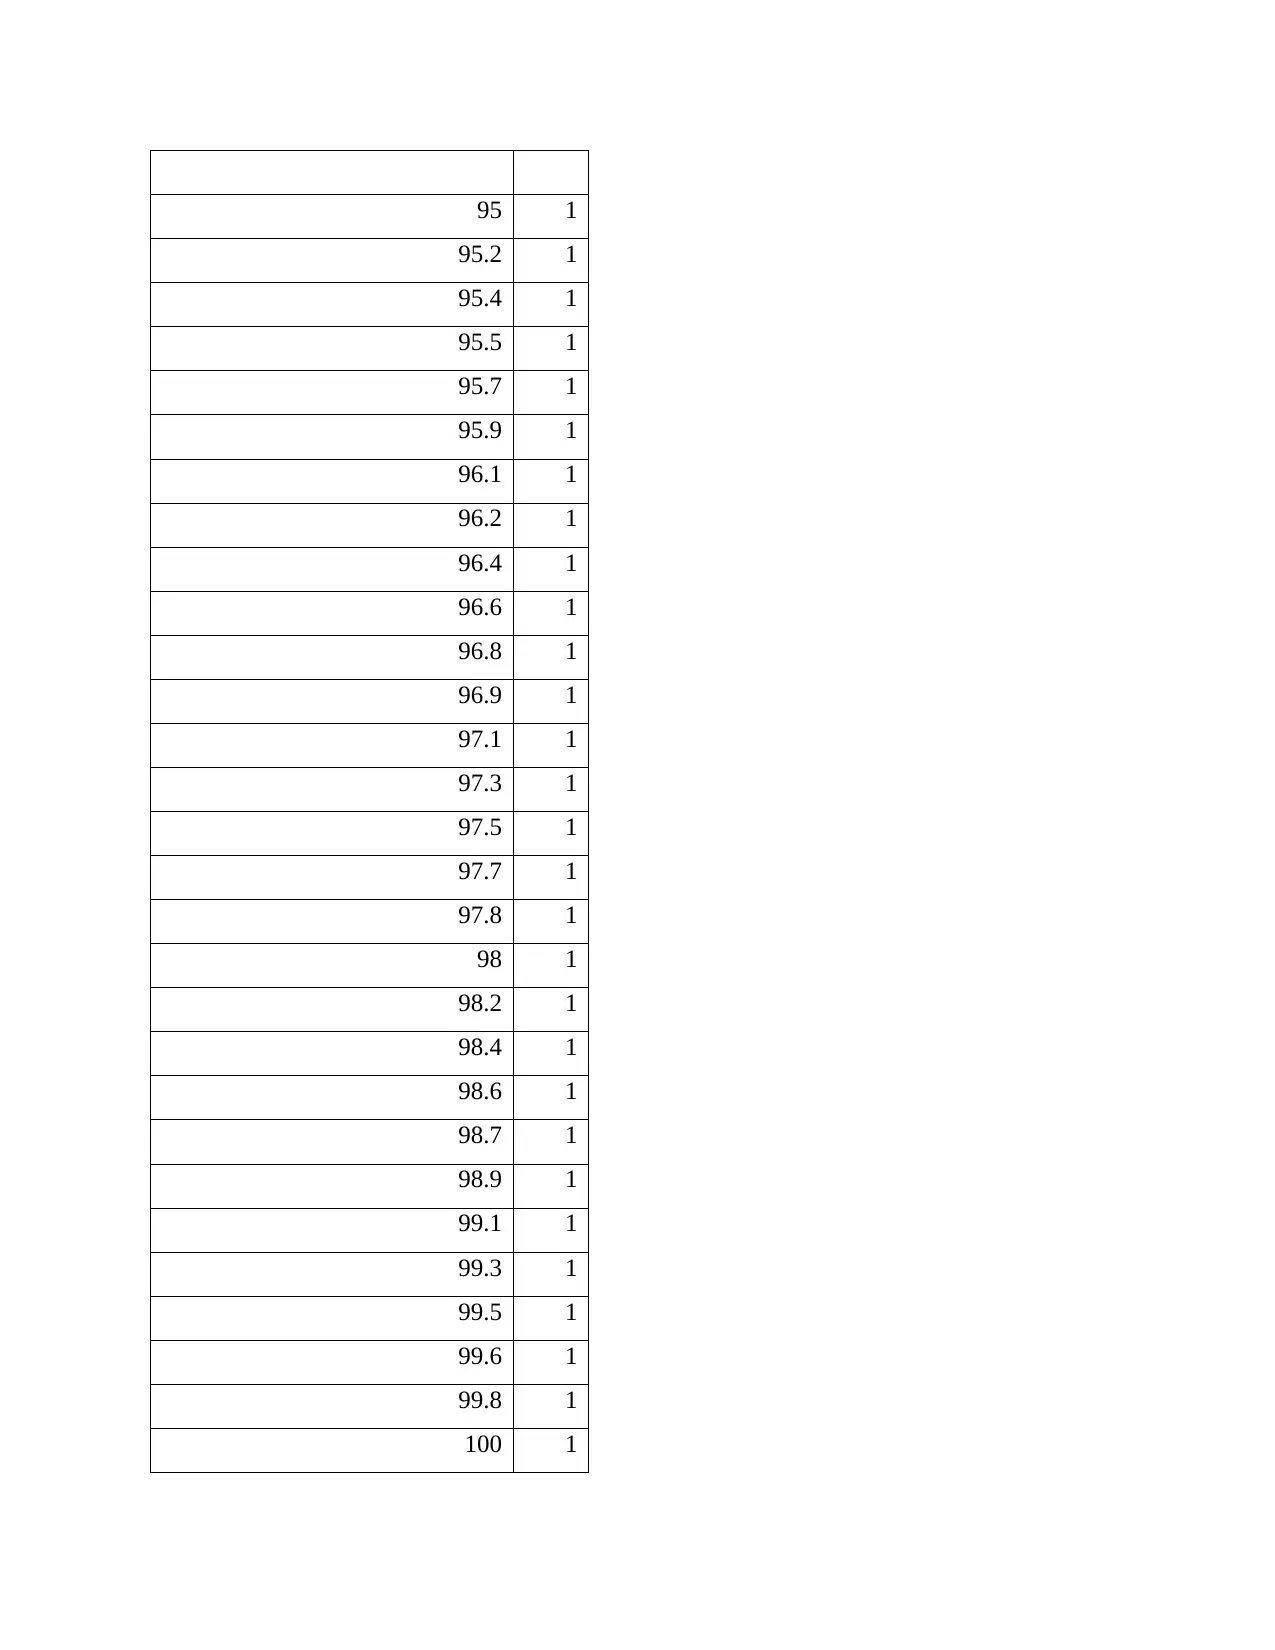
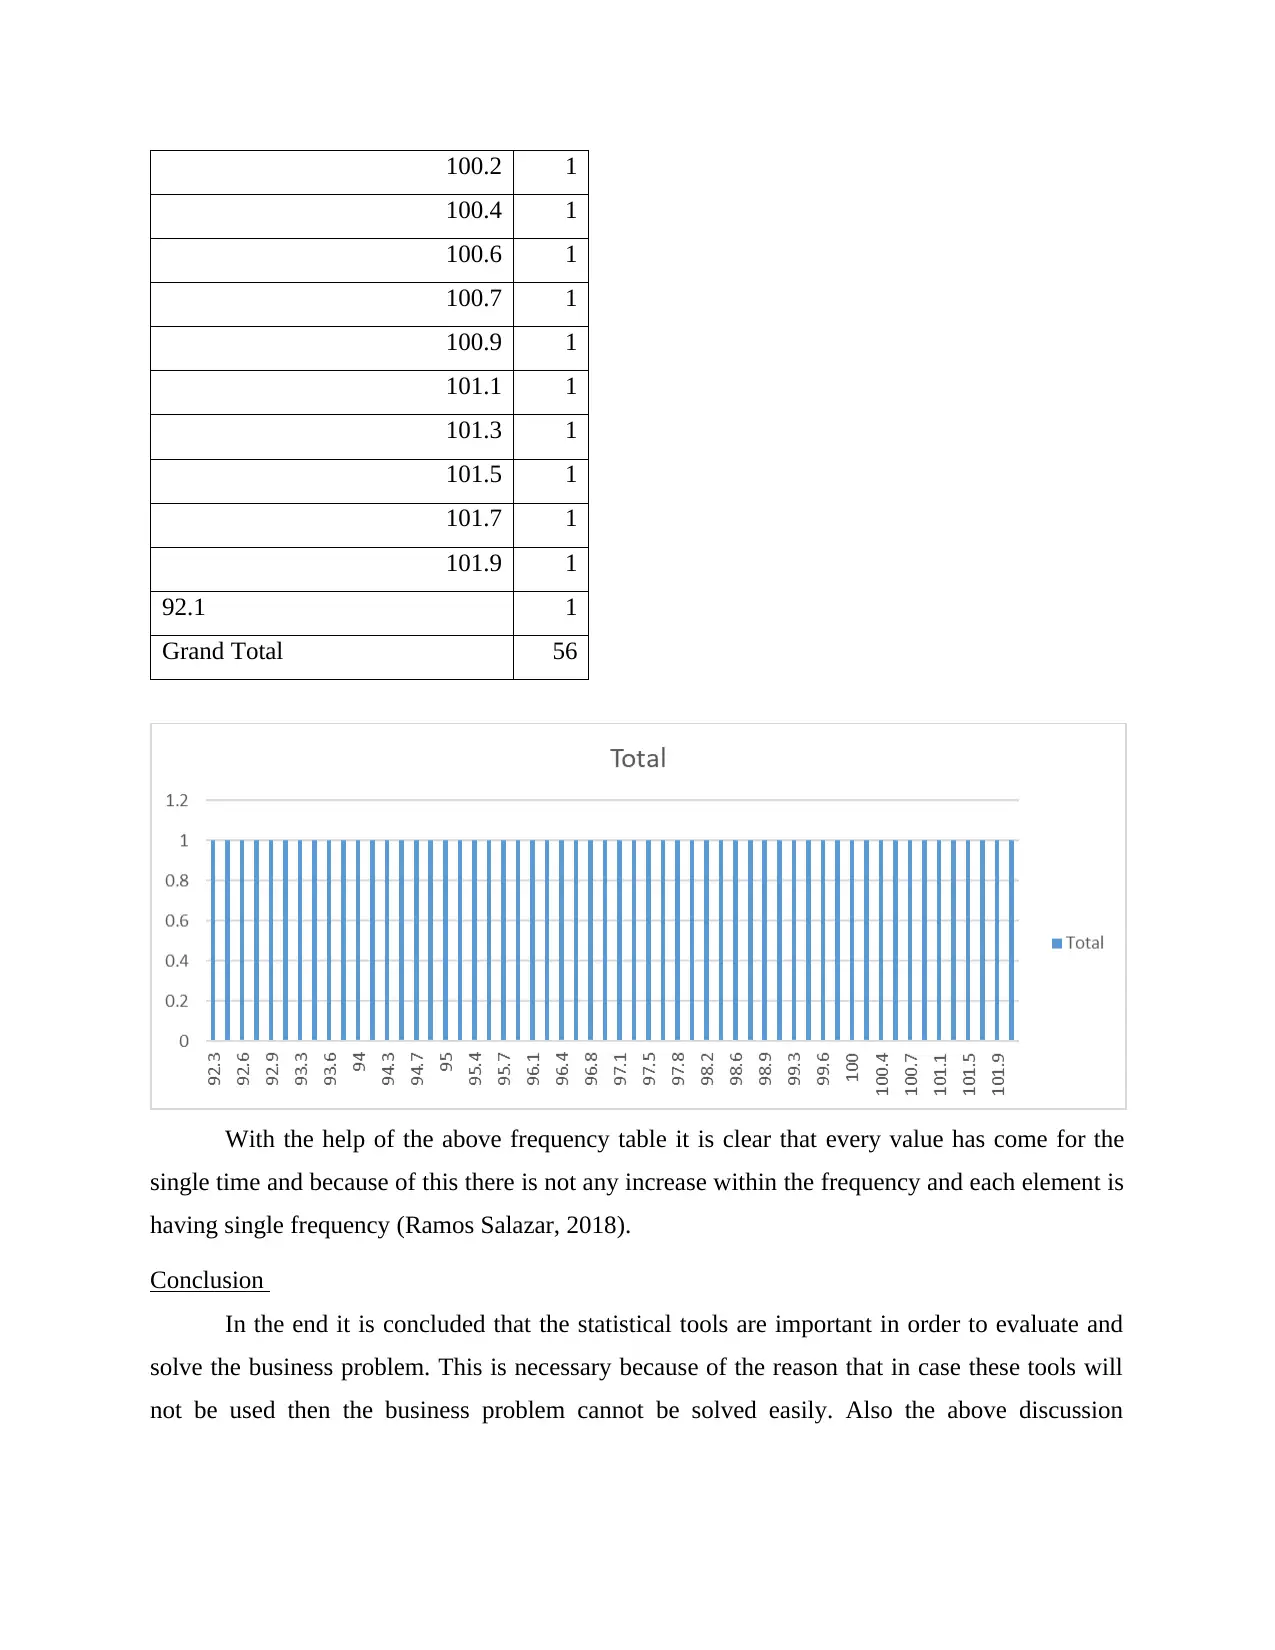
This report provides a statistical analysis of gross value added (GVA) and its relation to output per hour worked, utilizing data from the Office for National Statistics spanning 2008-2021. It addresses the research question of whether a relationship exists between hours worked and GVA, emphasizing the importance of worker productivity. The analysis includes descriptive statistics for the quantitative variable (GVA), revealing an average GVA of 90.6709 with a standard deviation indicating moderate data dispersion, and a frequency table for the categorical variable (output per hour worked trend), which shows a single occurrence for each value. The report concludes that statistical tools are essential for evaluating and solving business problems, highlighting the significance of analyzing GVA and hours worked to inform effective solutions. Desklib provides access to past papers and solved assignments to aid student learning.

Statistics for business
Paraphrase This Document
Need a fresh take? Get an instant paraphrase of this document with our AI Paraphraser

TABLE OF CONTENTS
SECLECTING THE DATASET.....................................................................................................3
ANALYSE YOUR DATA..............................................................................................................3
A..................................................................................................................................................3
B..................................................................................................................................................3
C..................................................................................................................................................3
D..................................................................................................................................................3
E..................................................................................................................................................3
F..................................................................................................................................................3
REPORT..........................................................................................................................................4
Introduction.................................................................................................................................4
Analysis of one quantitative variable..........................................................................................4
Analysis of one categorical variable...........................................................................................5
Conclusion..................................................................................................................................7
REFERENCES................................................................................................................................8

SECLECTING THE DATASET
The dataset selected is from the office for national statistics and the data selected is
relating to the gross value added. The data ranges from 2008- 2021 and the analysis of output per
hour worked is being analysed (Productivity overview, UK: October to December 2021, 2021).
ANALYSE YOUR DATA
A
The research question is ‘Is there any relation being present within the hours worked on
the gross value added by the workers?’ this is very essential to be analysed because in case the
workers will not be working in better manner then this will be affecting the overall gross value
added.
B
The target population selected is workers and the hours worked by them and the sample
of the data includes the data from 2008- 2021.
C
The two main variable within this data set involves the gross value added and the output
per hour worked.
D
The issue faced within the data collection was the wide range of the data because there
are many different sources which provides for the data (Nielsen, 2018). Hence, deciding for the
appropriate data was very time consuming and problematic.
E
The one numerical variable present within the data set is the gross value added and this
will be used in order to analyse the fact that how it is affected by the changes taking place in the
other variable.
F
The one categorical variable selected is the output per hour worked trend. This is very
essential for the reason that when the hours worked will not be analysed then the research
question will not be analysed effectively.
⊘ This is a preview!⊘
Do you want full access?
Subscribe today to unlock all pages.

Trusted by 1+ million students worldwide

REPORT
Introduction
The statistic for business is very important to be analysed because in case the different
statistical tools will not be used then proper analysis of business problem cannot be done. This is
pertaining to the fact that when the use of different tools relating to statistics will be done then
this will be improving the business problem.
Analysis of one quantitative variable
The quantitative variable selected is gross value added and the descriptive data related to
data is that the average gross value added over the time range provided is 90.6709 (Black, 2019).
Along with this the standard deviation of the data implies that the dispersion of the data is not
very high and this indicates that the changes in the data is not must.
Gross value added
Mean 90.6709
Standard Error 0.85469
Median 90.9
Mode 83.2
Standard Deviation 6.33858
Sample Variance 40.1777
Kurtosis -1.3424
Skewness -0.0235
Range 21.5
Minimum 78.7
Maximum 100.2
Sum 4986.9
Count 55
Paraphrase This Document
Need a fresh take? Get an instant paraphrase of this document with our AI Paraphraser

Analysis of one categorical variable
The categorical variable involved within the data set is the output per hour worked trend
and this frequency table for this is as follows-
Output per hour worked trend Total
92.3 1
92.4 1
92.6 1
92.8 1
92.9 1
93.1 1
93.3 1
93.5 1
93.6 1
93.8 1
94 1
94.1 1
94.3 1
94.5 1
94.7 1
94.8 1
The categorical variable involved within the data set is the output per hour worked trend
and this frequency table for this is as follows-
Output per hour worked trend Total
92.3 1
92.4 1
92.6 1
92.8 1
92.9 1
93.1 1
93.3 1
93.5 1
93.6 1
93.8 1
94 1
94.1 1
94.3 1
94.5 1
94.7 1
94.8 1

95 1
95.2 1
95.4 1
95.5 1
95.7 1
95.9 1
96.1 1
96.2 1
96.4 1
96.6 1
96.8 1
96.9 1
97.1 1
97.3 1
97.5 1
97.7 1
97.8 1
98 1
98.2 1
98.4 1
98.6 1
98.7 1
98.9 1
99.1 1
99.3 1
99.5 1
99.6 1
99.8 1
100 1
95.2 1
95.4 1
95.5 1
95.7 1
95.9 1
96.1 1
96.2 1
96.4 1
96.6 1
96.8 1
96.9 1
97.1 1
97.3 1
97.5 1
97.7 1
97.8 1
98 1
98.2 1
98.4 1
98.6 1
98.7 1
98.9 1
99.1 1
99.3 1
99.5 1
99.6 1
99.8 1
100 1
⊘ This is a preview!⊘
Do you want full access?
Subscribe today to unlock all pages.

Trusted by 1+ million students worldwide

100.2 1
100.4 1
100.6 1
100.7 1
100.9 1
101.1 1
101.3 1
101.5 1
101.7 1
101.9 1
92.1 1
Grand Total 56
With the help of the above frequency table it is clear that every value has come for the
single time and because of this there is not any increase within the frequency and each element is
having single frequency (Ramos Salazar, 2018).
Conclusion
In the end it is concluded that the statistical tools are important in order to evaluate and
solve the business problem. This is necessary because of the reason that in case these tools will
not be used then the business problem cannot be solved easily. Also the above discussion
Paraphrase This Document
Need a fresh take? Get an instant paraphrase of this document with our AI Paraphraser

evaluated that analysis of the gross value added and the number of hours worked is very
important in order to evaluate and analyse the problem and try to find solution.

REFERENCES
Books and Journals
Black, K., 2019. Business statistics: for contemporary decision making. John Wiley & Sons.
Nielsen, P. B., 2018. The puzzle of measuring global value chains–The business statistics
perspective. International economics. 153. pp.69-79.
Ramos Salazar, L., 2018. Examining the relationship between math self‐efficacy and statistics
motivation in the introductory business statistics course: Self‐compassion as a
mediator. Decision Sciences Journal of Innovative Education. 16(2). pp.140-160.
Online
Productivity overview, UK: October to December 2021. 2021. [Online]. Available through: <
https://www.ons.gov.uk/employmentandlabourmarket/peopleinwork/labourproductivity/
articles/ukproductivityintroduction/octobertodecember2021 >
⊘ This is a preview!⊘
Do you want full access?
Subscribe today to unlock all pages.

Trusted by 1+ million students worldwide
1 out of 9
Related Documents

Your All-in-One AI-Powered Toolkit for Academic Success.
+13062052269
info@desklib.com
Available 24*7 on WhatsApp / Email
Unlock your academic potential
Copyright © 2020–2025 A2Z Services. All Rights Reserved. Developed and managed by ZUCOL.