Statistics Assignment - STAT101: Data Analysis and Interpretation
VerifiedAdded on 2022/11/24
|12
|597
|264
Homework Assignment
AI Summary
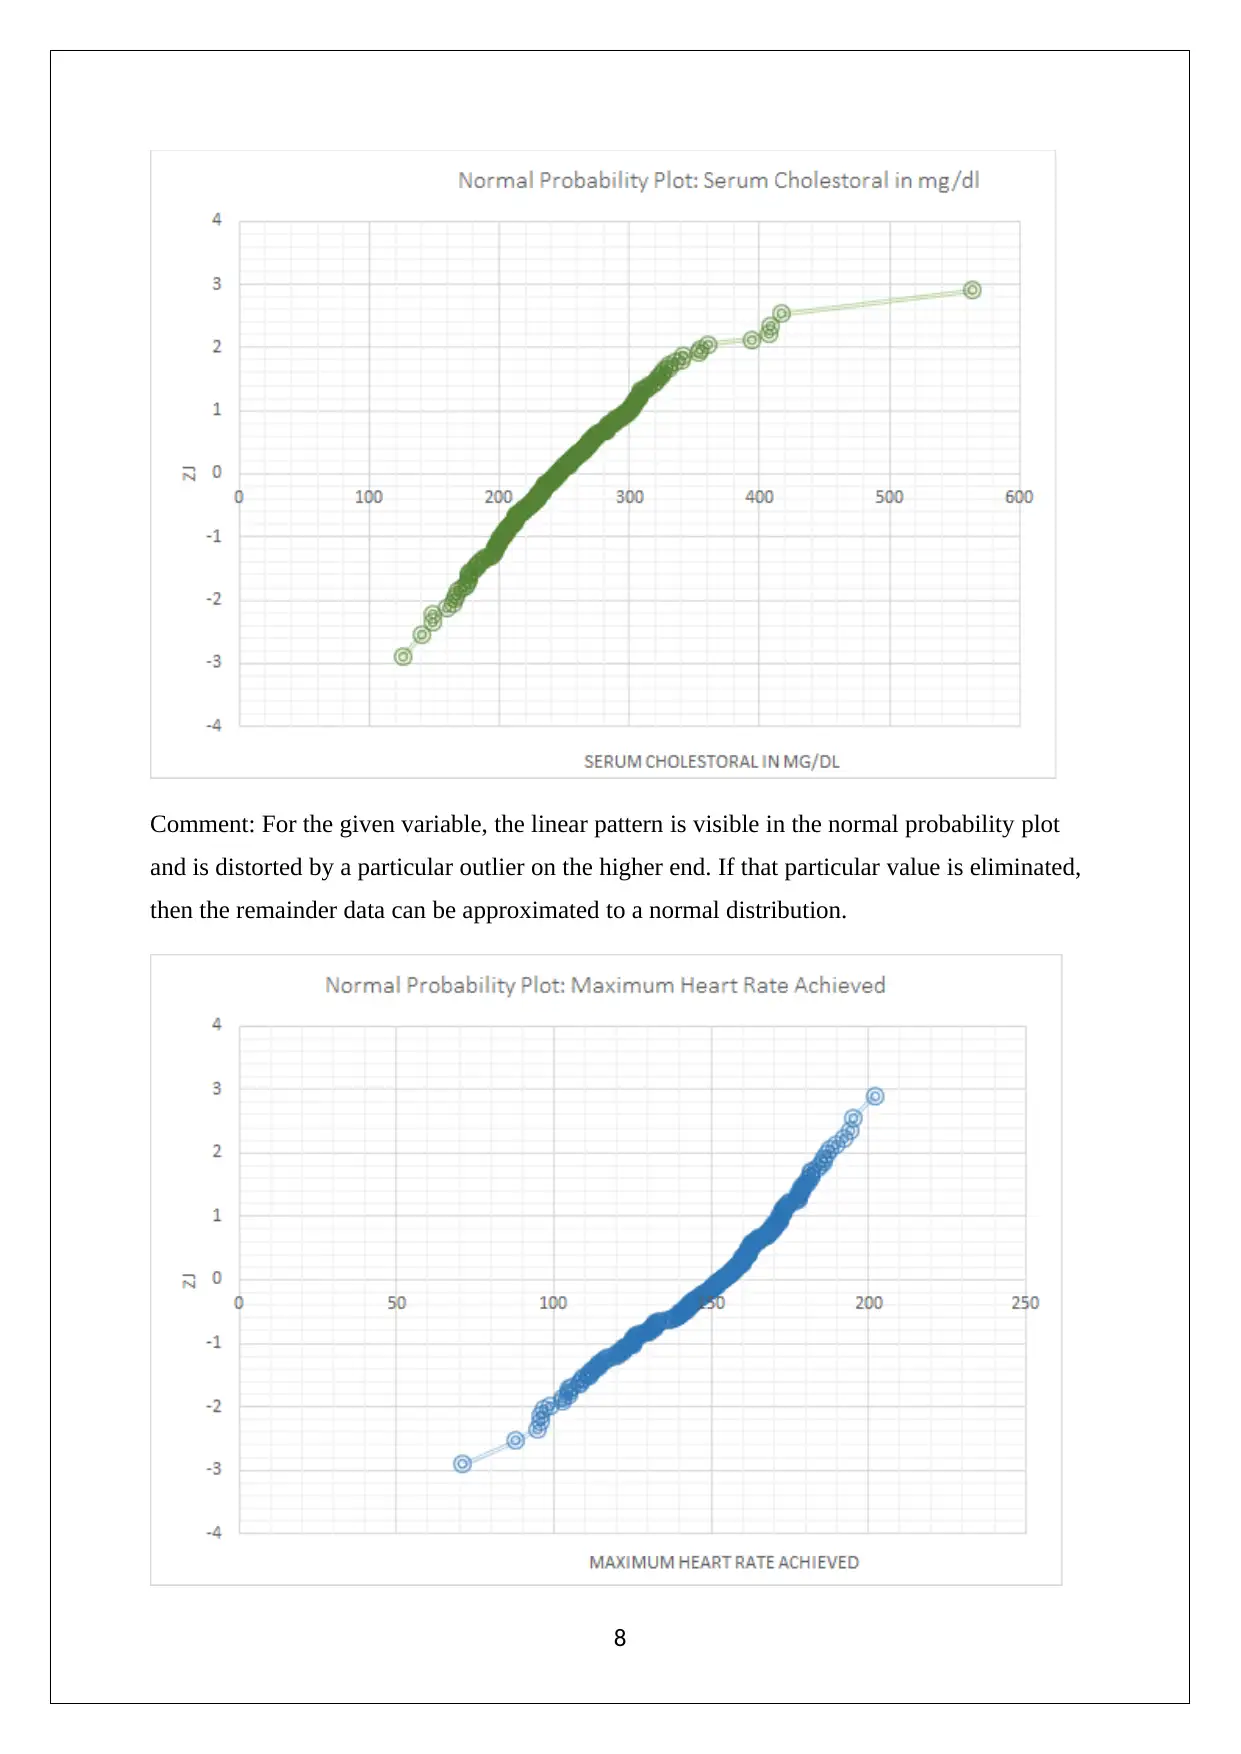
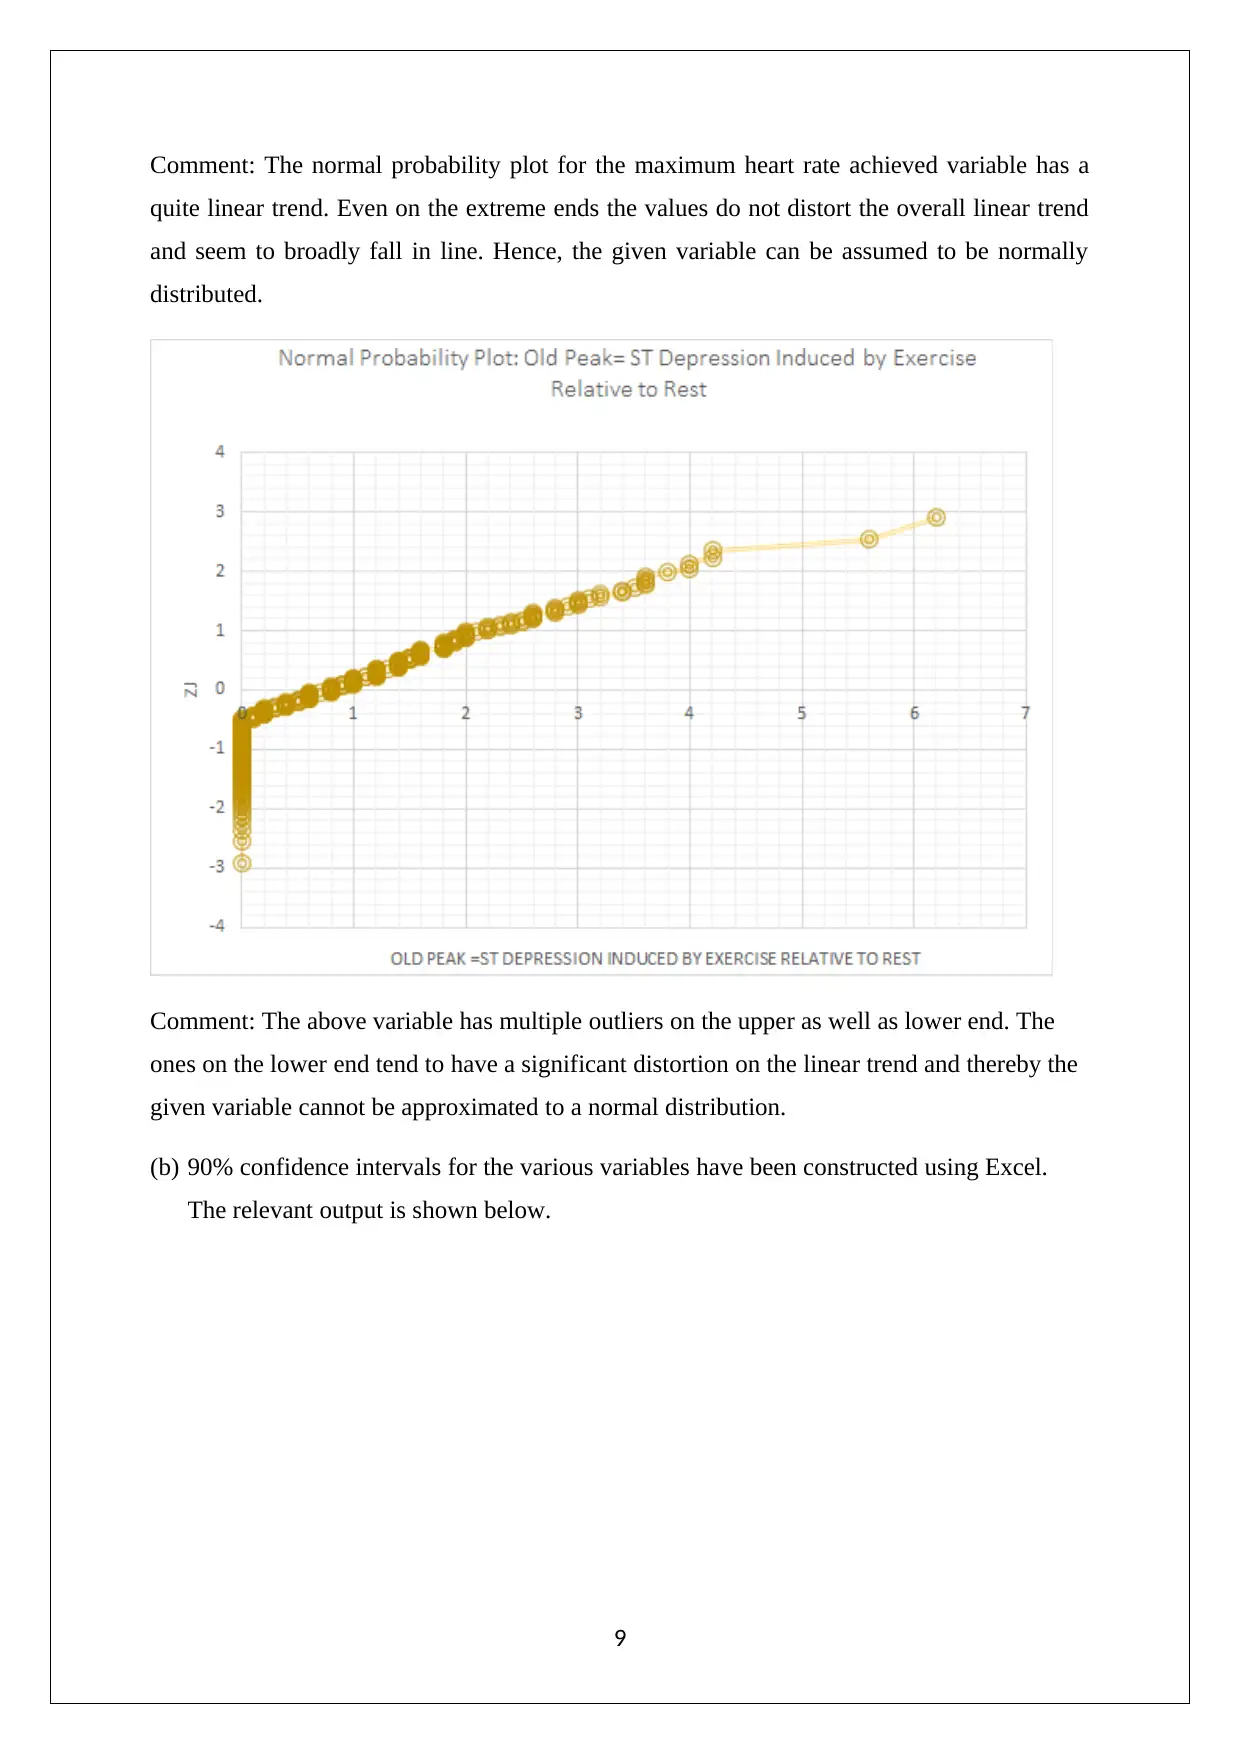
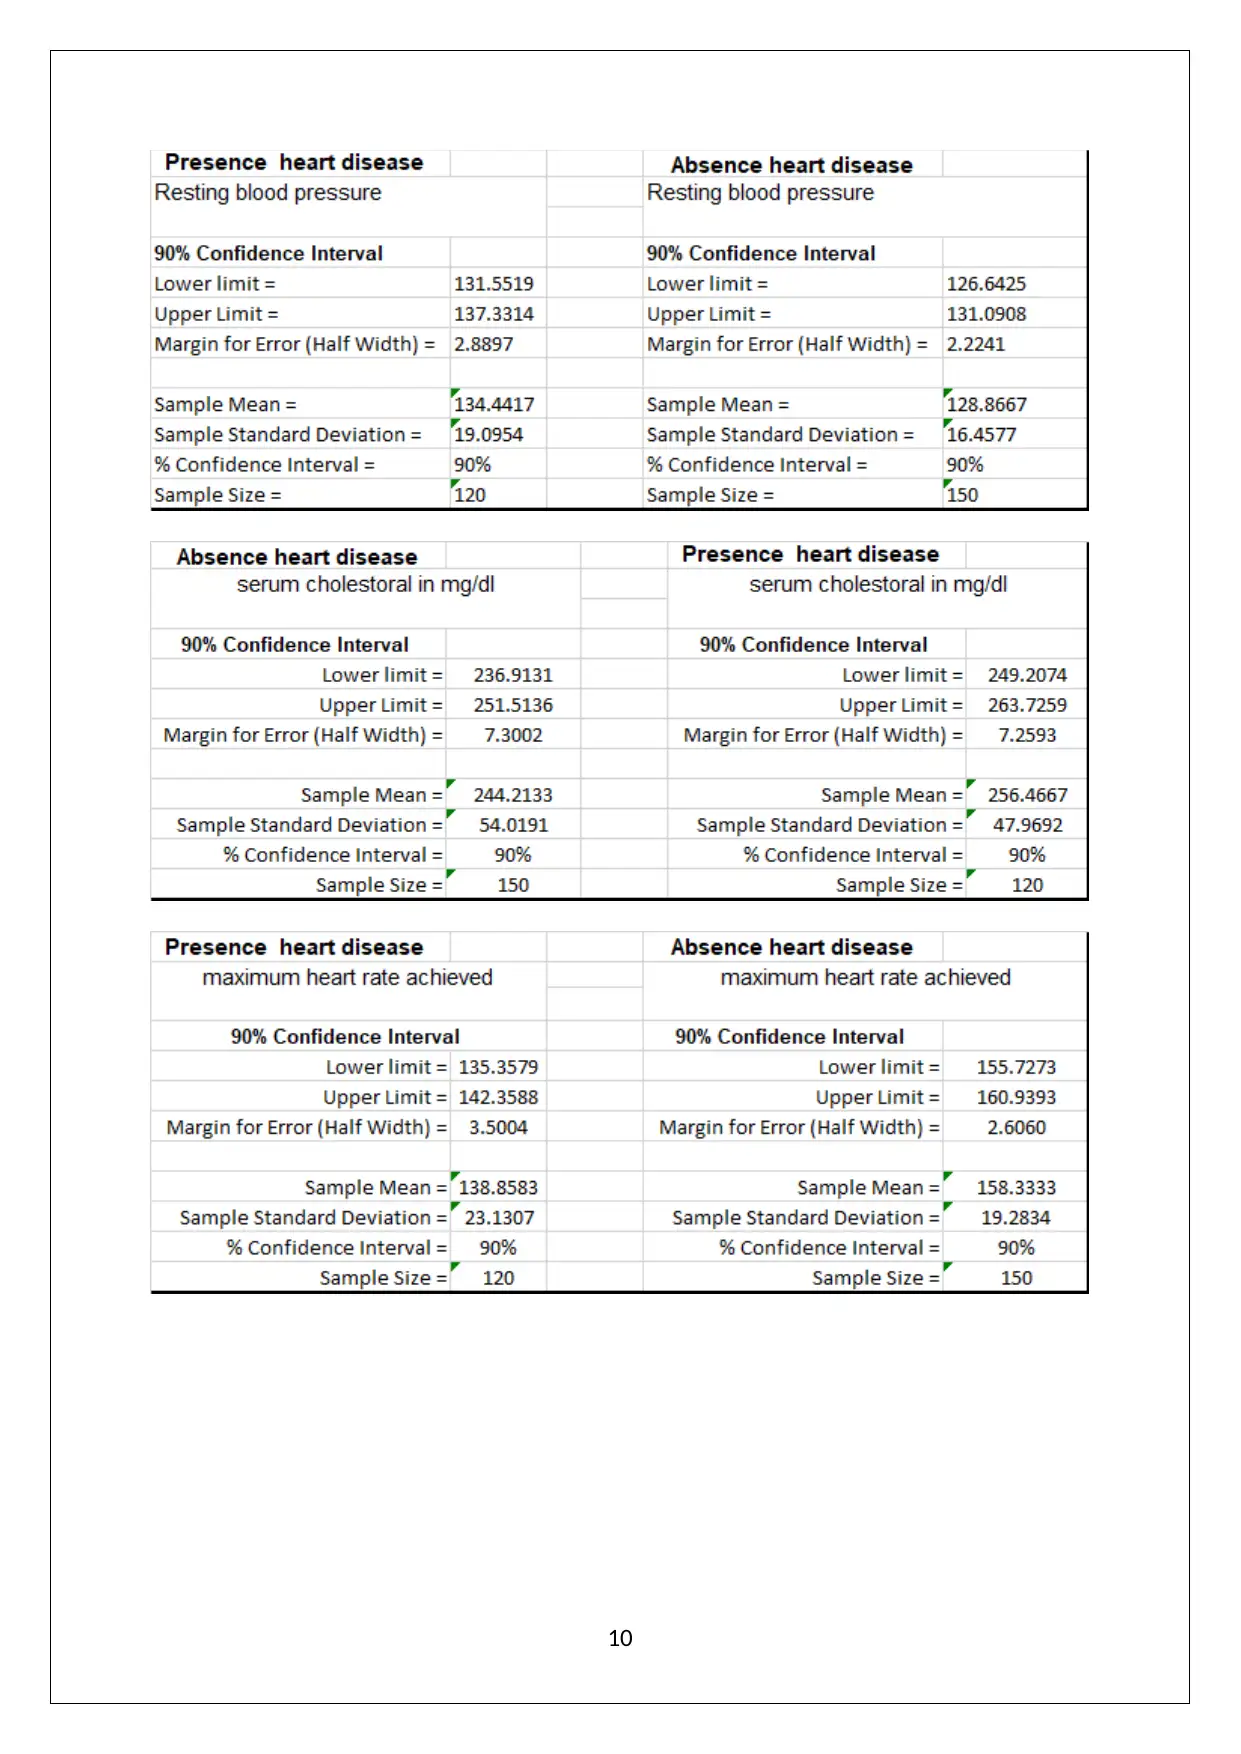
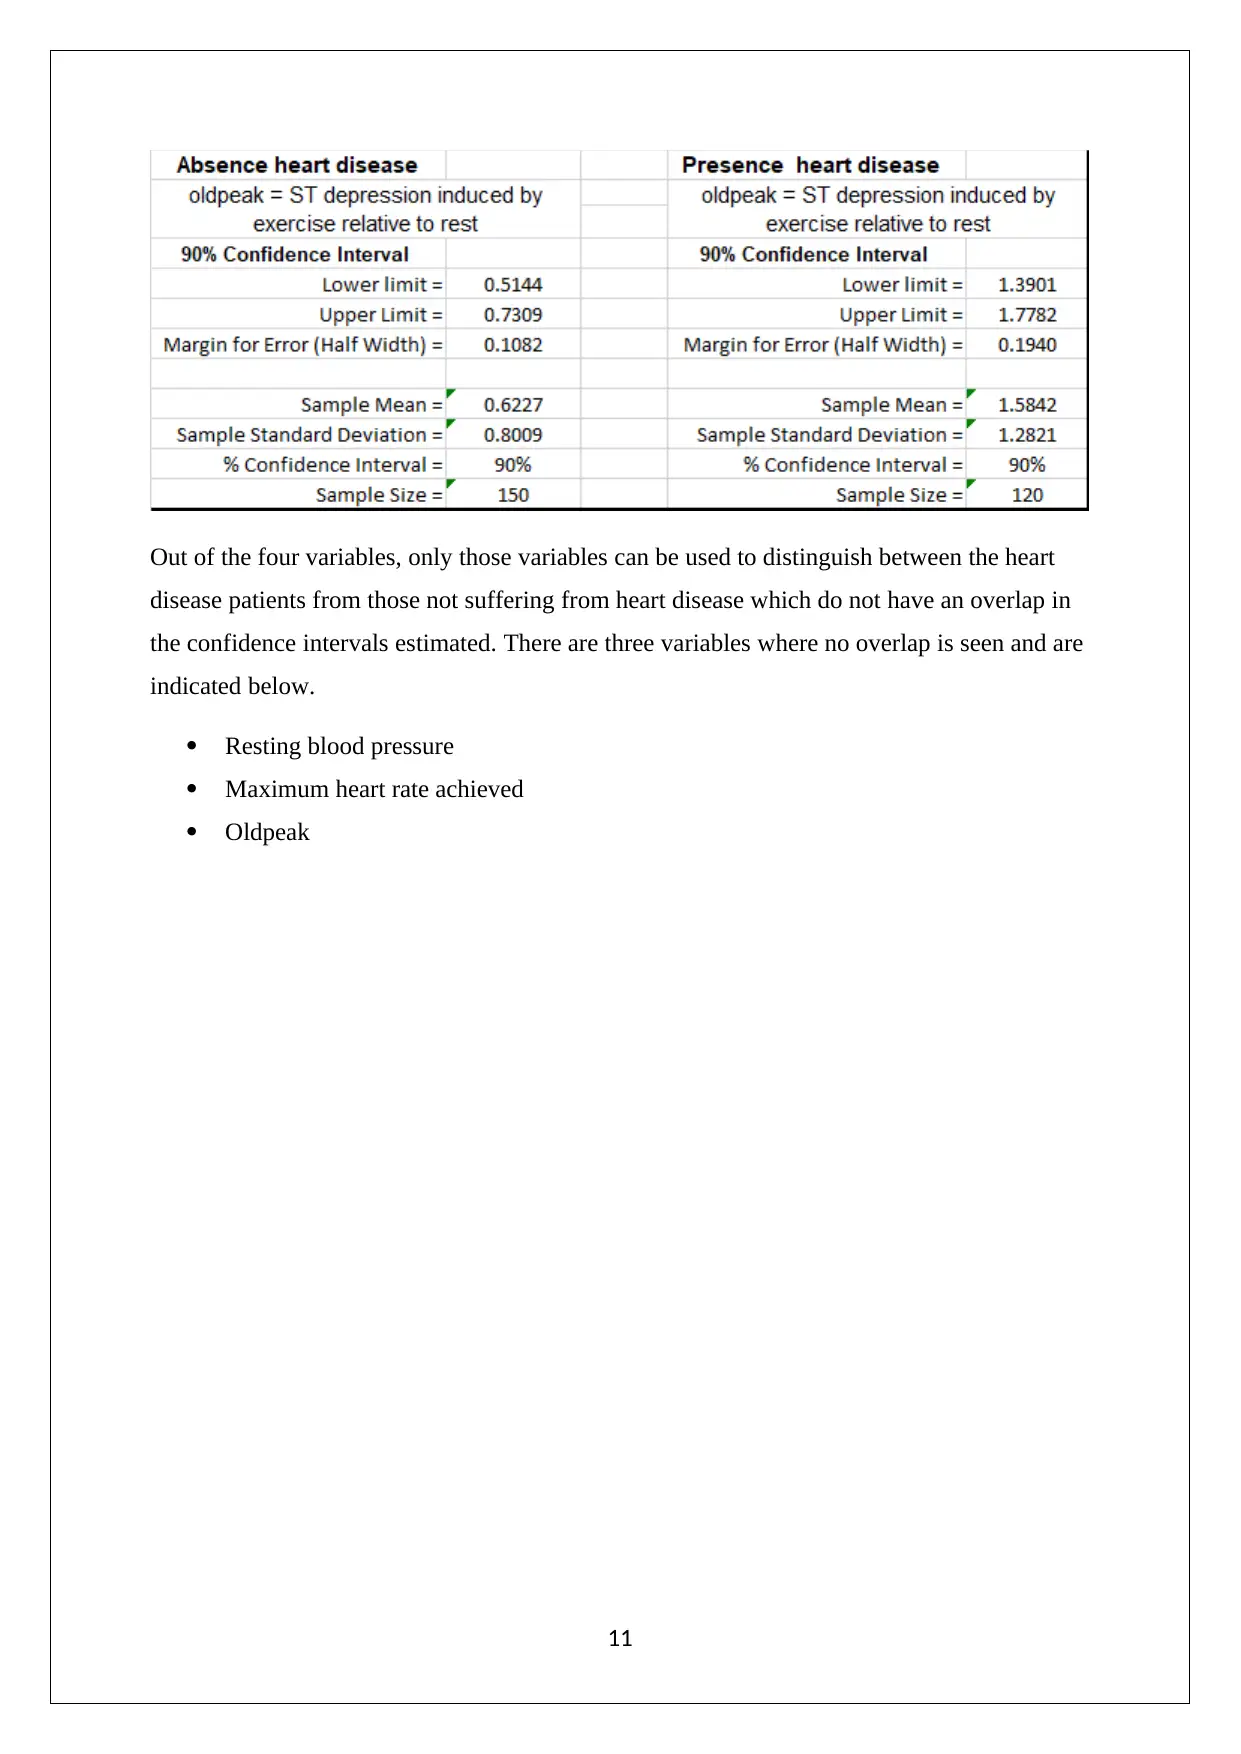
This statistics assignment solution addresses various statistical concepts and techniques applied to real-world data. It includes an analysis of financial data, such as the market capitalization of healthcare-related stocks, and healthcare data, involving resting blood pressure and heart rate. The solution...

STATISTICS
[Document subtitle]
[DATE]
STUDENT ID
[Document subtitle]
[DATE]
STUDENT ID
Secure Best Marks with AI Grader
Need help grading? Try our AI Grader for instant feedback on your assignments.

Question 1
(a) Opening price (Quarterly)
ResMed Inc Fisher and Paykel Healthcare
Stem-leaf plot
(b) Graph (Histogram and Polygon)
1
(a) Opening price (Quarterly)
ResMed Inc Fisher and Paykel Healthcare
Stem-leaf plot
(b) Graph (Histogram and Polygon)
1

(c) Market cap of six Australian listed stocks on ASX and have healthcare related business.
(d) The key observations with regards to the two companies are summarised below.
The quarterly earnings growth rate for FPH is about 20% while that for RMD is -5%.
The dividend yields for both companies are comparable at about 1.2%.
The beta associated with FPH stock is 1.21 while beta associated with RMD is 0.72.
From the above information, an investor with risk appetite should invest in FPH considering
the future growth which the company can deliver.
Source: https://au.finance.yahoo.com/quote/FPH.AX/key-statistics?p=FPH.AX
https://au.finance.yahoo.com/quote/RMD.AX/key-statistics?p=RMD.AX
2

Question 2
(a) Descriptive statistics(Weekly rents)
(b) Descriptive statistics (Weekly rents)
(c) Box- whiskerPlot
(d) The boxplot for weekly rental of 1 room apartment for various locations in Australia
clearly highlight that the mean rents are driven by the underlying location. This is clearly
highlighted from the fact that Sydney commands on average a premium of more than $
3
Secure Best Marks with AI Grader
Need help grading? Try our AI Grader for instant feedback on your assignments.

250 a week over other cities including Melbourne. The given weekly rent data for Sydney
seems to be skewed on the higher end considering that Airbnb shows a host of apartment
listings which offer more competitive rates than the ones highlighted in the question.
Question 3
(e) The sorghum grain production estimates for the state of South Australia would be termed
as unreliable as ABS indicates an associated relative standard error exceeds 50%.
Question 4
4

5

(a) (i)Probability of no rainfall
Days of rainfall = 170 and Mean λ = 170
52 = 3.3077
P(X = 0 | λ= 3.3077) = 3.30770 × e−3.30779
0! = 0.0366
(ii) Probability rainfall for 3 days ormore days
(b) (i) Probability rainfall amount would be between 10 and 50 mm
Standard error = Standard deviation
ඥሺ52ሻ = 21.18
(ii) Rainfall amount = X mm
Question 5
6
Paraphrase This Document
Need a fresh take? Get an instant paraphrase of this document with our AI Paraphraser

(a) Normality Probability Plot (NPP)
Comment: There is a broad linear pattern observed in the above normal probability plot
which seems to be disturbed by two outliers at the higher end and two on the lower. As a
result, the given variable is approximately normal.
7
Comment: There is a broad linear pattern observed in the above normal probability plot
which seems to be disturbed by two outliers at the higher end and two on the lower. As a
result, the given variable is approximately normal.
7

Comment: For the given variable, the linear pattern is visible in the normal probability plot
and is distorted by a particular outlier on the higher end. If that particular value is eliminated,
then the remainder data can be approximated to a normal distribution.
8
and is distorted by a particular outlier on the higher end. If that particular value is eliminated,
then the remainder data can be approximated to a normal distribution.
8

Comment: The normal probability plot for the maximum heart rate achieved variable has a
quite linear trend. Even on the extreme ends the values do not distort the overall linear trend
and seem to broadly fall in line. Hence, the given variable can be assumed to be normally
distributed.
Comment: The above variable has multiple outliers on the upper as well as lower end. The
ones on the lower end tend to have a significant distortion on the linear trend and thereby the
given variable cannot be approximated to a normal distribution.
(b) 90% confidence intervals for the various variables have been constructed using Excel.
The relevant output is shown below.
9
Secure Best Marks with AI Grader
Need help grading? Try our AI Grader for instant feedback on your assignments.

10

Out of the four variables, only those variables can be used to distinguish between the heart
disease patients from those not suffering from heart disease which do not have an overlap in
the confidence intervals estimated. There are three variables where no overlap is seen and are
indicated below.
Resting blood pressure
Maximum heart rate achieved
Oldpeak
11
disease patients from those not suffering from heart disease which do not have an overlap in
the confidence intervals estimated. There are three variables where no overlap is seen and are
indicated below.
Resting blood pressure
Maximum heart rate achieved
Oldpeak
11
1 out of 12
Related Documents

Your All-in-One AI-Powered Toolkit for Academic Success.
+13062052269
info@desklib.com
Available 24*7 on WhatsApp / Email
Unlock your academic potential
© 2024 | Zucol Services PVT LTD | All rights reserved.