Comprehensive Statistics and Hypothesis Testing Assignment

Verified

Added on  2023/01/03

|12
|1692
|79
Homework Assignment
AI Summary
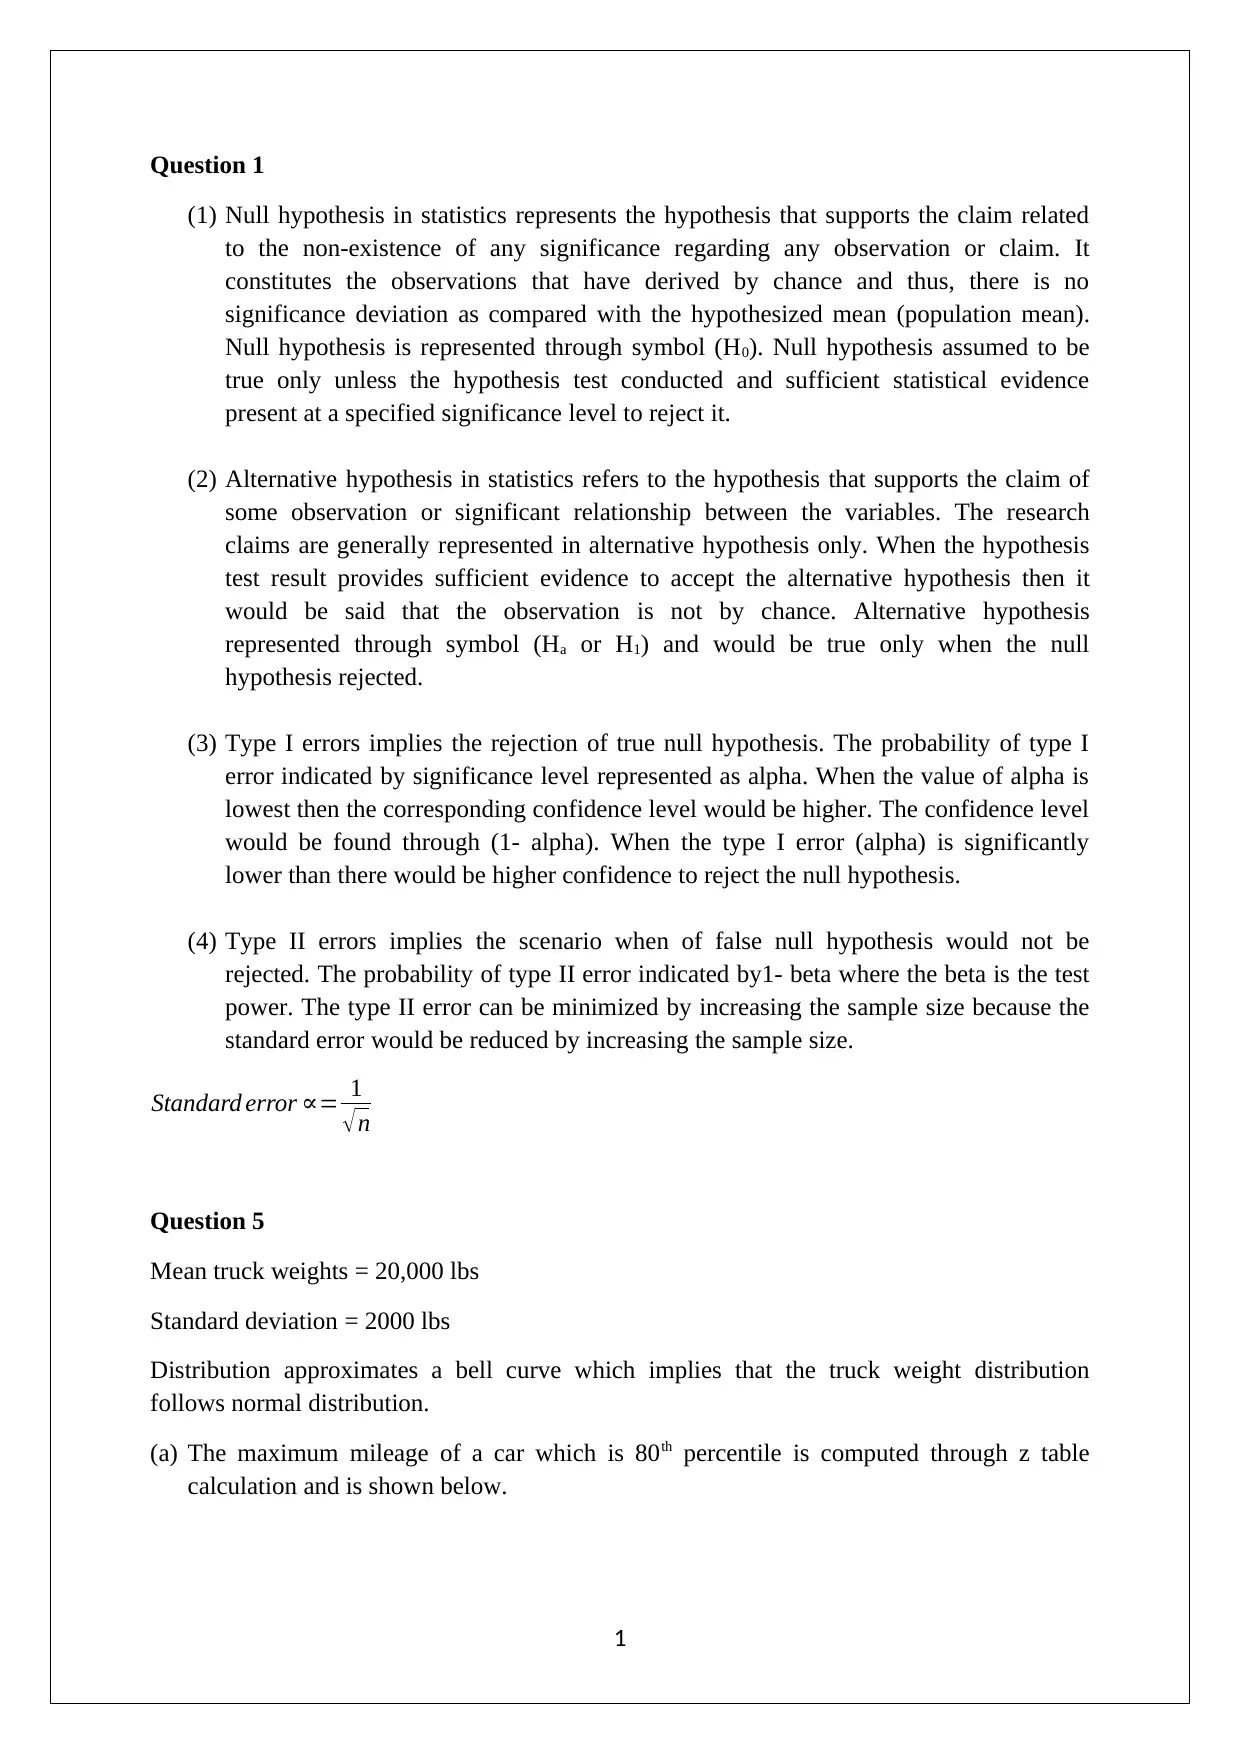
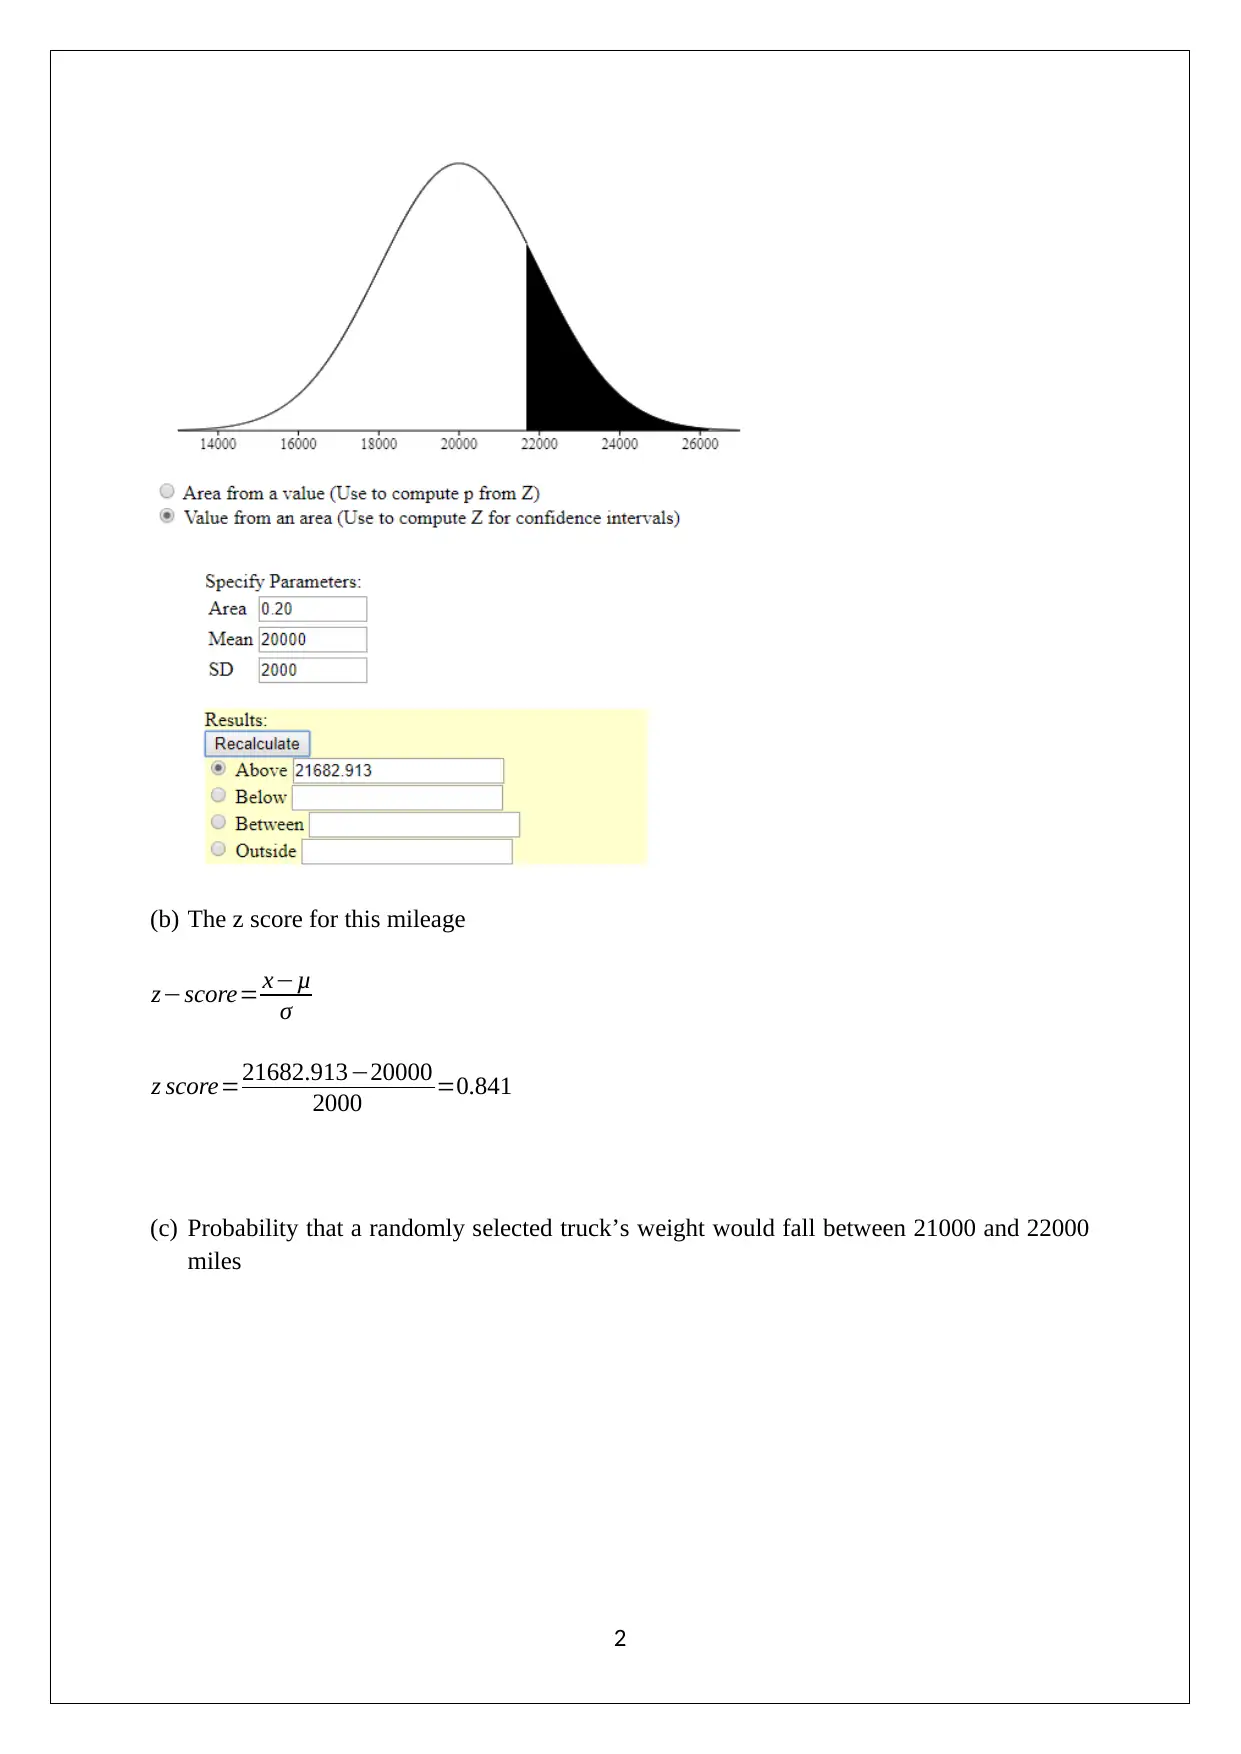
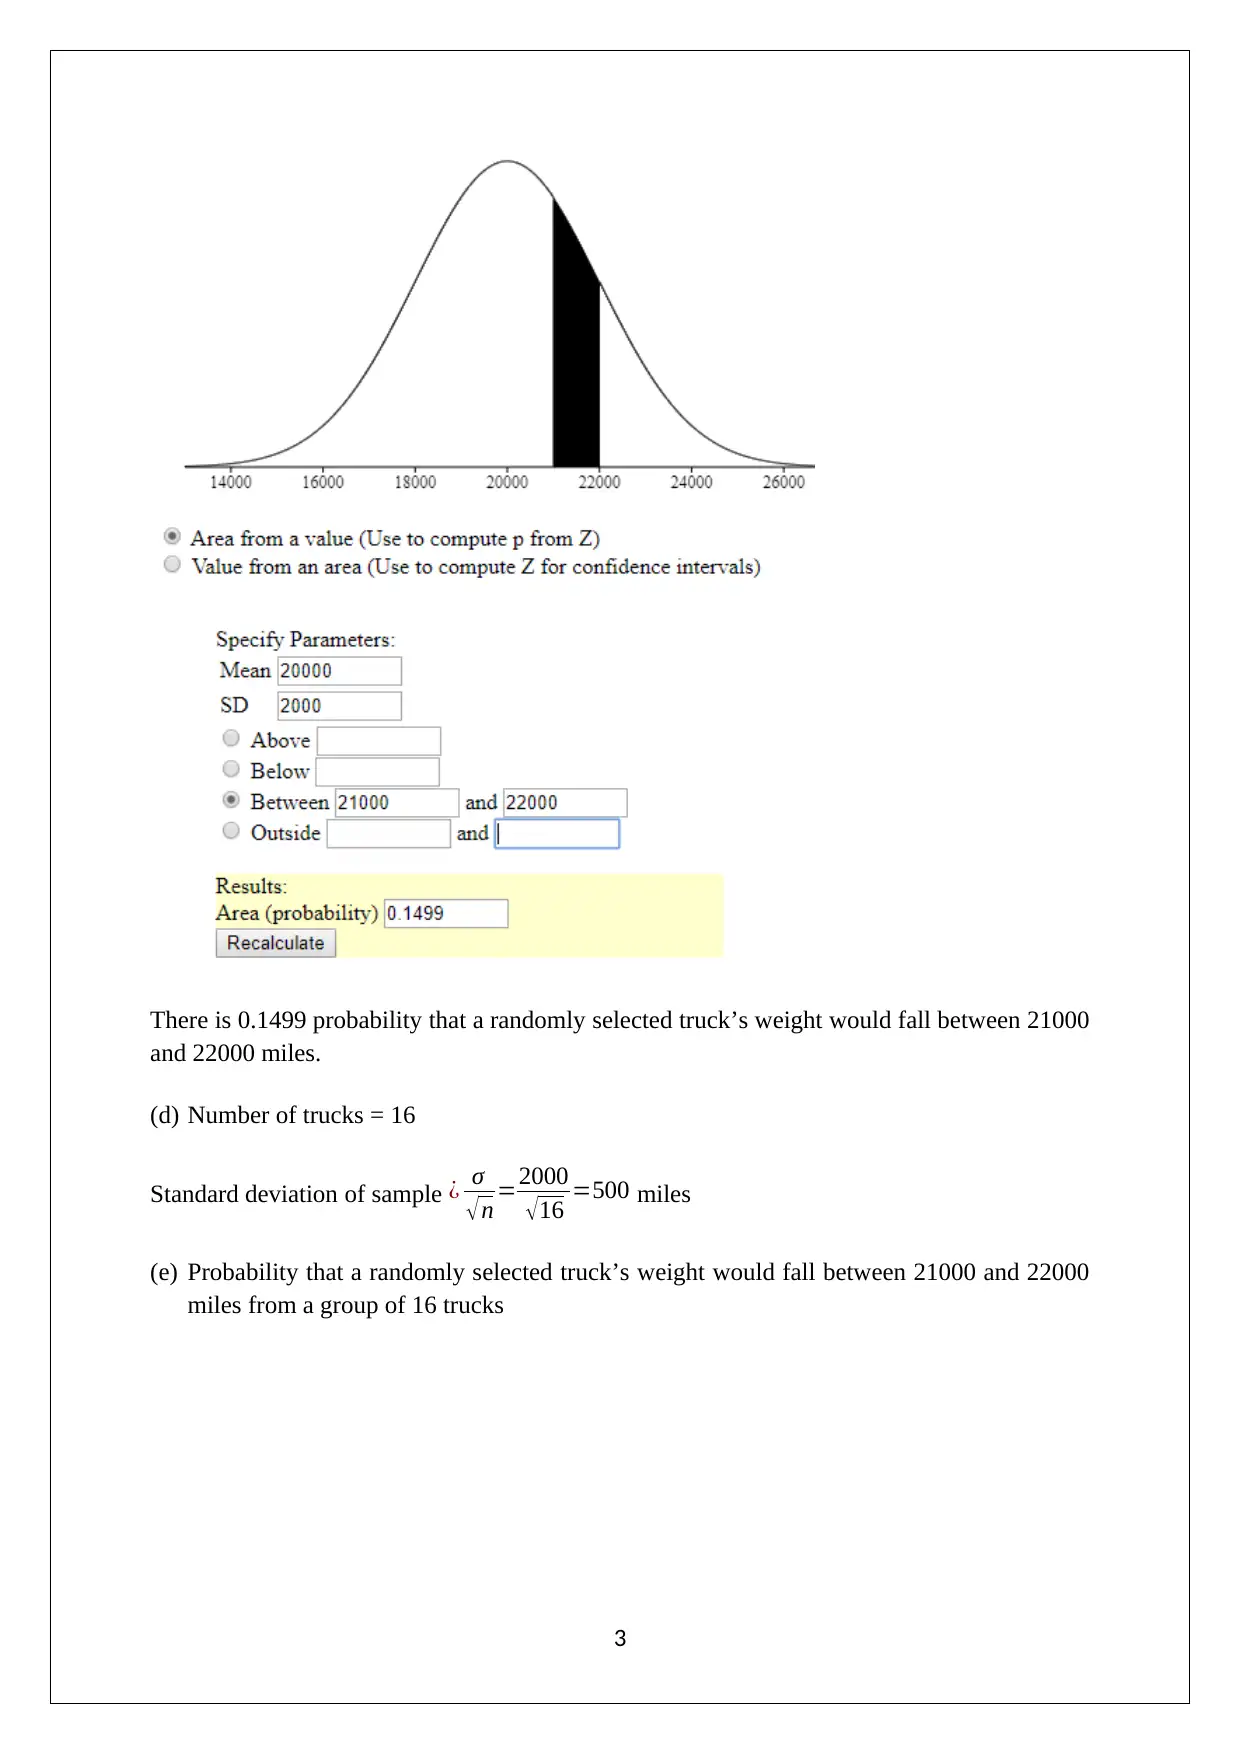
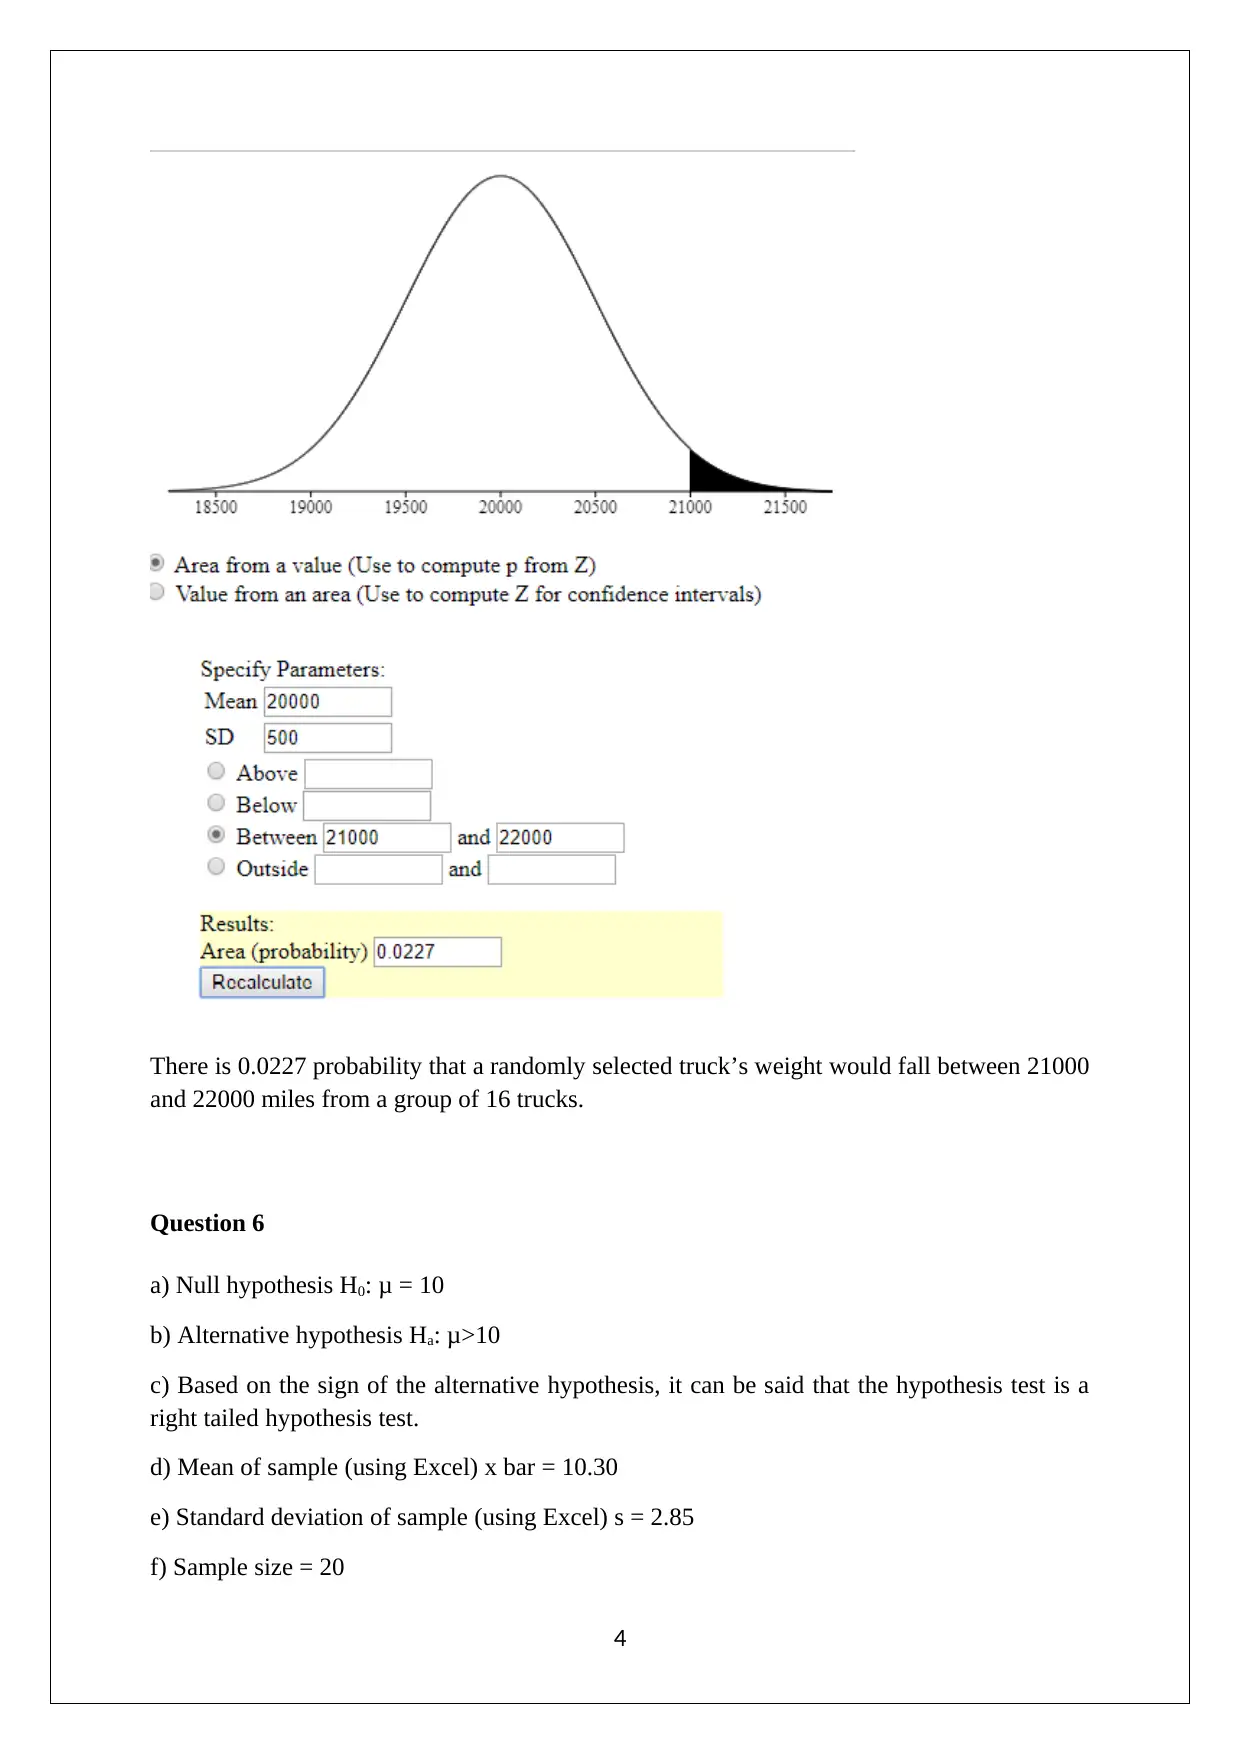
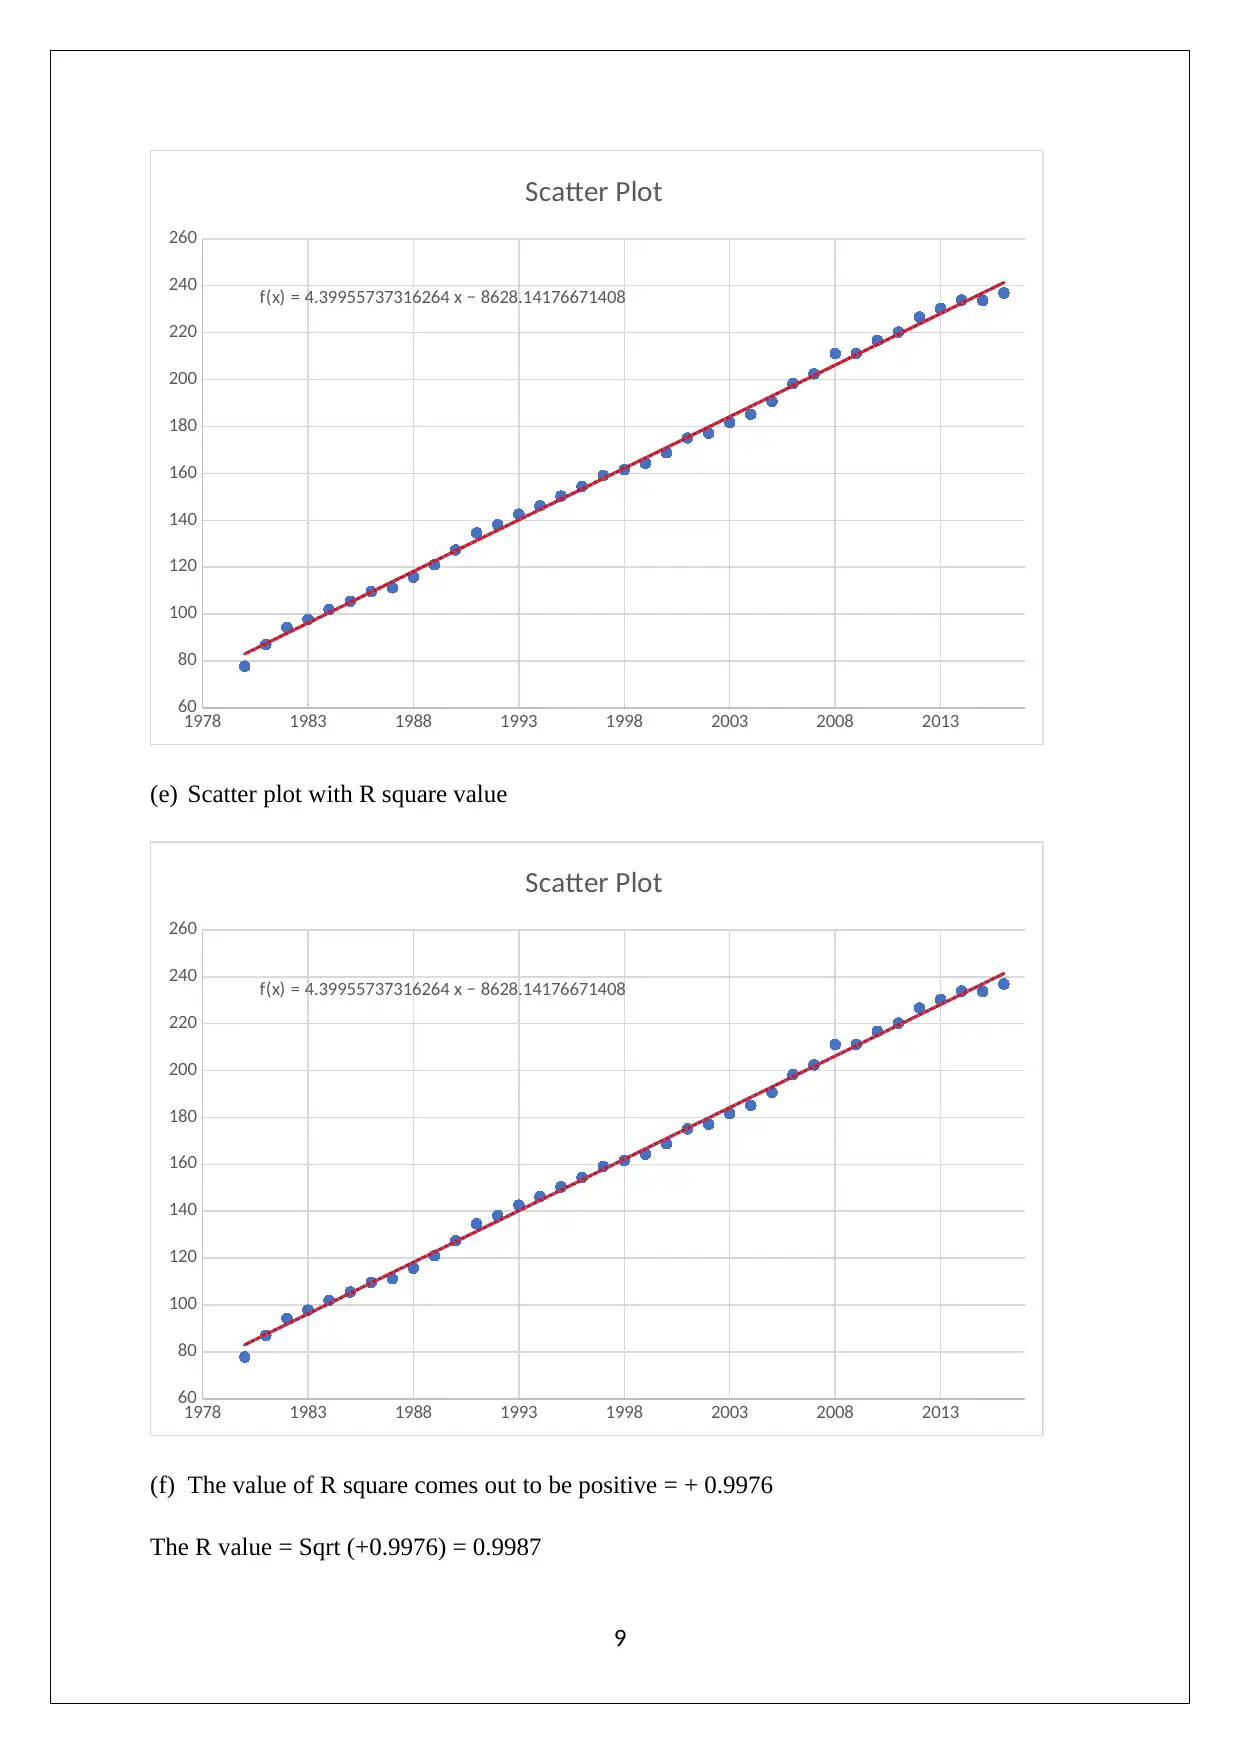
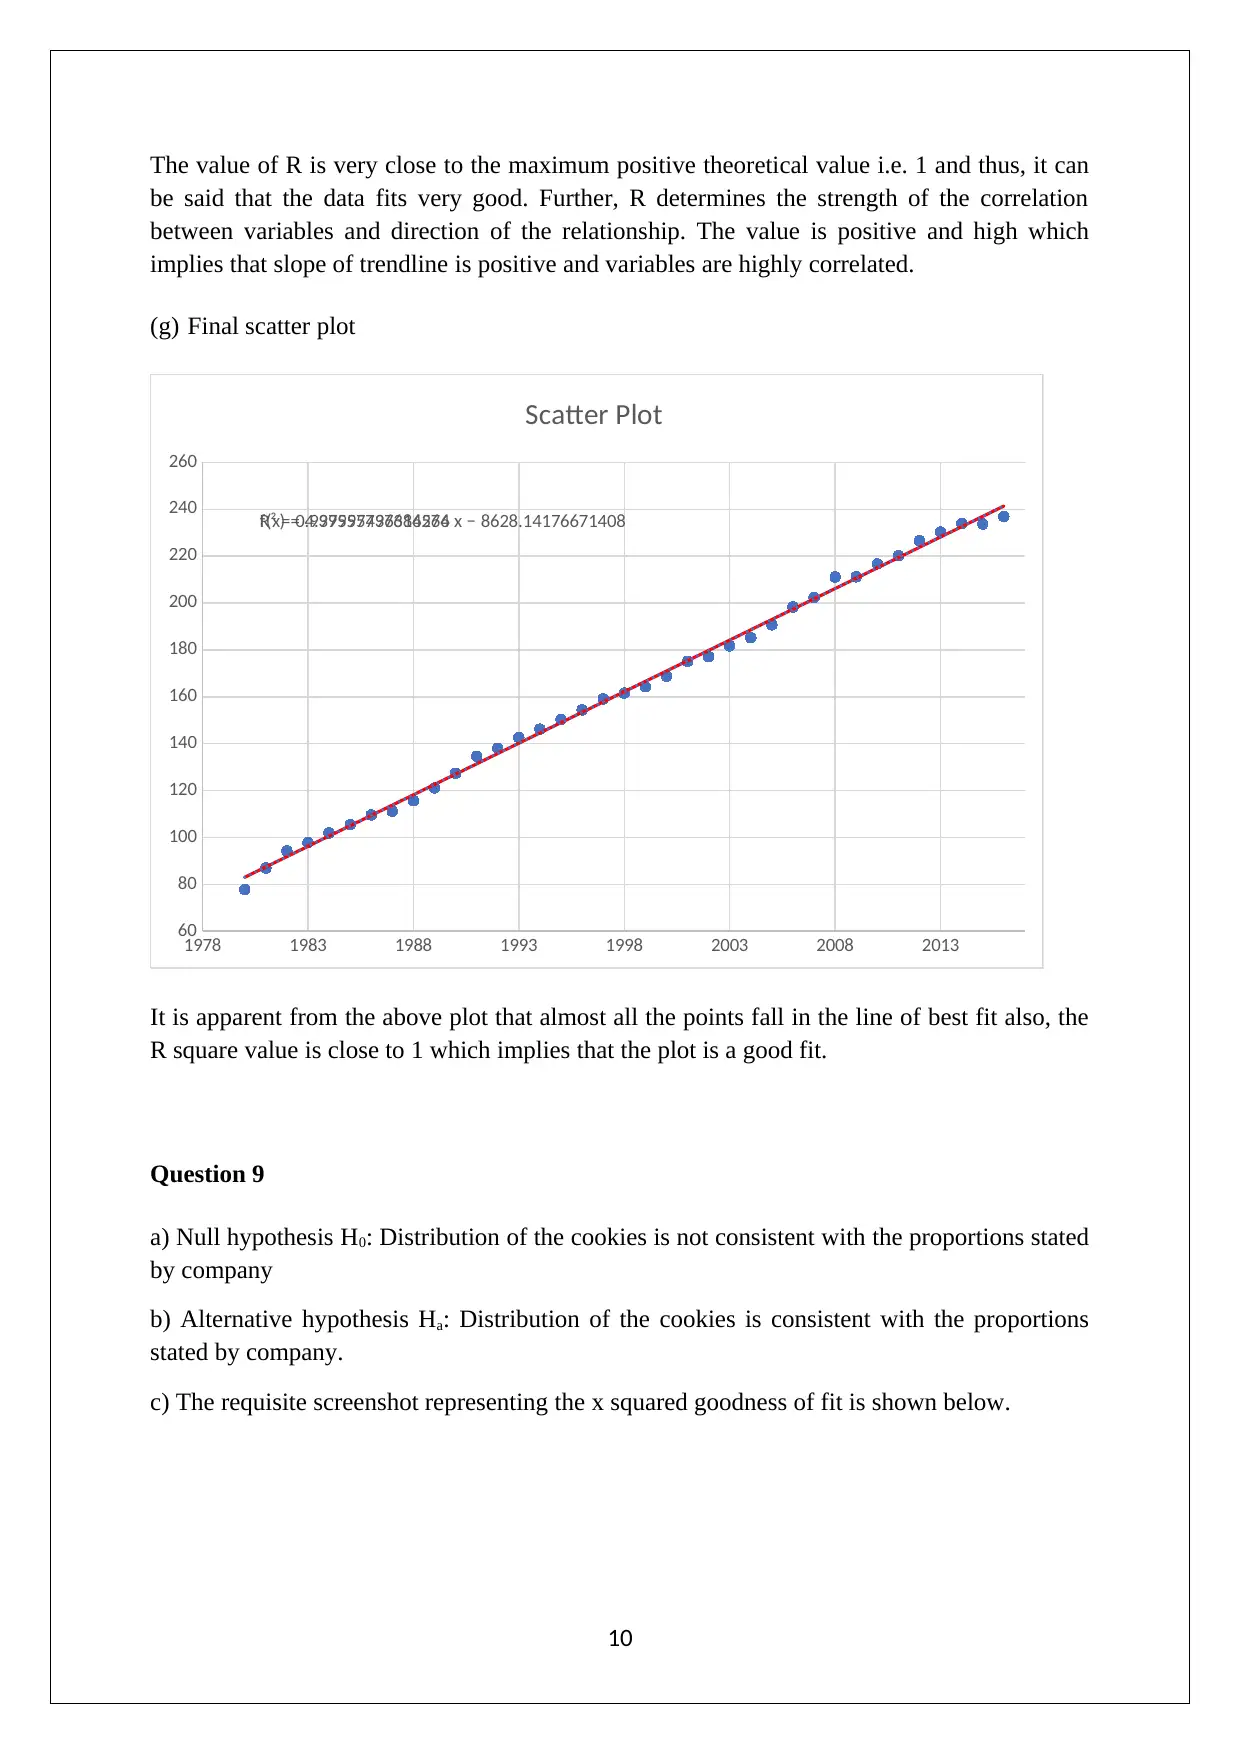
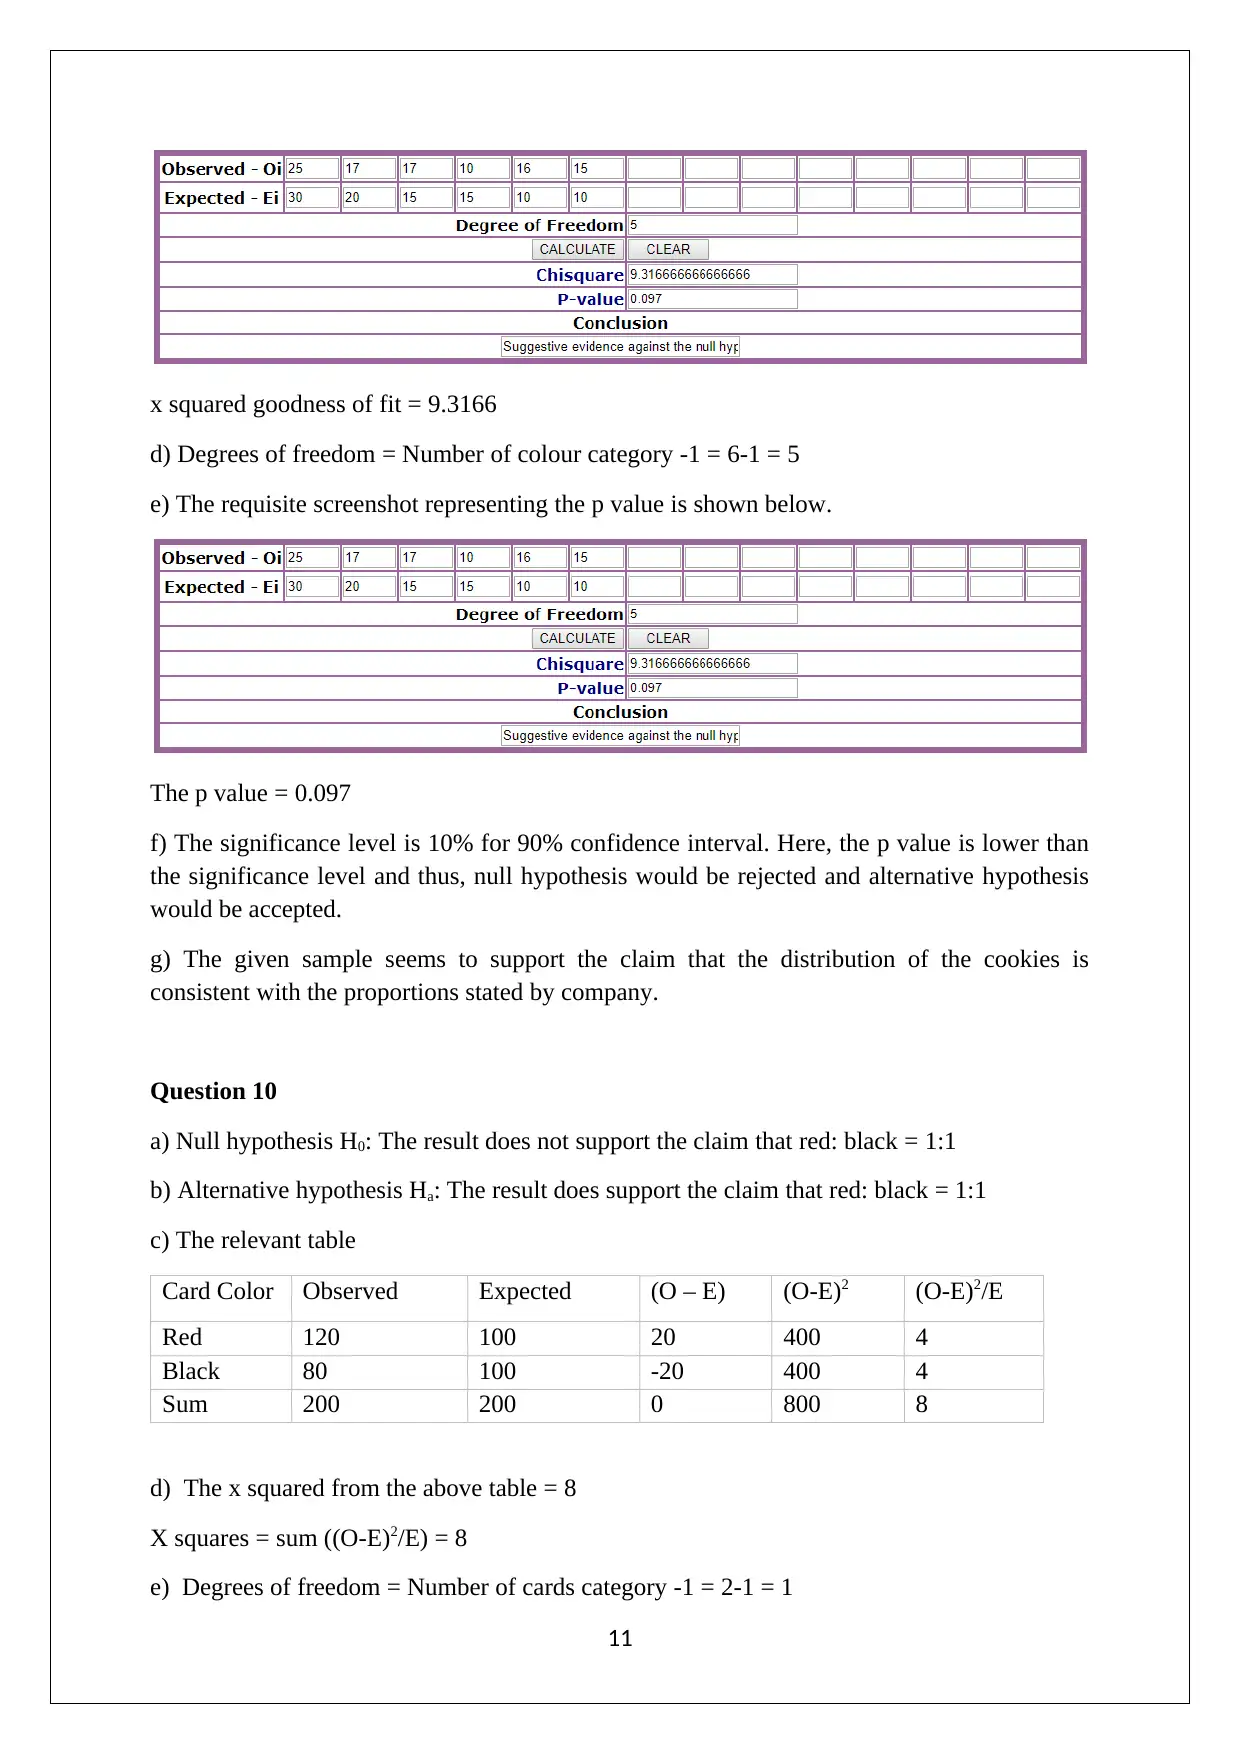
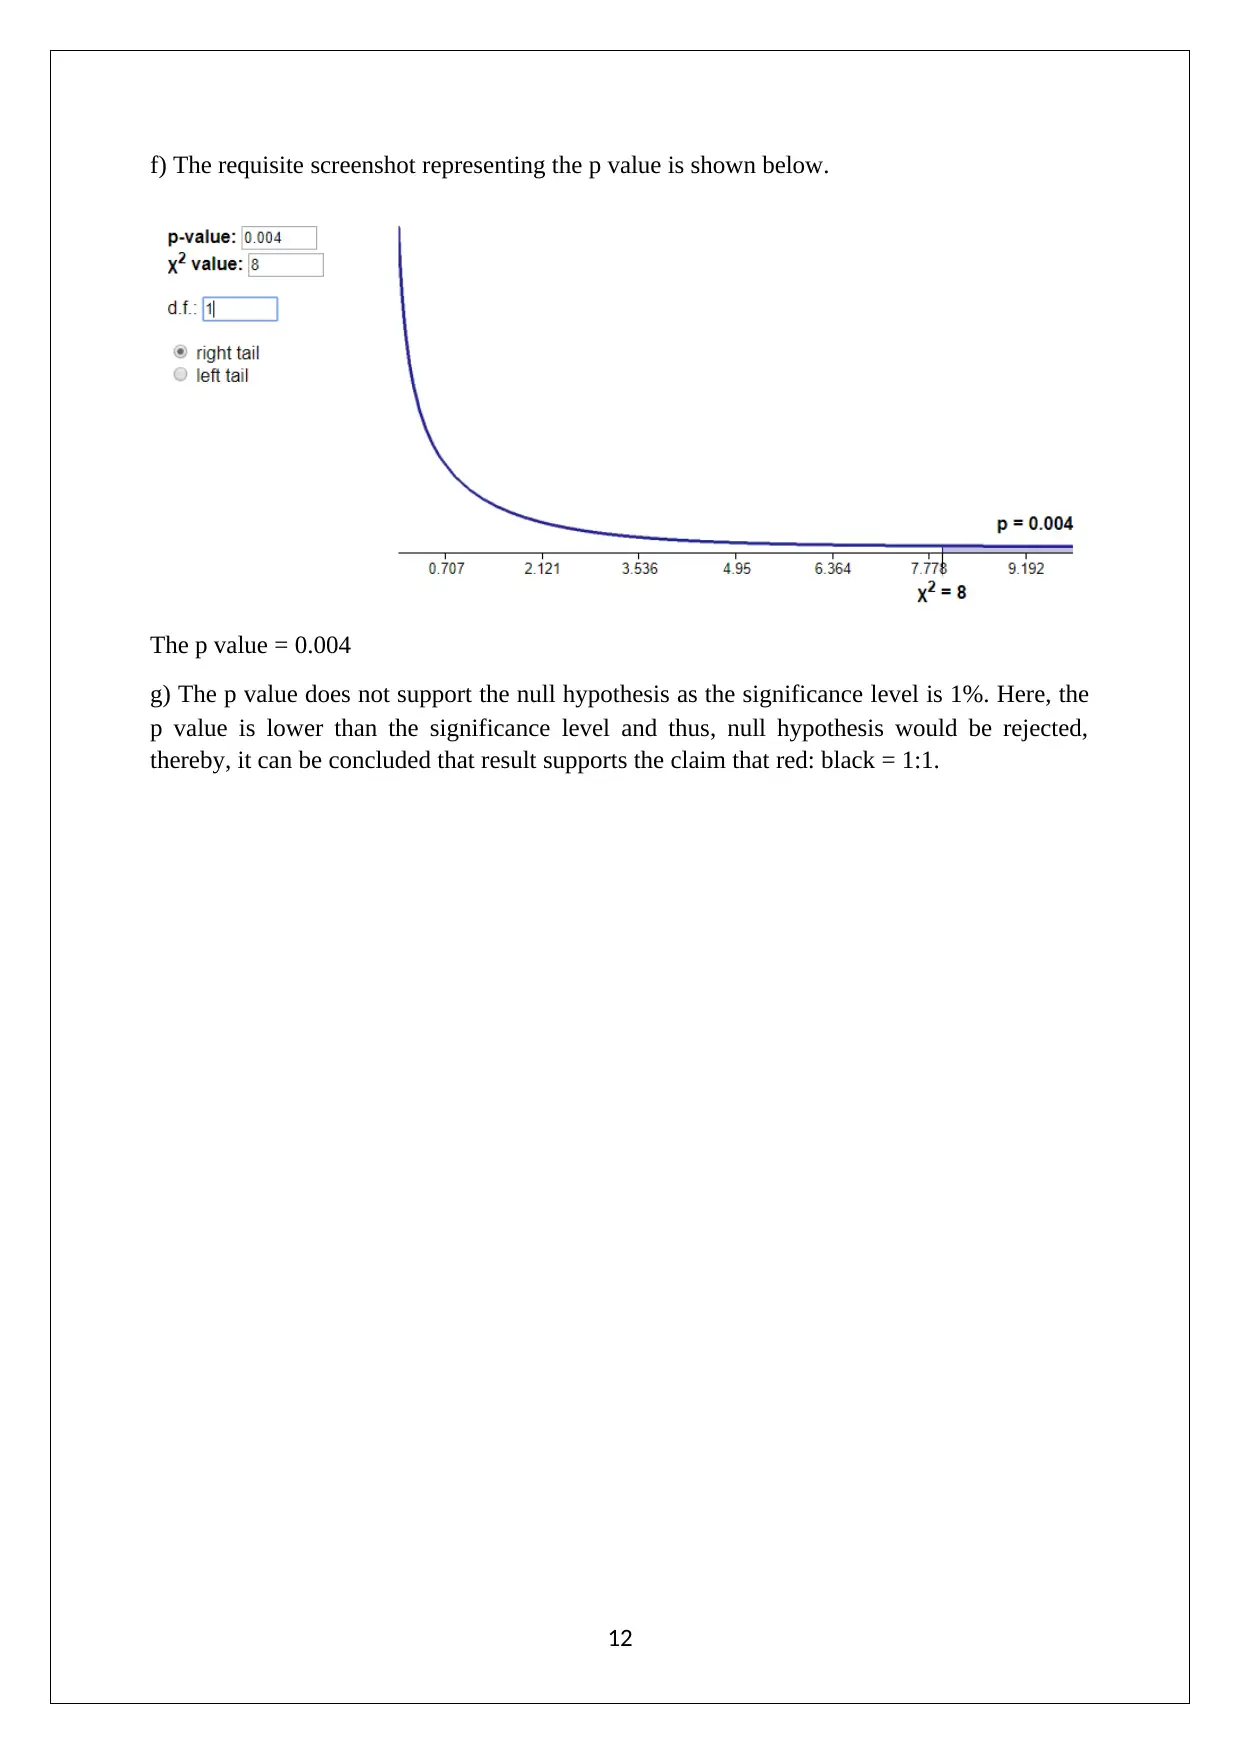
This document presents a detailed solution to a statistics assignment. The solution begins by defining and differentiating between the null and alternative hypotheses, followed by explanations of Type I and Type II errors, including significance and confidence levels. The assignment then delves into practical applications, including calculations of z-scores and probabilities related to truck weight distributions, assuming a normal distribution. Further, the solution demonstrates hypothesis testing using t-statistics, including calculations of p-values and interpretations based on confidence levels. The assignment concludes with the analysis of a dataset involving scatter plots, trendlines, and R-squared values, demonstrating the relationships between variables and goodness of fit. Finally, there's a chi-squared goodness-of-fit test and hypothesis testing for proportions, including calculations and interpretations.
tabler-icon-diamond-filled.svg

Contribute Materials

Your contribution can guide someone’s learning journey. Share your documents today.
Document Page
Question 1
(1) Null hypothesis in statistics represents the hypothesis that supports the claim related
to the non-existence of any significance regarding any observation or claim. It
constitutes the observations that have derived by chance and thus, there is no
significance deviation as compared with the hypothesized mean (population mean).
Null hypothesis is represented through symbol (H0). Null hypothesis assumed to be
true only unless the hypothesis test conducted and sufficient statistical evidence
present at a specified significance level to reject it.
(2) Alternative hypothesis in statistics refers to the hypothesis that supports the claim of
some observation or significant relationship between the variables. The research
claims are generally represented in alternative hypothesis only. When the hypothesis
test result provides sufficient evidence to accept the alternative hypothesis then it
would be said that the observation is not by chance. Alternative hypothesis
represented through symbol (Ha or H1) and would be true only when the null
hypothesis rejected.
(3) Type I errors implies the rejection of true null hypothesis. The probability of type I
error indicated by significance level represented as alpha. When the value of alpha is
lowest then the corresponding confidence level would be higher. The confidence level
would be found through (1- alpha). When the type I error (alpha) is significantly
lower than there would be higher confidence to reject the null hypothesis.
(4) Type II errors implies the scenario when of false null hypothesis would not be
rejected. The probability of type II error indicated by1- beta where the beta is the test
power. The type II error can be minimized by increasing the sample size because the
standard error would be reduced by increasing the sample size.
Standard error = 1
n
Question 5
Mean truck weights = 20,000 lbs
Standard deviation = 2000 lbs
Distribution approximates a bell curve which implies that the truck weight distribution
follows normal distribution.
(a) The maximum mileage of a car which is 80th percentile is computed through z table
calculation and is shown below.
1
tabler-icon-diamond-filled.svg

Secure Best Marks with AI Grader

Need help grading? Try our AI Grader for instant feedback on your assignments.
Document Page
(b) The z score for this mileage
zscore= xμ
σ
z score=21682.91320000
2000 =0.841
(c) Probability that a randomly selected truck’s weight would fall between 21000 and 22000
miles
2
Document Page
There is 0.1499 probability that a randomly selected truck’s weight would fall between 21000
and 22000 miles.
(d) Number of trucks = 16
Standard deviation of sample ¿ σ
n =2000
16 =500 miles
(e) Probability that a randomly selected truck’s weight would fall between 21000 and 22000
miles from a group of 16 trucks
3
Document Page
There is 0.0227 probability that a randomly selected truck’s weight would fall between 21000
and 22000 miles from a group of 16 trucks.
Question 6
a) Null hypothesis H0: μ = 10
b) Alternative hypothesis Ha: μ>10
c) Based on the sign of the alternative hypothesis, it can be said that the hypothesis test is a
right tailed hypothesis test.
d) Mean of sample (using Excel) x bar = 10.30
e) Standard deviation of sample (using Excel) s = 2.85
f) Sample size = 20
4
tabler-icon-diamond-filled.svg

Secure Best Marks with AI Grader

Need help grading? Try our AI Grader for instant feedback on your assignments.
Document Page
g) The sample size is lower than 30 and also, the population standard deviation is not given
and thus, it can be said based on central limit theorem that the distribution is not normal and
hence, t statistics would be used instead of z statistics.
h) The t statistic= x ¯μ
s
n
=10.3010
2.85
20
=0.471
i) Degree of freedom (dof) = Sample size -1 = 20-1 = 19
j) The p value for the t value and degree of freedom
k) The level of significance for 90% confidence level would be 10%.
As p value (0.322) > Level of significance (10%) and thus, the null hypothesis would not be
rejected.
l) The level of significance for 99% confidence level would be 1%.
As p value (0.322) > Level of significance (1%) and thus, the null hypothesis would not be
rejected.
.
Question 7
a) New series E (E = C-D) is summarised below.
5
Document Page
b) Null hypothesis H0: μC-D ≤ 0 i.e. diet did not cause weight loss
c) Alternative hypothesis Ha: μC-D> 0 i.e. diet did cause weight loss
d) Based on the sign of alternative hypothesis, it can be said that it is a right tailed
hypothesis test.
e) Mean of sample (using Excel) x bar = 2.083
f) Standard deviation of sample (using Excel) s= 3.029
g) Sample size n = 12.
h) Degree of freedom (dof) = Sample size -1 = 20-1 = 19
i) The t statistic= x ¯μ
s
n
=2.0830
3.029
20
=2.3826
j) The p value for the t value and degree of freedom is indicated below.
The right tailed p value = 0.018
6
Document Page
k) For 90% confidence level, the corresponding level of significance would be 10%. Since
the p value (0.018) is lower than the significance level (0.1) and hence, sufficient evidence is
present to reject the null hypothesis and to accept alternative hypothesis. It can be concluded
that there is a systematic different in the weight changes between the start and stop time of
the diet.
Question 8
(a) Scatter Plot
1975 1980 1985 1990 1995 2000 2005 2010 2015 2020
0
50
100
150
200
250
Scatter Plot
(b) The scatter plot after adjusting the axis values
7
tabler-icon-diamond-filled.svg

Paraphrase This Document

Need a fresh take? Get an instant paraphrase of this document with our AI Paraphraser
Document Page
1978 1983 1988 1993 1998 2003 2008 2013
60
80
100
120
140
160
180
200
220
240
260
Scatter Plot
(c) Scatter plot with trendline
1978 1983 1988 1993 1998 2003 2008 2013
60
80
100
120
140
160
180
200
220
240
260
Scatter Plot
(d) Scatter plot with equation of trendline
8
Document Page
1978 1983 1988 1993 1998 2003 2008 2013
60
80
100
120
140
160
180
200
220
240
260
f(x) = 4.39955737316264 x − 8628.14176671408
Scatter Plot
(e) Scatter plot with R square value
1978 1983 1988 1993 1998 2003 2008 2013
60
80
100
120
140
160
180
200
220
240
260
f(x) = 4.39955737316264 x − 8628.14176671408
Scatter Plot
(f) The value of R square comes out to be positive = + 0.9976
The R value = Sqrt (+0.9976) = 0.9987
9
Document Page
The value of R is very close to the maximum positive theoretical value i.e. 1 and thus, it can
be said that the data fits very good. Further, R determines the strength of the correlation
between variables and direction of the relationship. The value is positive and high which
implies that slope of trendline is positive and variables are highly correlated.
(g) Final scatter plot
1978 1983 1988 1993 1998 2003 2008 2013
60
80
100
120
140
160
180
200
220
240
260
f(x) = 4.39955737316264 x − 8628.14176671408R² = 0.997597496684576
Scatter Plot
It is apparent from the above plot that almost all the points fall in the line of best fit also, the
R square value is close to 1 which implies that the plot is a good fit.
Question 9
a) Null hypothesis H0: Distribution of the cookies is not consistent with the proportions stated
by company
b) Alternative hypothesis Ha: Distribution of the cookies is consistent with the proportions
stated by company.
c) The requisite screenshot representing the x squared goodness of fit is shown below.
10
tabler-icon-diamond-filled.svg

Secure Best Marks with AI Grader

Need help grading? Try our AI Grader for instant feedback on your assignments.
Document Page
x squared goodness of fit = 9.3166
d) Degrees of freedom = Number of colour category -1 = 6-1 = 5
e) The requisite screenshot representing the p value is shown below.
The p value = 0.097
f) The significance level is 10% for 90% confidence interval. Here, the p value is lower than
the significance level and thus, null hypothesis would be rejected and alternative hypothesis
would be accepted.
g) The given sample seems to support the claim that the distribution of the cookies is
consistent with the proportions stated by company.
Question 10
a) Null hypothesis H0: The result does not support the claim that red: black = 1:1
b) Alternative hypothesis Ha: The result does support the claim that red: black = 1:1
c) The relevant table
Card Color Observed Expected (O – E) (O-E)2 (O-E)2/E
Red 120 100 20 400 4
Black 80 100 -20 400 4
Sum 200 200 0 800 8
d) The x squared from the above table = 8
X squares = sum ((O-E)2/E) = 8
e) Degrees of freedom = Number of cards category -1 = 2-1 = 1
11
Document Page
f) The requisite screenshot representing the p value is shown below.
The p value = 0.004
g) The p value does not support the null hypothesis as the significance level is 1%. Here, the
p value is lower than the significance level and thus, null hypothesis would be rejected,
thereby, it can be concluded that result supports the claim that red: black = 1:1.
12
chevron_up_icon
1 out of 12
circle_padding
hide_on_mobile
zoom_out_icon
logo.png

Your All-in-One AI-Powered Toolkit for Academic Success.

Available 24*7 on WhatsApp / Email

[object Object]