Statistics Assignment - Data Analysis, Hypothesis, and CI

Verified

Added on  2022/07/28

|9
|1072
|37
Homework Assignment
AI Summary
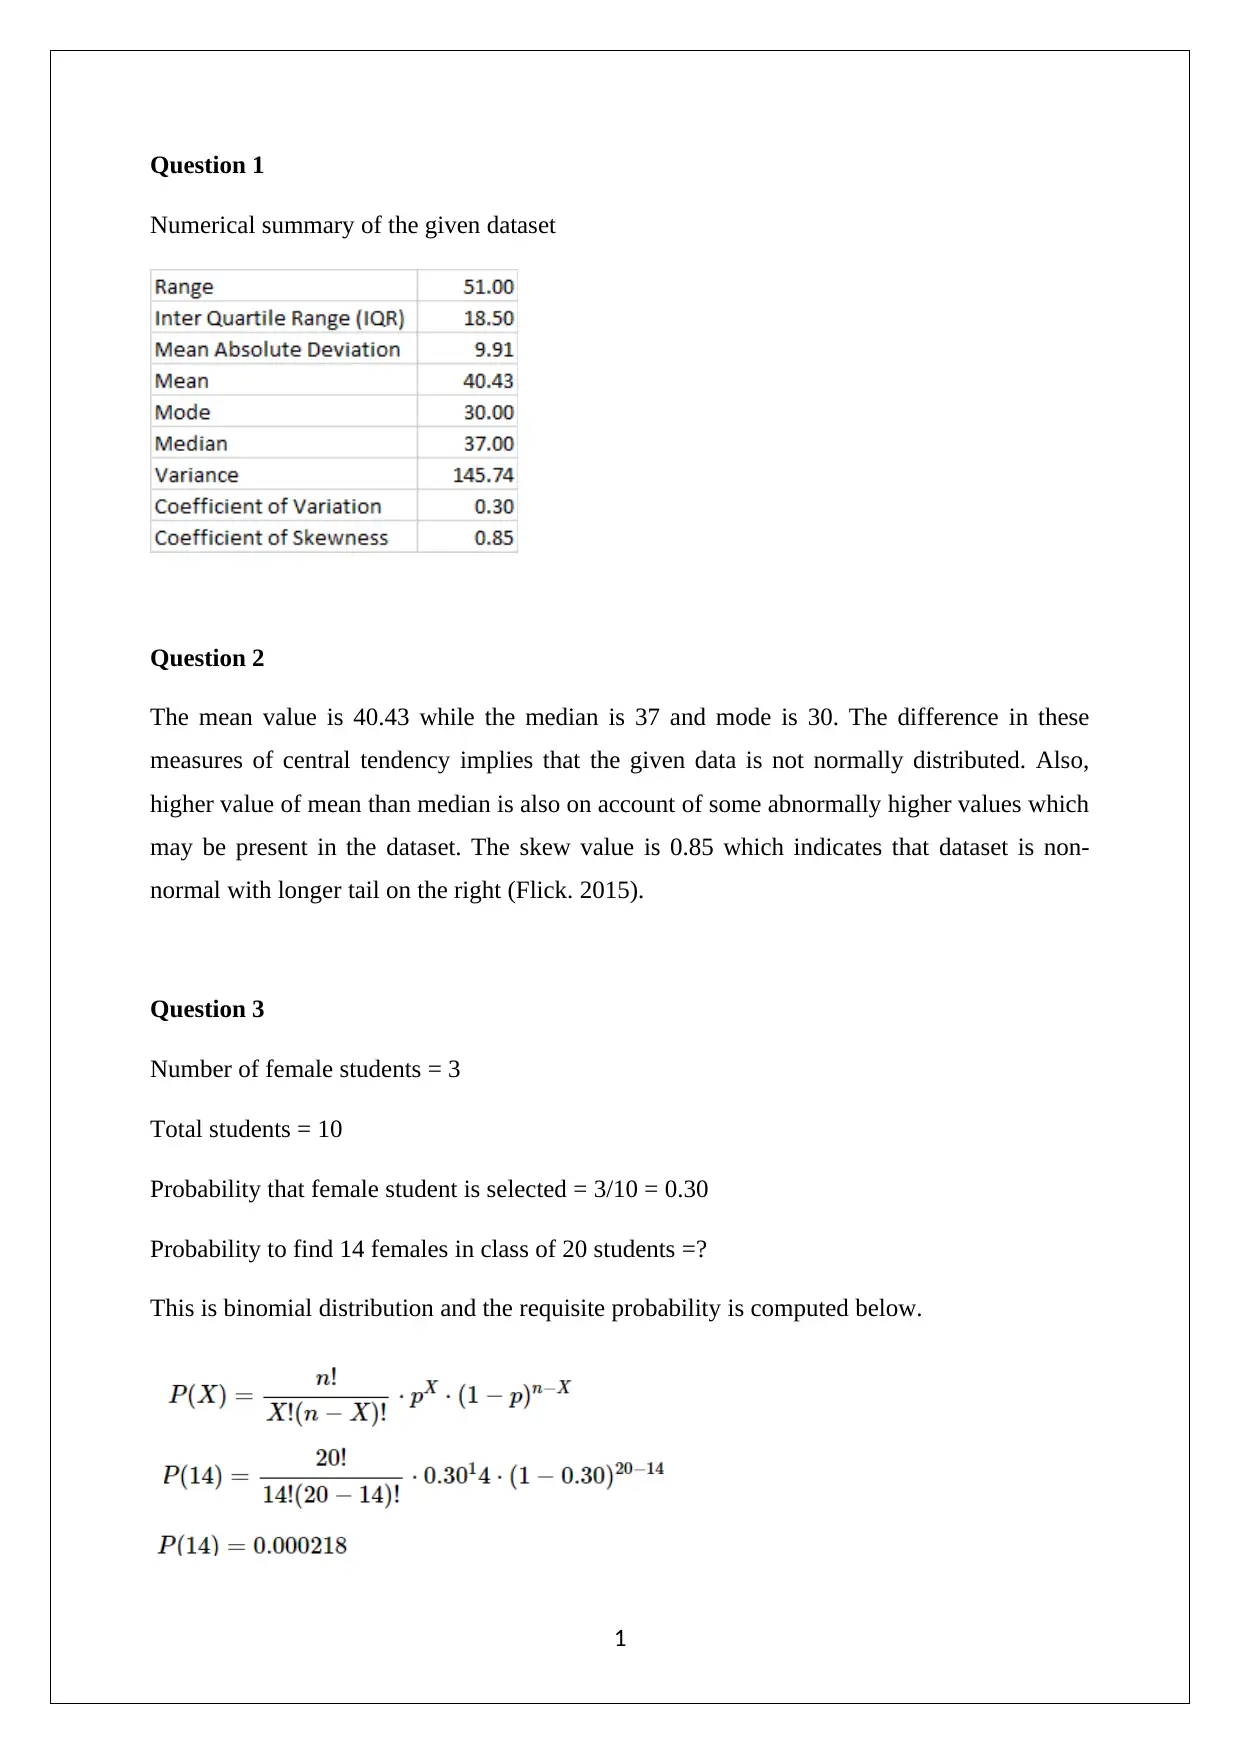
This document presents a comprehensive solution to a statistics assignment, addressing key concepts and methodologies. The solution begins with a numerical summary of a given dataset, including calculations of mean, median, mode, and skewness to assess data distribution. It then explores probability using the binomial distribution, calculating the probability of selecting female students. The assignment proceeds to analyze normal distributions and calculate probabilities associated with IQ scores, incorporating standard deviation and the concept of sampling errors. The solution also differentiates between sampling and non-sampling errors, providing examples and corrective actions for each. Hypothesis testing is demonstrated using a two-sample independent t-test, with interpretation of results and implications for different sample sizes. Finally, the assignment concludes with the calculation of confidence intervals for the mean IQ, considering varying sample sizes and explaining the impact on interval width. The solution references key statistical concepts and provides detailed explanations to aid in understanding. The assignment is a valuable resource for students looking to improve their understanding of statistical principles and problem-solving skills.
Document Page
STATISTICS
[Document subtitle]
[DATE]
tabler-icon-diamond-filled.svg

Paraphrase This Document

Need a fresh take? Get an instant paraphrase of this document with our AI Paraphraser
Document Page
Question 1
Numerical summary of the given dataset
Question 2
The mean value is 40.43 while the median is 37 and mode is 30. The difference in these
measures of central tendency implies that the given data is not normally distributed. Also,
higher value of mean than median is also on account of some abnormally higher values which
may be present in the dataset. The skew value is 0.85 which indicates that dataset is non-
normal with longer tail on the right (Flick. 2015).
Question 3
Number of female students = 3
Total students = 10
Probability that female student is selected = 3/10 = 0.30
Probability to find 14 females in class of 20 students =?
This is binomial distribution and the requisite probability is computed below.
1
Document Page
Question 4
Average IQ = 100
Standard deviation = 15
Normal distribution
Probability (X <= 100)
Probability (X <= 115)
2
Document Page
Probability (85<X<115)
Probability (X > 124)
3
tabler-icon-diamond-filled.svg

Paraphrase This Document

Need a fresh take? Get an instant paraphrase of this document with our AI Paraphraser
Document Page
Question 4
Three examples of sampling errors along with corrective action are given below (Hillier,
2016).
Simple random sampling technique is used where the underlying population is
heterogeneous owing to which the attributes representation is essential. In order to rectify,
check whether sample is representative of population of interest.
Selection of smaller sample size than required. This may result in loss of reliability since
the underlying sample would not be representative of the underlying population. In order
to rectify, it is imperative to use atleast minimum sample size.
Use of non-probabilistic sampling techniques – If the non-probability based techniques
such as convenience sampling is used, then there is inherent bias in the sample owing to
which result reliability is low. The researcher should therefore try to use probability based
sampling techniques.
4
Document Page
Three examples of non-sampling errors along with corrective action are given below
(Eriksson and Kovalainen, 2015).
Selection error – This may take place since in a survey only those who are interested in
taking the survey are represented. In order to reduce this error, it is imperative to enhance
the overall participation levels.
Non-response error – It is likely that the actual sample of people whose data is collected
may be different from those originally chosen for the data. This may happen since a
sizable chunk does not participate in the survey. Follow up surveys may be done in order
to reduce this.
Sample frame error – This happens when a wrong sub-population is used for extracting
sample owing to which the results obtained lack validity. In order to avoid this, it is
imperative to cross check is appropriate sample frame has been selected considering the
underlying study.
Question 5
The requisite hypotheses are as stated below.
Null Hypothesis: μ1 = μ2 i.e. there is no significant difference between the average wages of
the two managers with 1 being advertising.
Alternative Hypothesis: μ1 ≠ μ2 i.e. there is significant difference between the average wages
of the two managers with 1 being advertising.
Level of significance = 0.05
The appropriate test to be conducted is two sample independent t test. Based on the variance
for the two groups, the unequal variance form is preferred. The result from Excel is shown
below.
5
Document Page
Based on the above result, relevant two tail p value is 0.02 which is lower than 0.05 level of
significance. Hence, reject null hypothesis and alternative hypothesis is accepted (Hair et. al.,
2015). This implies that there is significant difference in wages of the two groups of
managers.
Even if the sample size is reduced to 33 managers each, then also the same test would be used
since the two samples would continue to be independent only and thus two sample
independent t test would be the correct choice.
Question 6
Sample size = 25
Mean IQ = 80
Standard deviation of IQ = 10
95% Confidence interval =?
Degree of freedom = 25-1 = 24
The t value for 95% Confidence interval and 24dof = 2.0639
Standard error = Standard deviation / SQRT(Sample size) = 10/ SQRT(25) = 2
Margin of error = z value * Standard error = 2.0639*2 = 4.1278
6
tabler-icon-diamond-filled.svg

Paraphrase This Document

Need a fresh take? Get an instant paraphrase of this document with our AI Paraphraser
Document Page
Upper limit of 95% CI= Mean + Margin of error=80+4.1278=84.13
Lower limit of 95% CI= Mean - Margin of error=80-4.1278=75.87
Hence,
95% Confidence interval = [75.87 84.13]
The conclusion can be made with 95% confidence that the mean IQ will be between 75.87
and 84.13.
When sample size = 49
Degree of freedom = 49-1 = 48
The t value for 95% Confidence interval and 24dof = 2.0106
Standard error = Standard deviation / SQRT(Sample size) = 10/ SQRT(49) = 1.4286
Margin of error = z value * Standard error = 2.0106*1.4286= 2.8723
Upper limit of 95% CI= Mean + Margin of error=80+2.8723=82.87
Lower limit of 95% CI= Mean - Margin of error=80-2.8723=77.13
Hence,
95% Confidence interval = [77.13 82.87]
The conclusion can be made with 95% confidence that the mean IQ will be between 77.13
and 82.87 when the sample size is 49. Clearly, in comparison with the confidence interval
before, the current confidence interval is narrower.
7
Document Page
References
Eriksson, P. and Kovalainen, A. (2015) Quantitative methods in business research. 3rd ed.
London: Sage Publications.
Flick, U. (2015) Introducing research methodology: A beginner's guide to doing a research
project. 4th ed. New York: Sage Publications.
Hair, J. F., Wolfinbarger, M., Money, A. H., Samouel, P., and Page, M. J. (2015) Essentials
of business research methods. 2nd ed. New York: Routledge.
Hillier, F. (2016) Introduction to Operations Research.6th ed. New York: McGraw Hill
Publications.
8
chevron_up_icon
1 out of 9
circle_padding
hide_on_mobile
zoom_out_icon
[object Object]