Statistics Homework Assignment

Verified

Added on  2020/03/23

|10
|318
|119
Homework Assignment
AI Summary
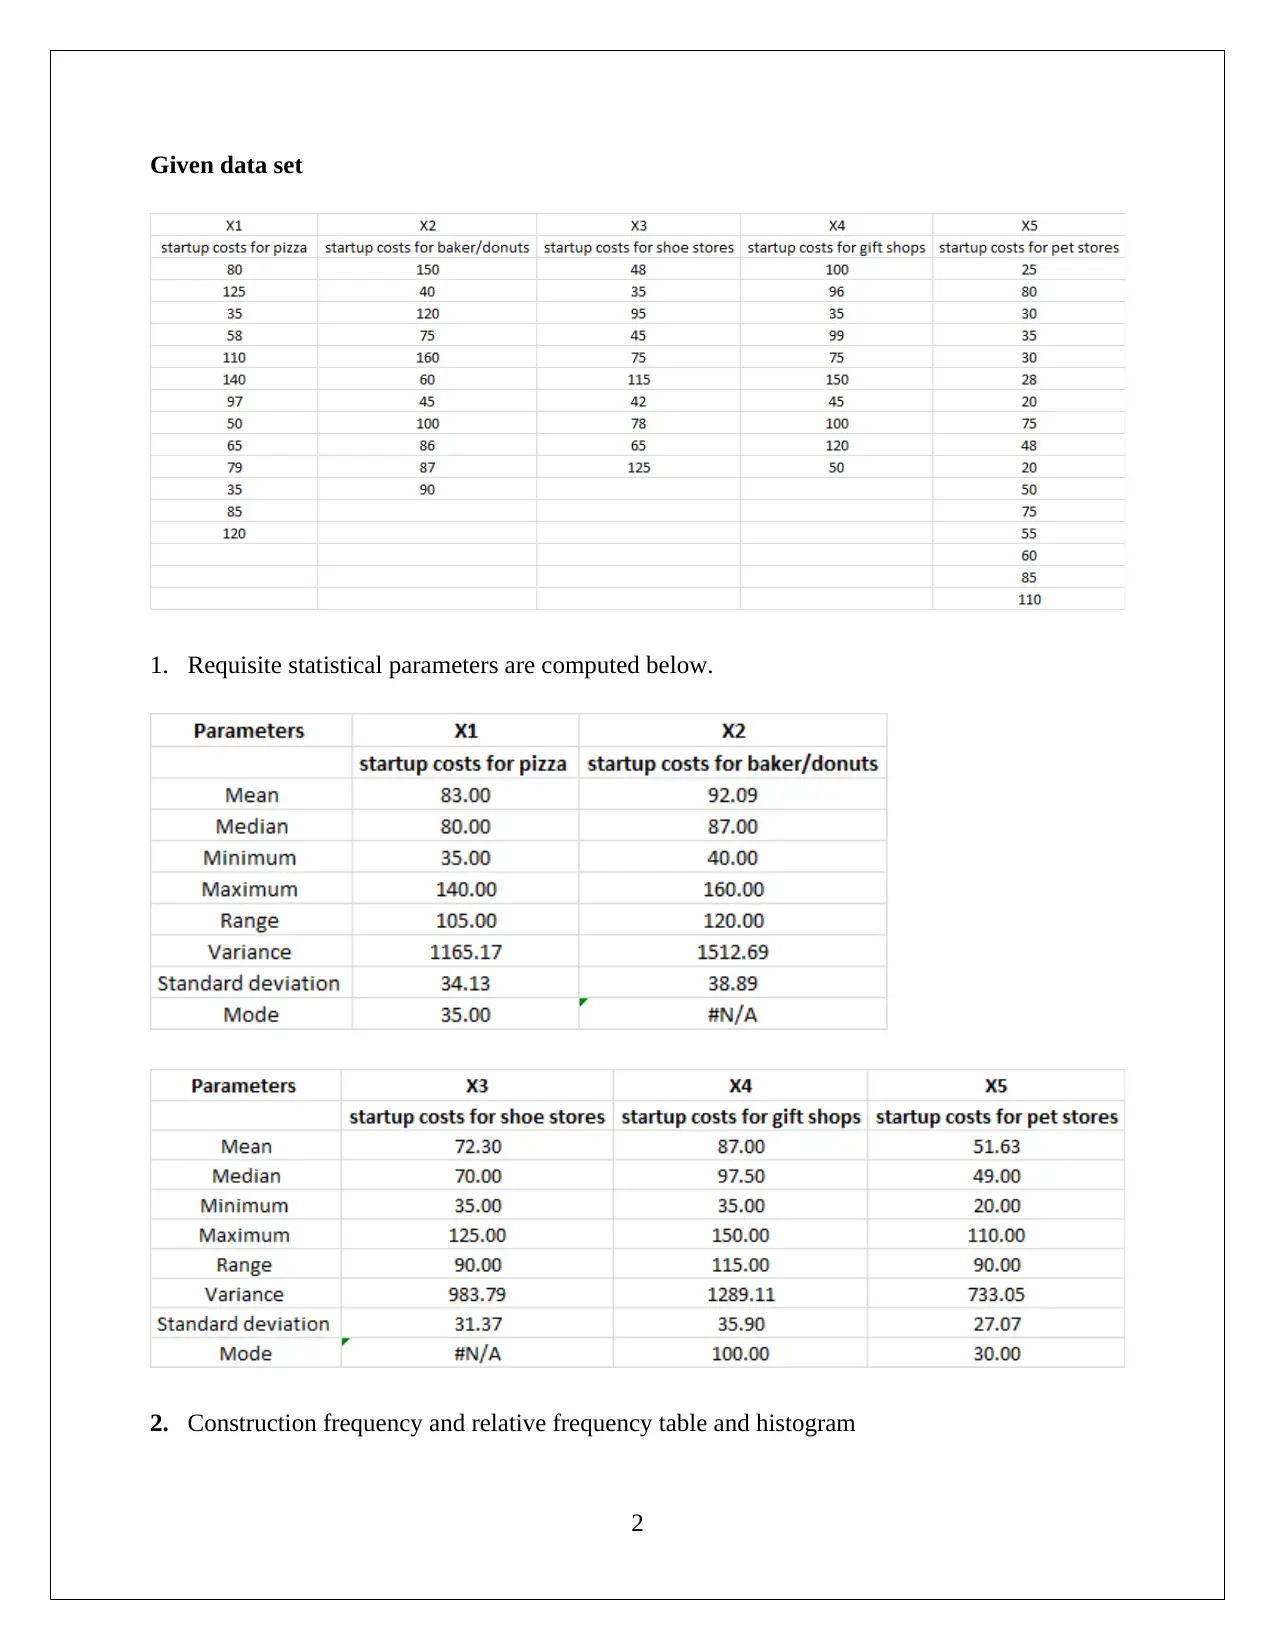
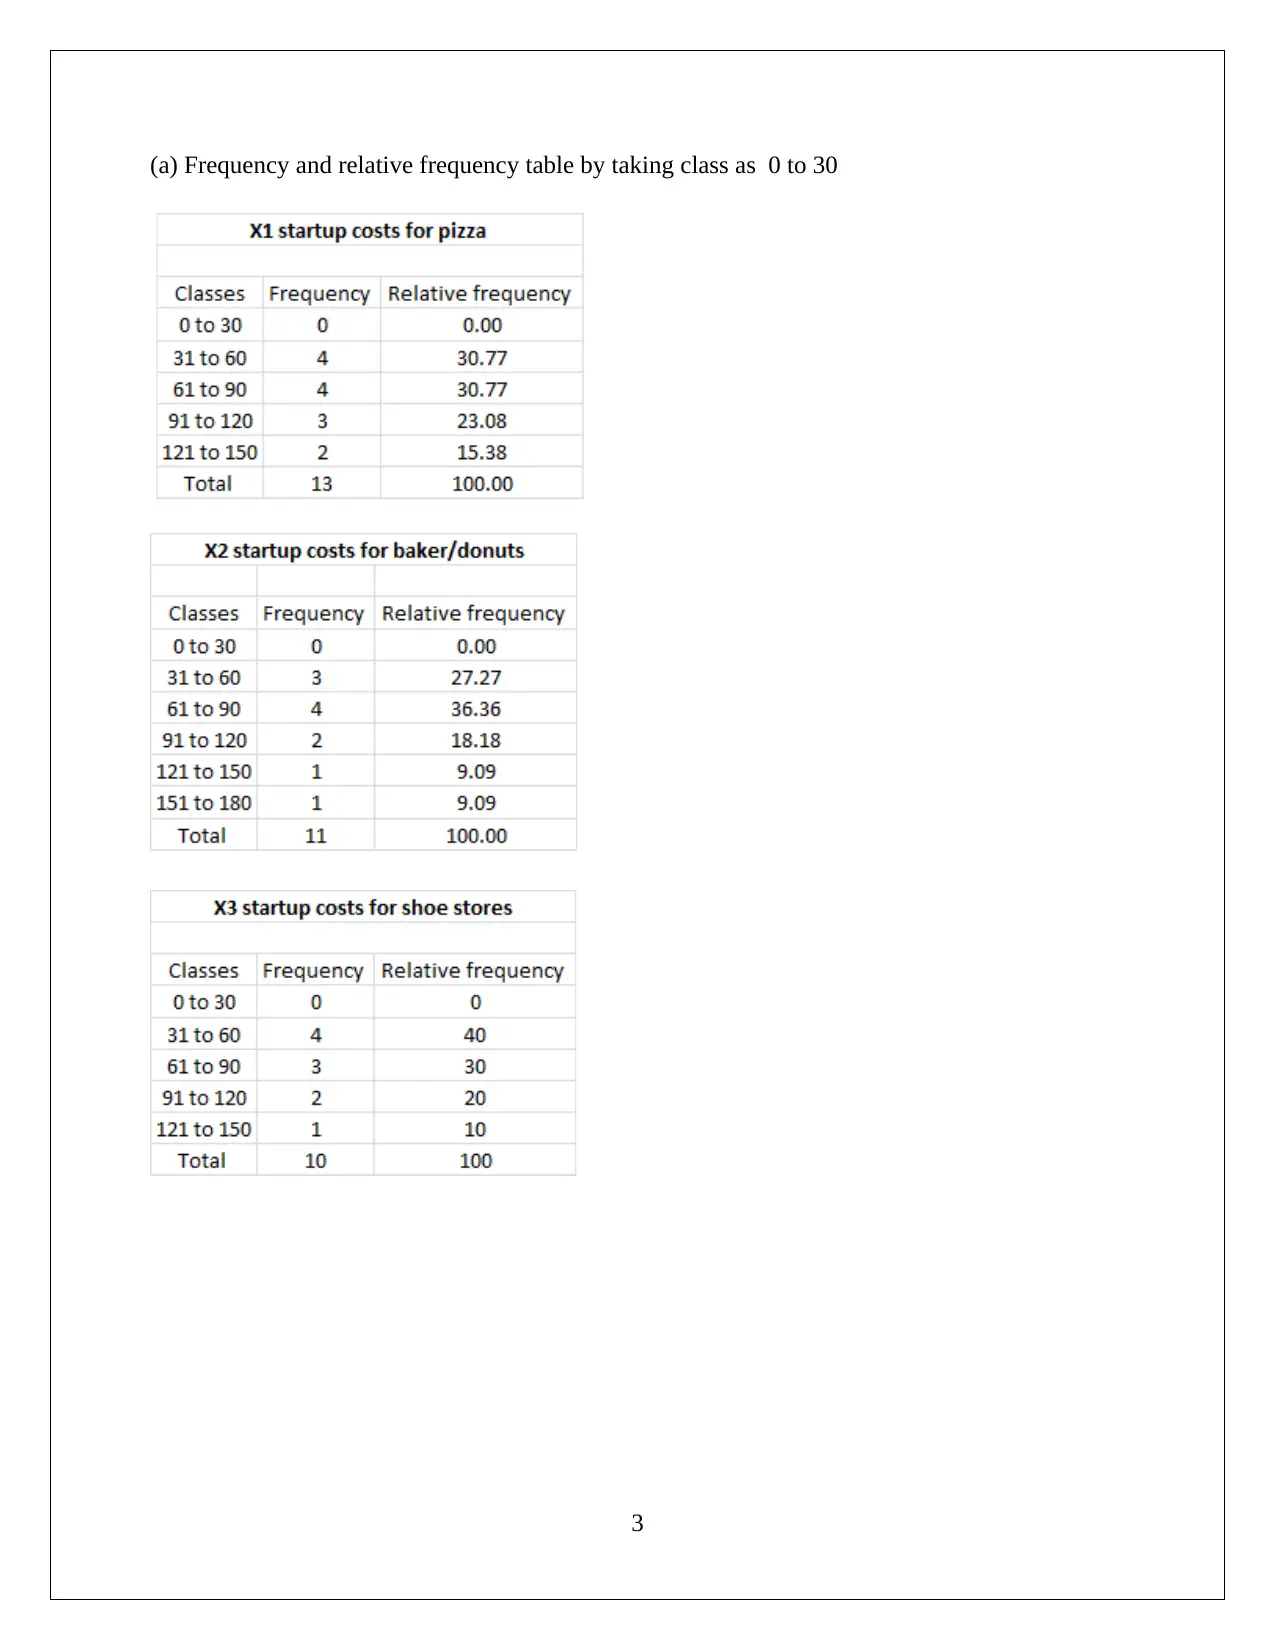
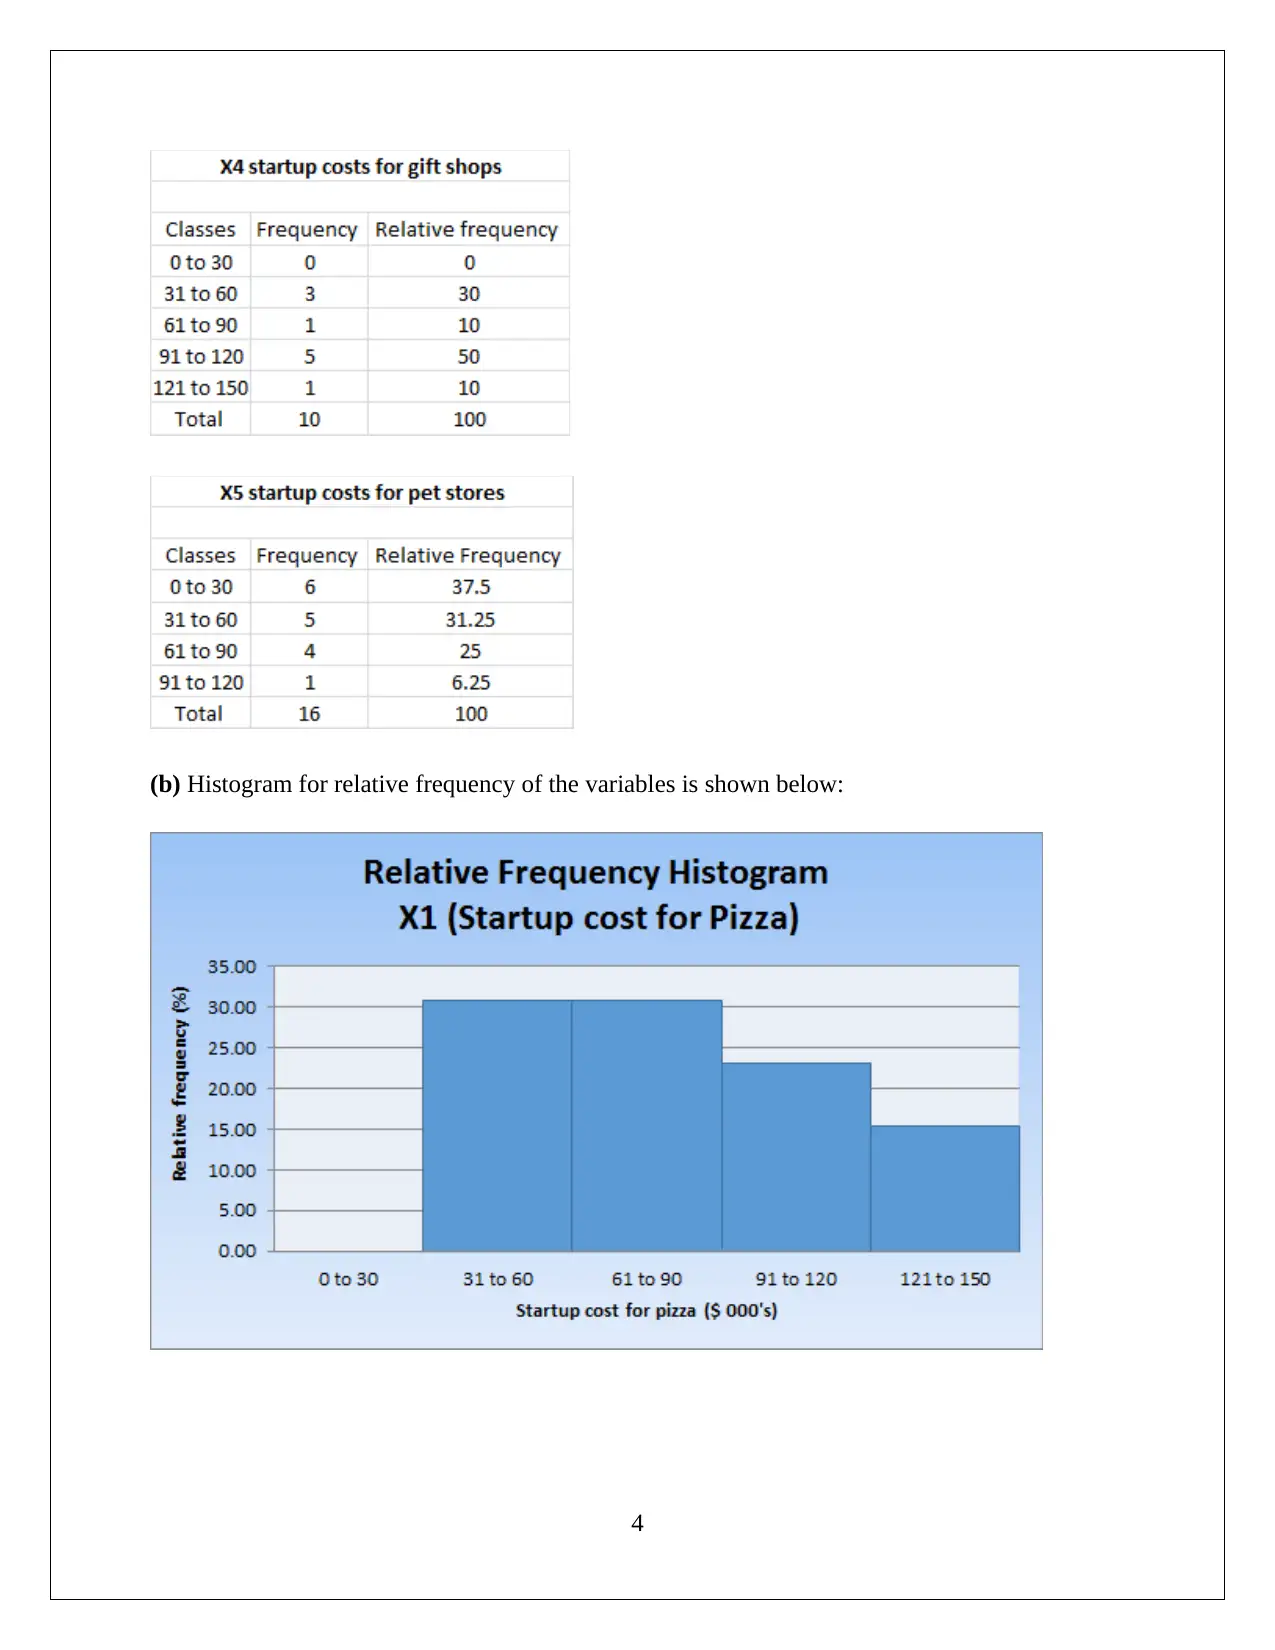
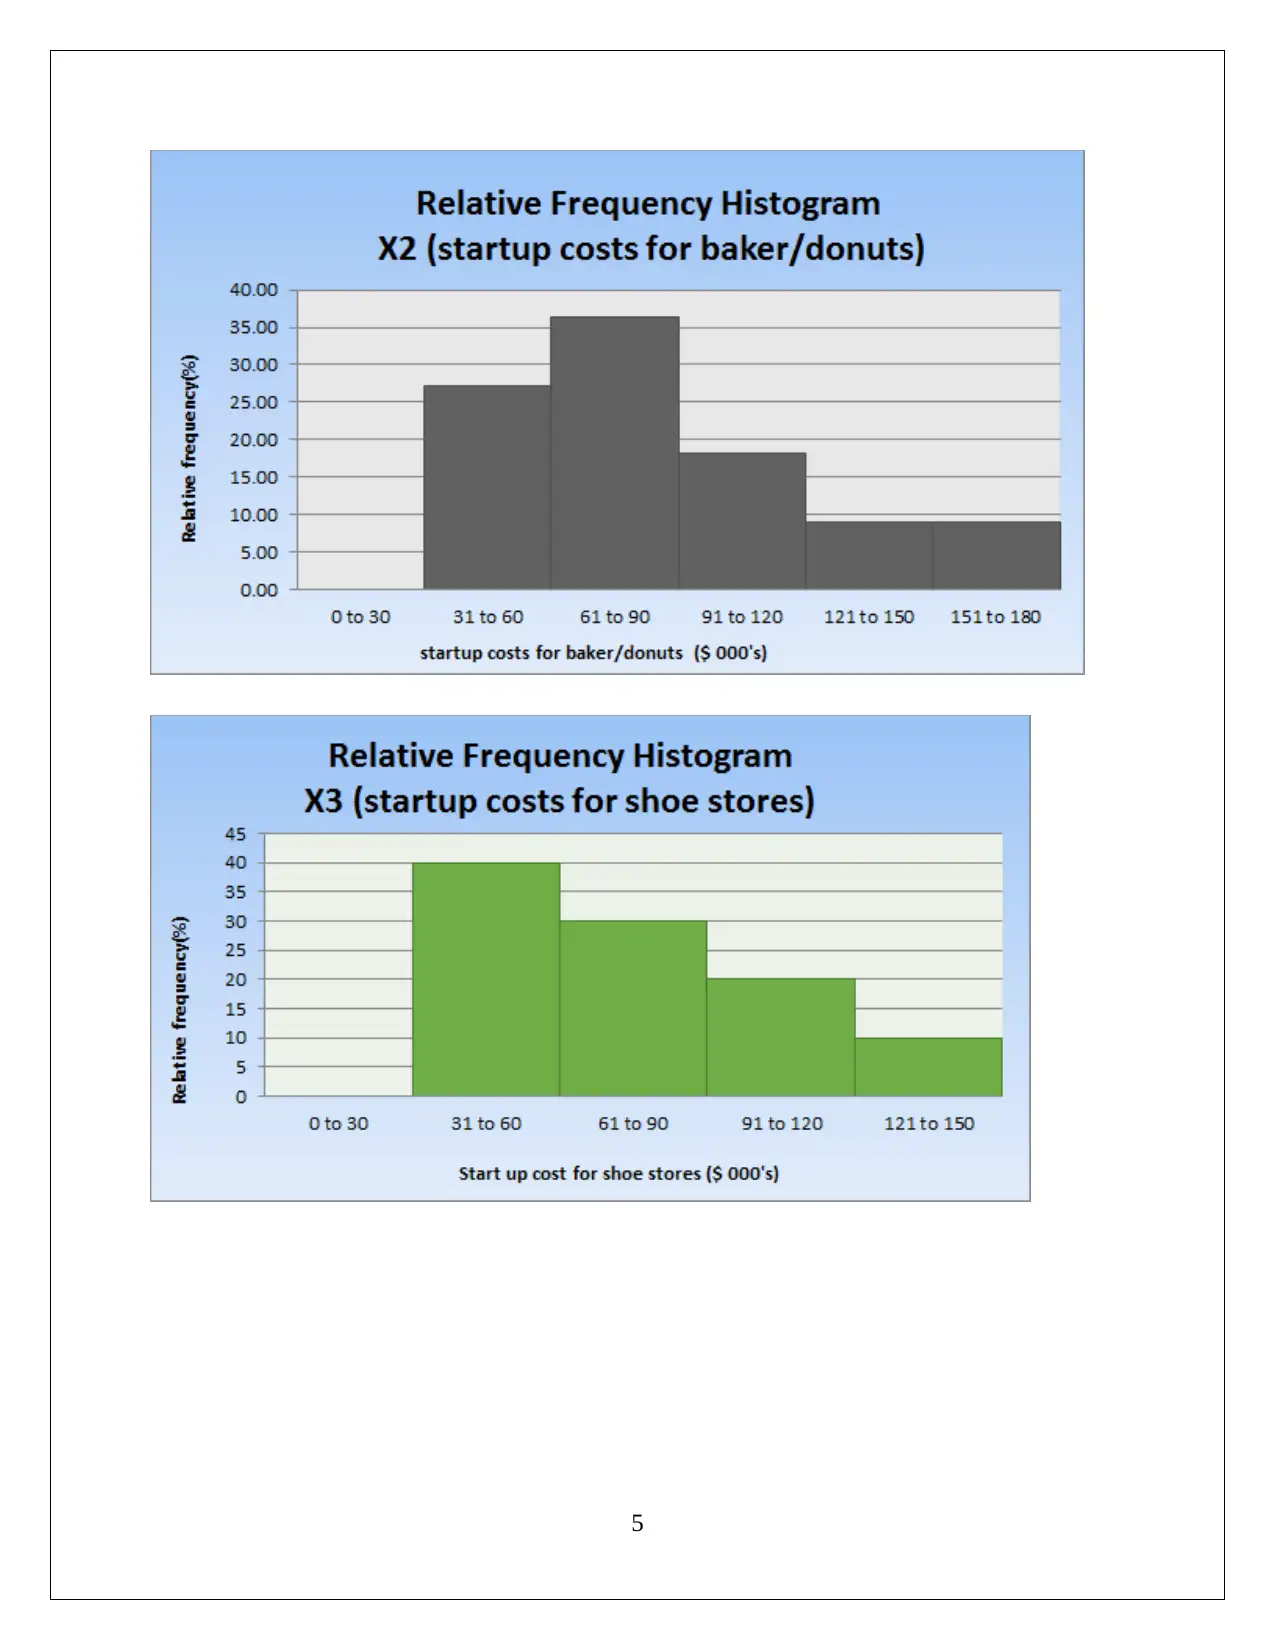
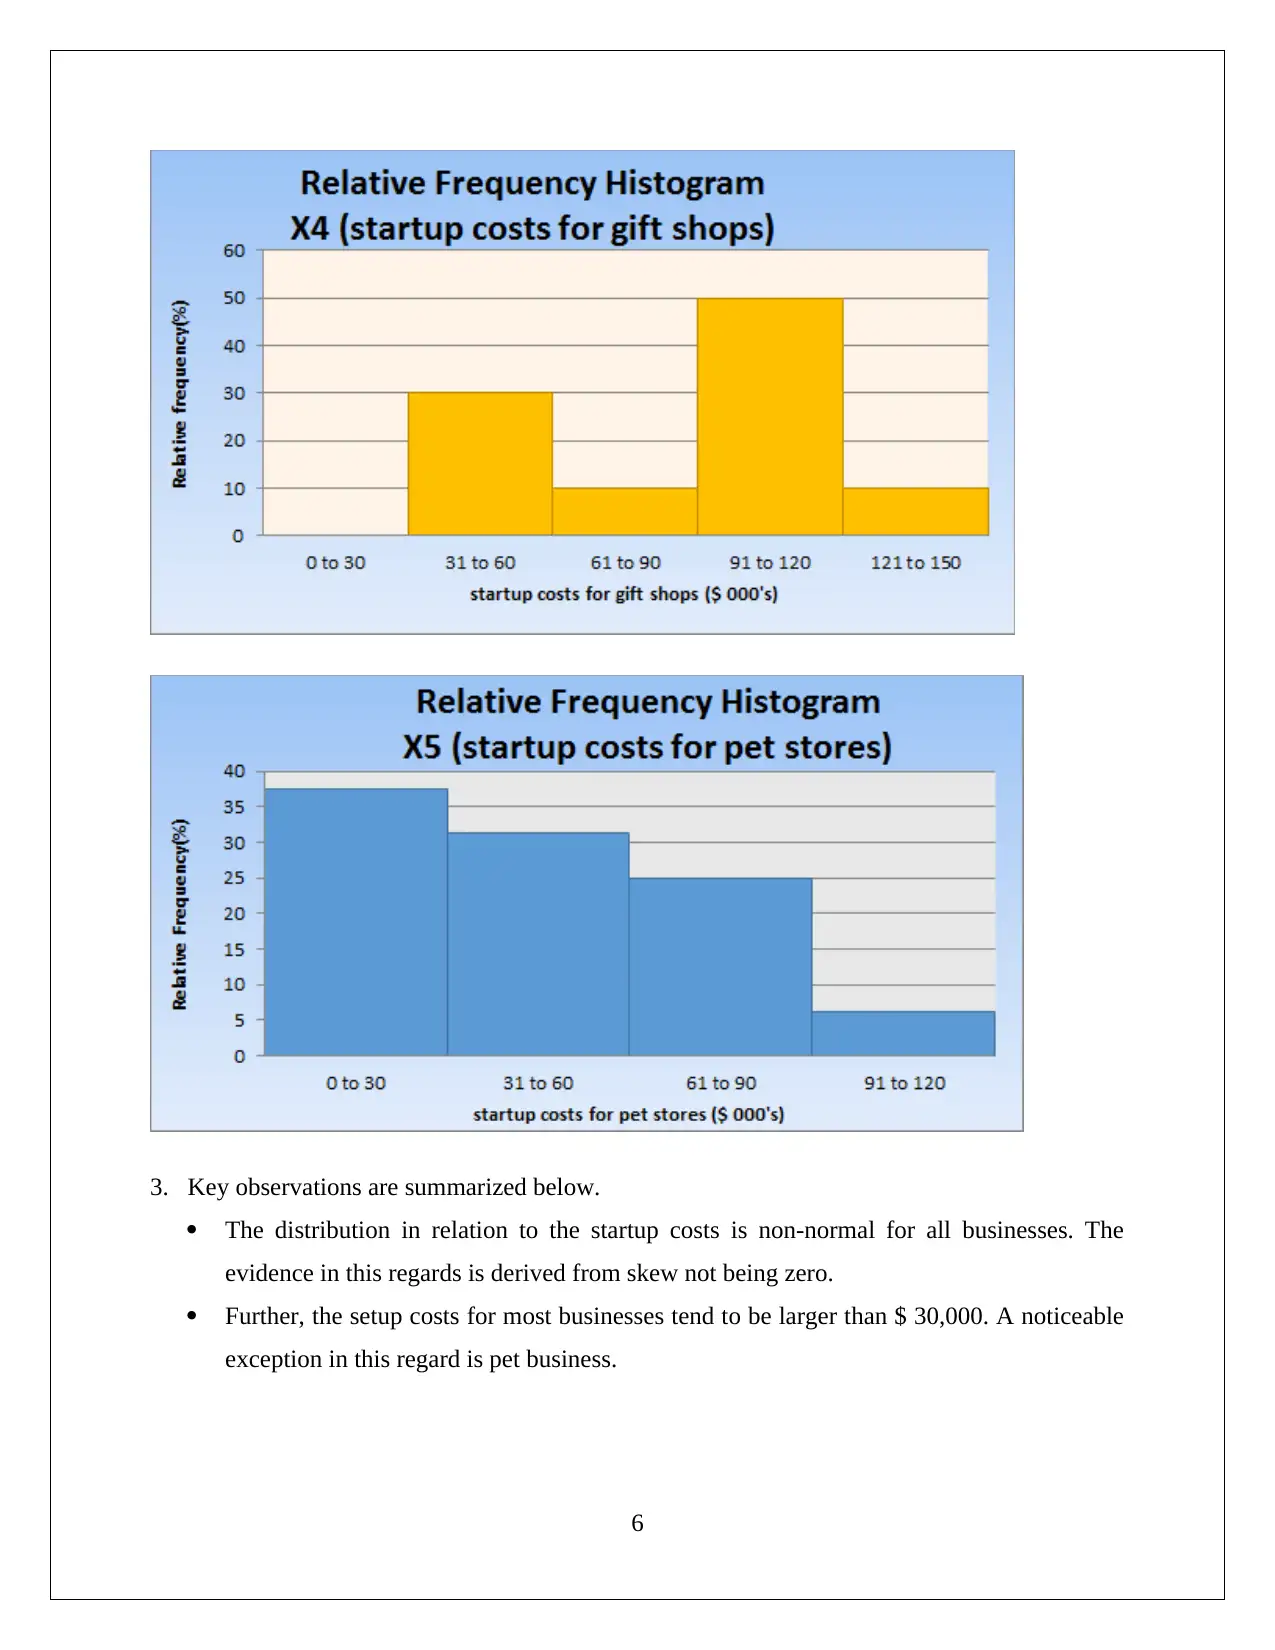
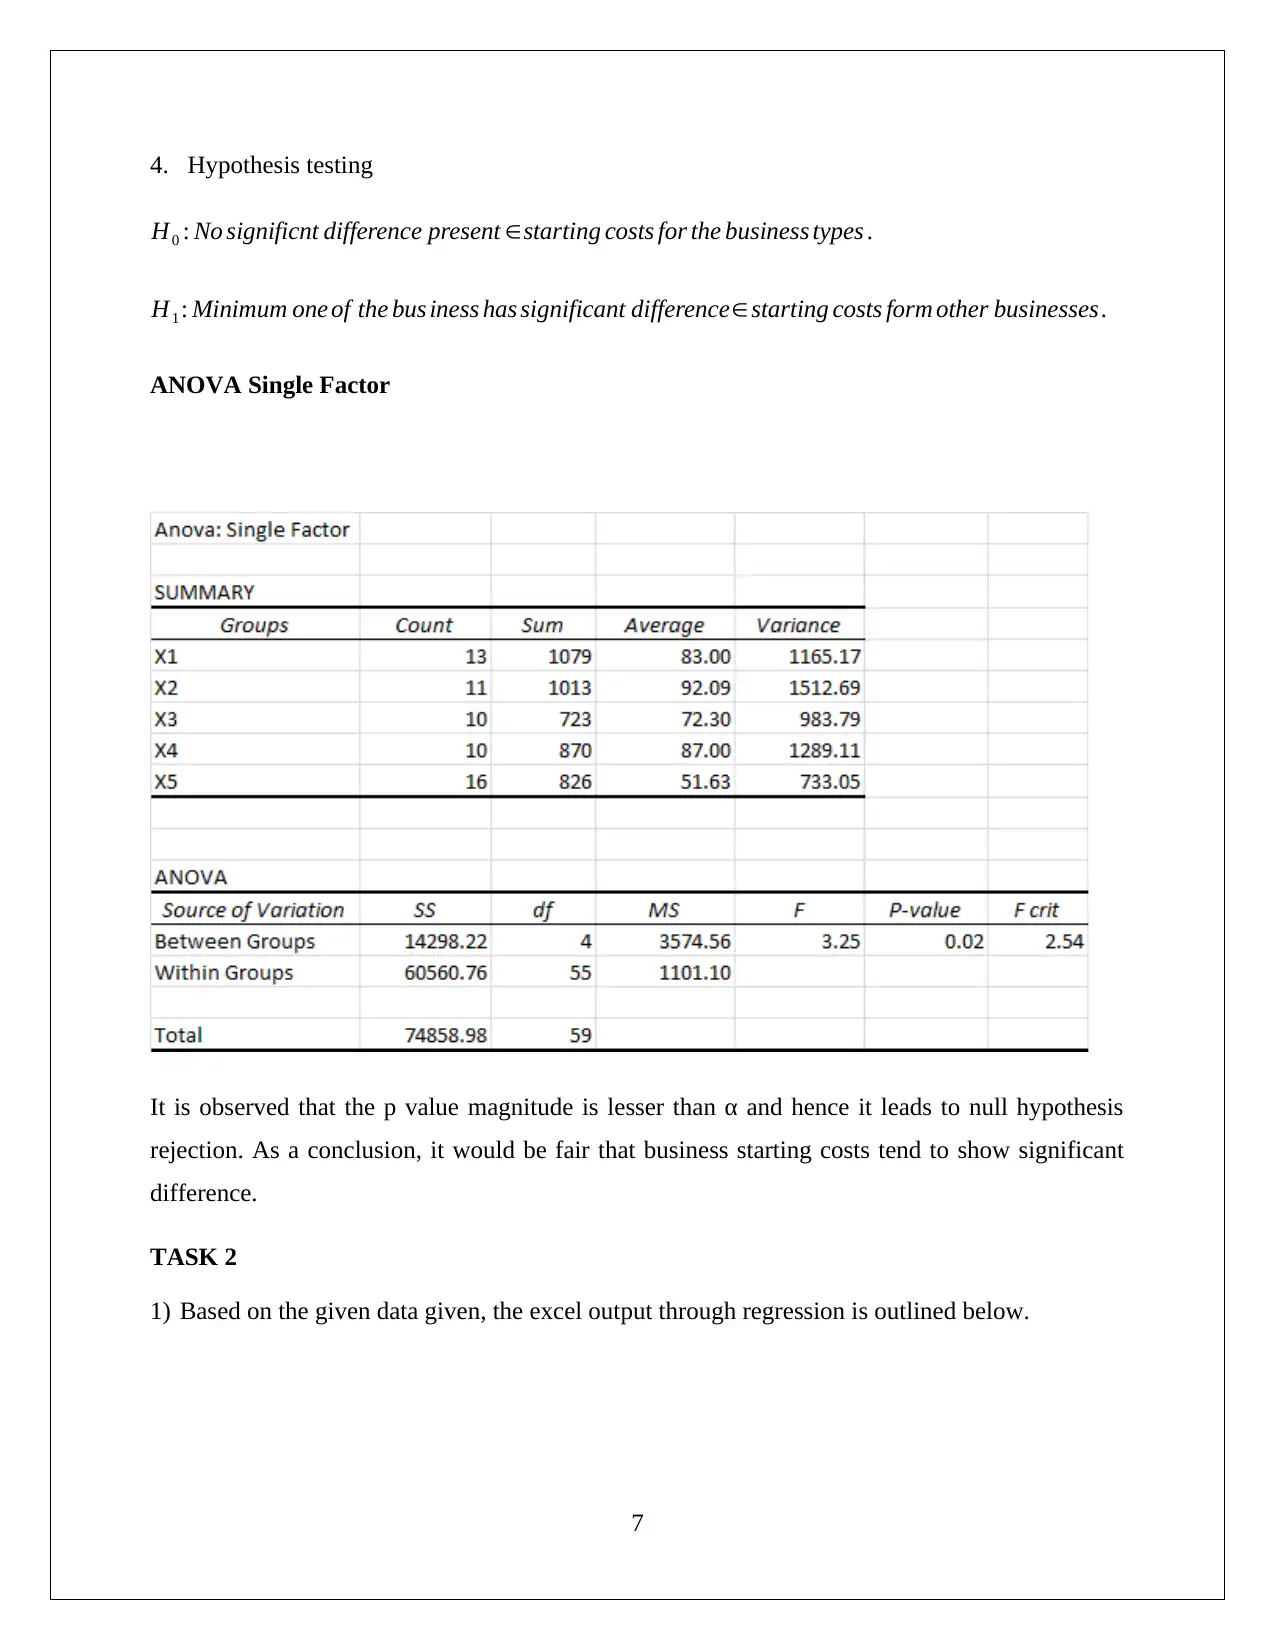
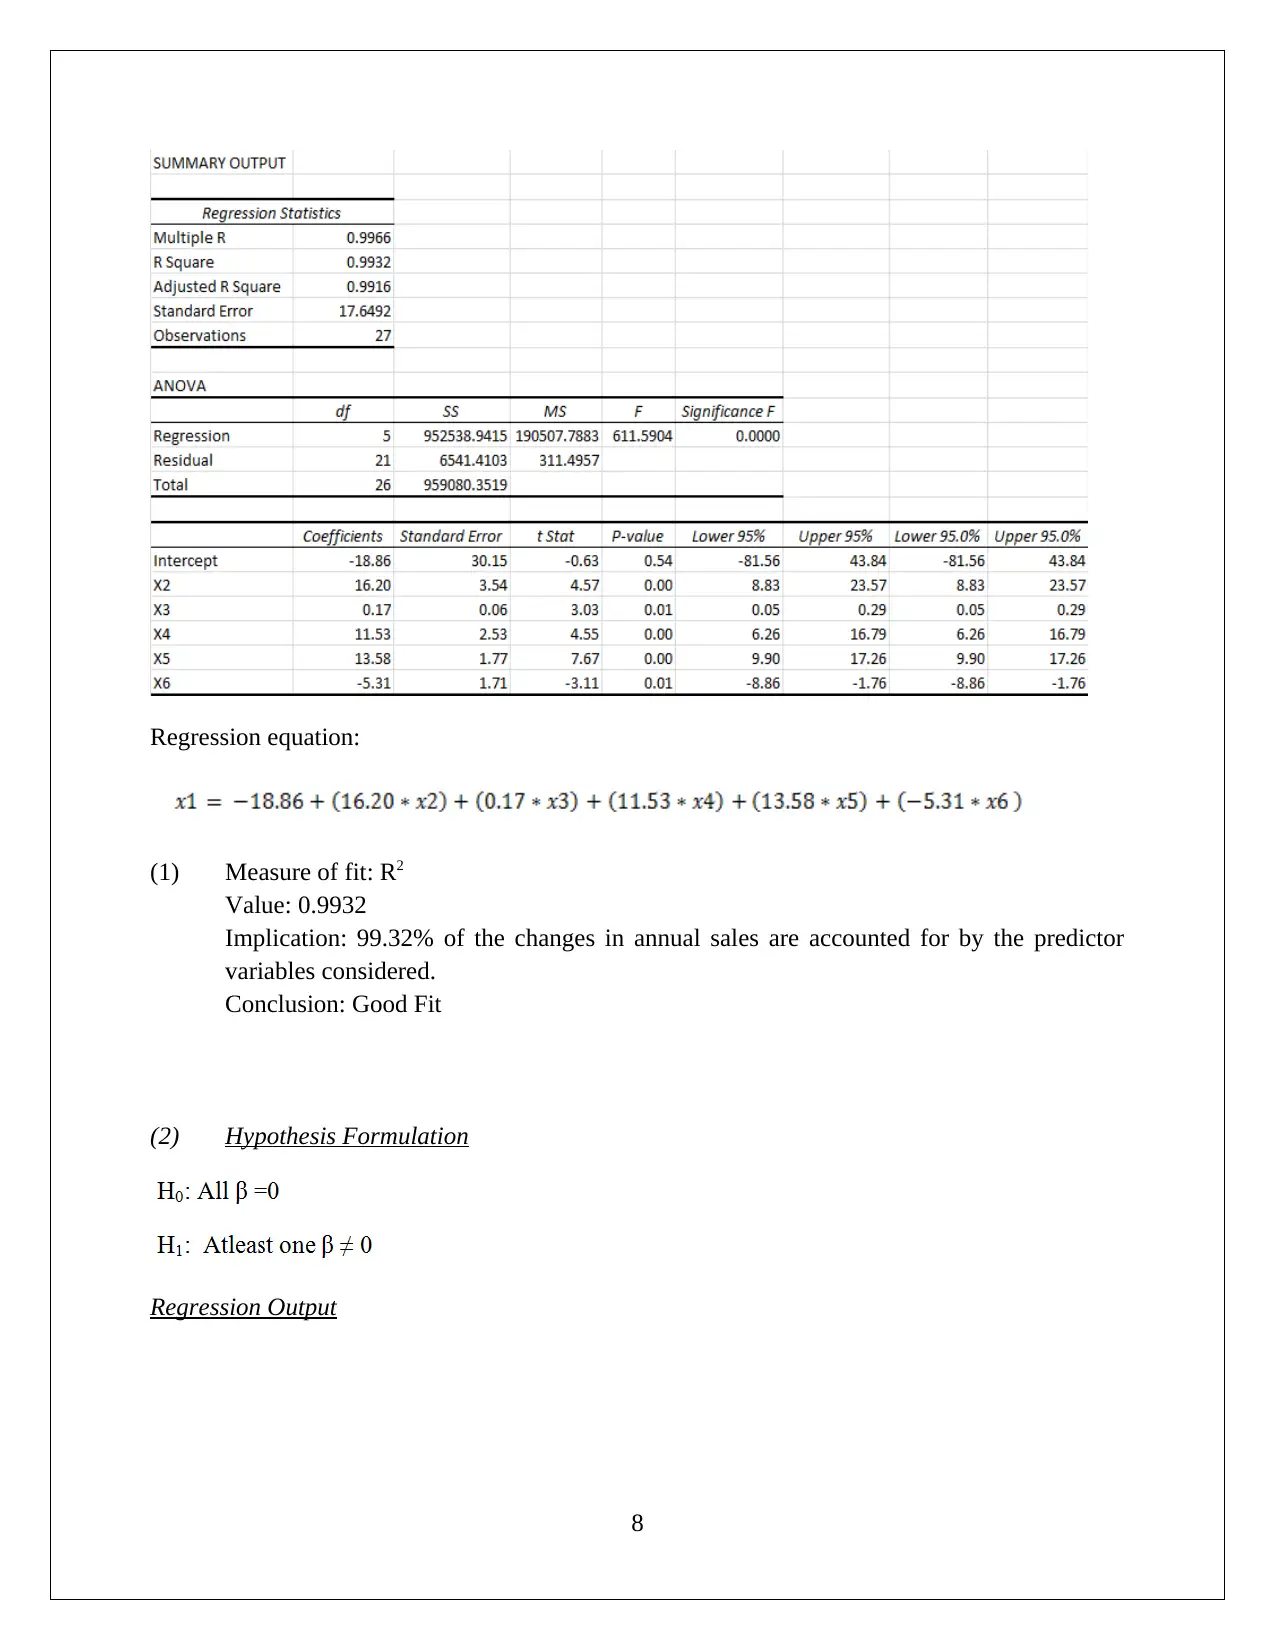
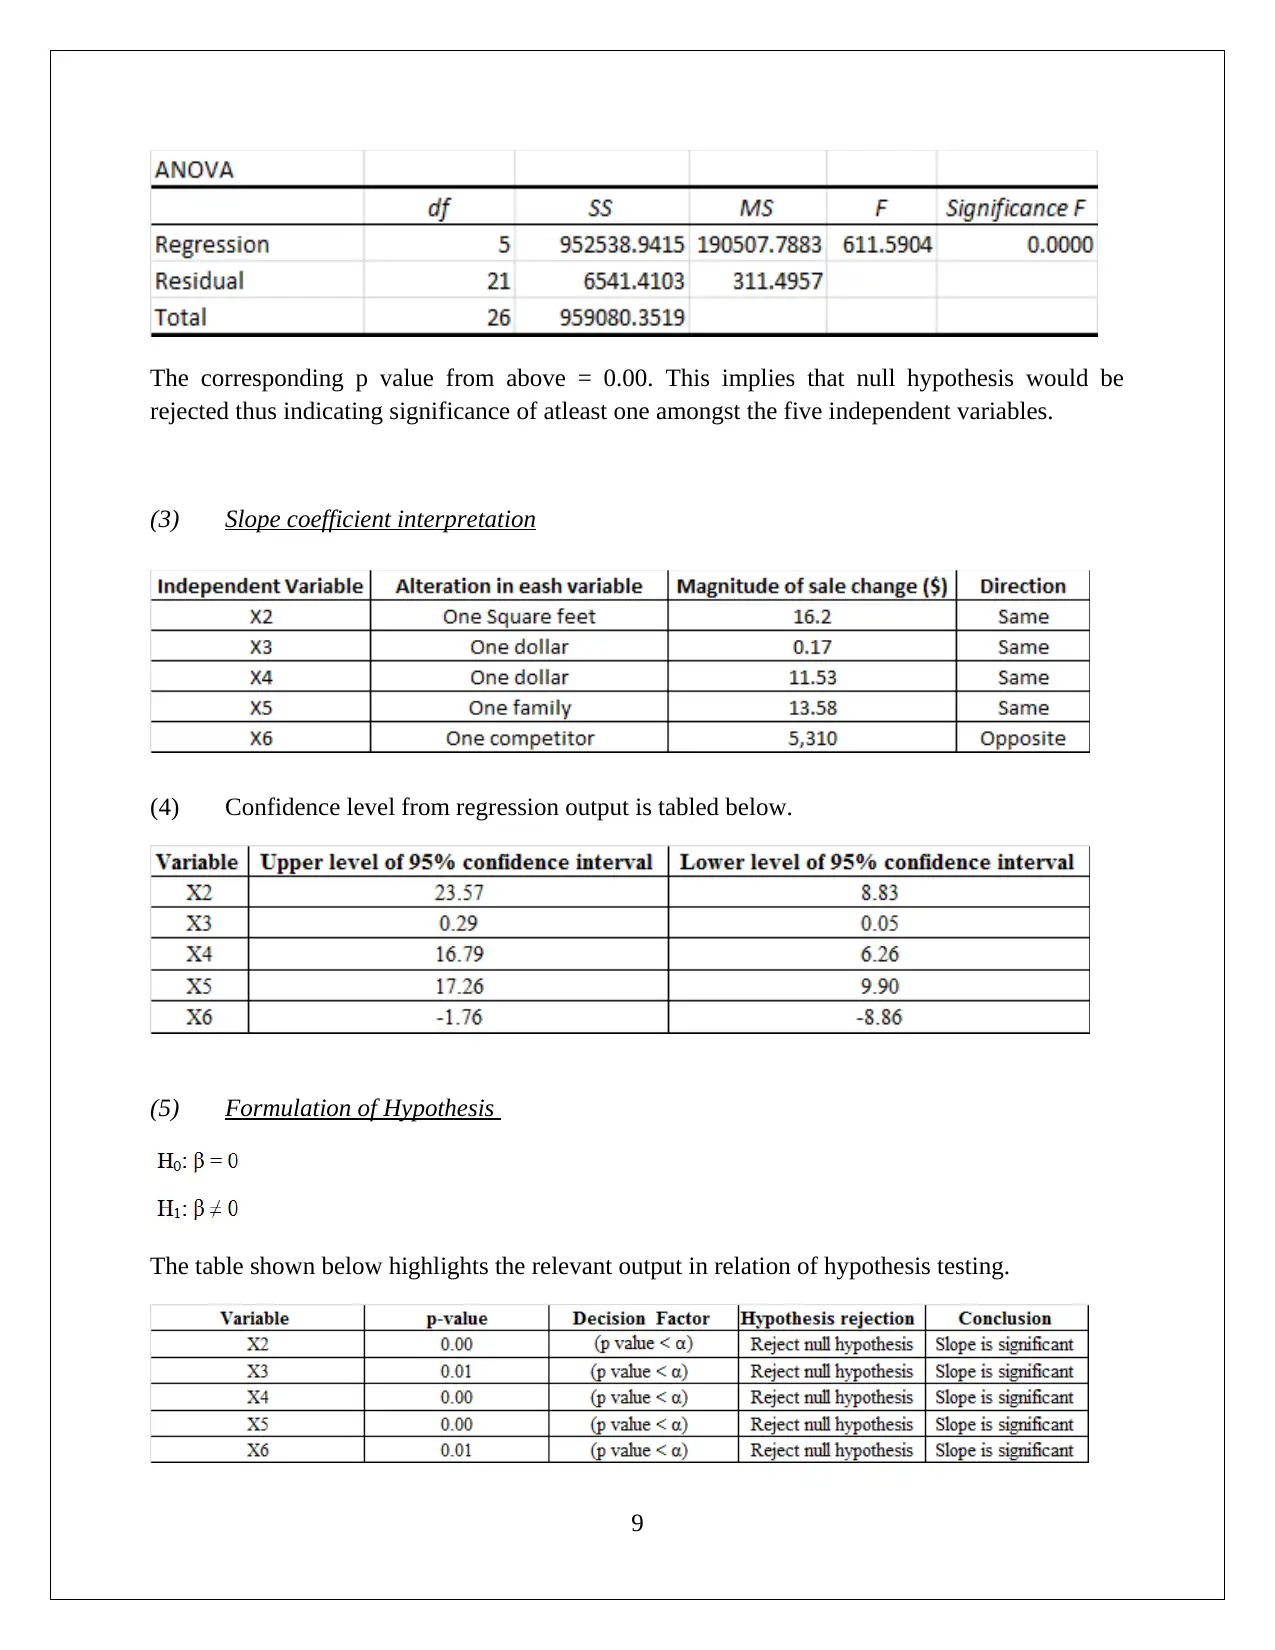
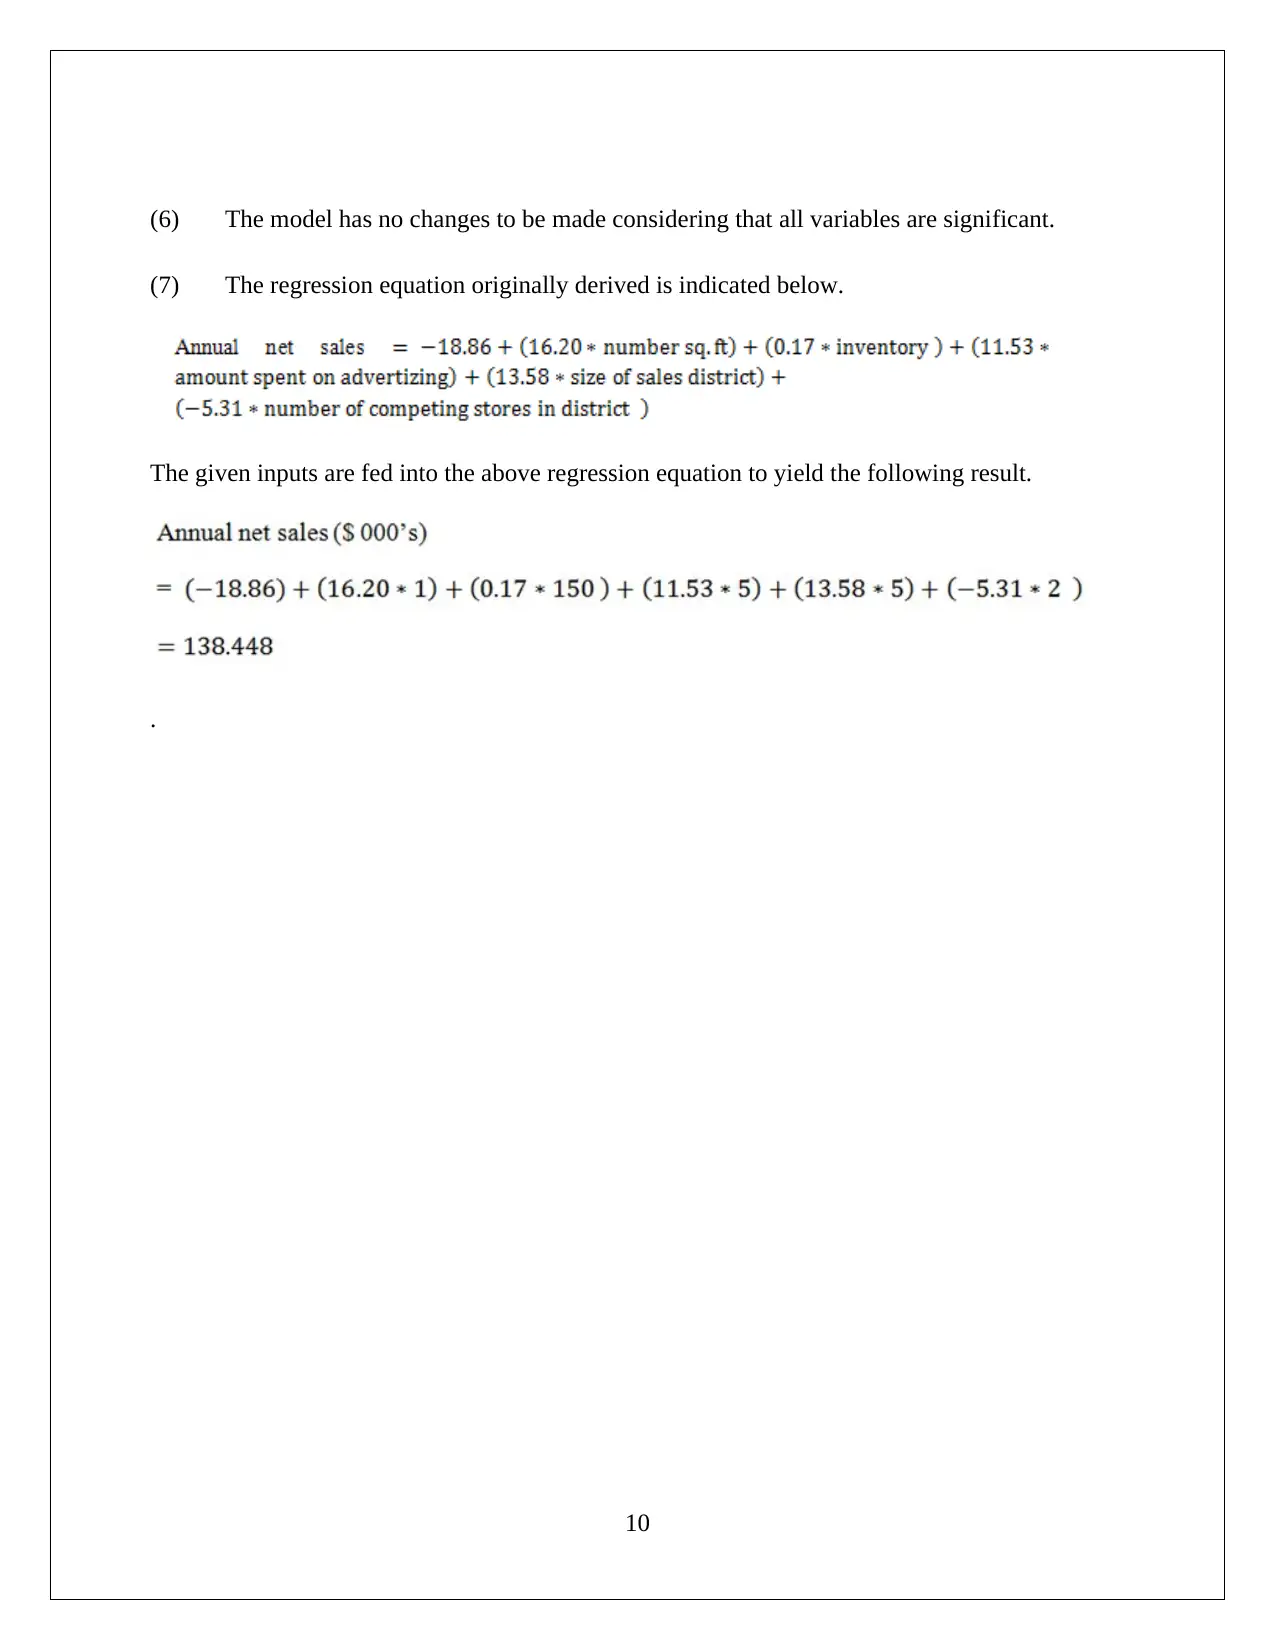
This assignment involves statistical analysis, including the construction of frequency tables, histograms, and hypothesis testing using ANOVA and regression analysis. Key observations about startup costs and their implications are discussed, along with the significance of predictor variables in regression.
Document Page
STATISTICS
Student Name & ID
[Pick the date]
Task 1
1
tabler-icon-diamond-filled.svg

Paraphrase This Document

Need a fresh take? Get an instant paraphrase of this document with our AI Paraphraser
Document Page
Given data set
1. Requisite statistical parameters are computed below.
2. Construction frequency and relative frequency table and histogram
2
Document Page
(a) Frequency and relative frequency table by taking class as 0 to 30
3
Document Page
(b) Histogram for relative frequency of the variables is shown below:
4
tabler-icon-diamond-filled.svg

Paraphrase This Document

Need a fresh take? Get an instant paraphrase of this document with our AI Paraphraser
Document Page
5
Document Page
3. Key observations are summarized below.
The distribution in relation to the startup costs is non-normal for all businesses. The
evidence in this regards is derived from skew not being zero.
Further, the setup costs for most businesses tend to be larger than $ 30,000. A noticeable
exception in this regard is pet business.
6
Document Page
4. Hypothesis testing
H0 : No significnt difference present starting costs for the business types .
H1 : Minimum one of the bus iness has significant differencestarting costs form other businesses .
ANOVA Single Factor
It is observed that the p value magnitude is lesser than α and hence it leads to null hypothesis
rejection. As a conclusion, it would be fair that business starting costs tend to show significant
difference.
TASK 2
1) Based on the given data given, the excel output through regression is outlined below.
7
tabler-icon-diamond-filled.svg

Paraphrase This Document

Need a fresh take? Get an instant paraphrase of this document with our AI Paraphraser
Document Page
Regression equation:
(1) Measure of fit: R2
Value: 0.9932
Implication: 99.32% of the changes in annual sales are accounted for by the predictor
variables considered.
Conclusion: Good Fit
(2) Hypothesis Formulation
Regression Output
8
Document Page
The corresponding p value from above = 0.00. This implies that null hypothesis would be
rejected thus indicating significance of atleast one amongst the five independent variables.
(3) Slope coefficient interpretation
(4) Confidence level from regression output is tabled below.
(5) Formulation of Hypothesis
The table shown below highlights the relevant output in relation of hypothesis testing.
9
Document Page
(6) The model has no changes to be made considering that all variables are significant.
(7) The regression equation originally derived is indicated below.
The given inputs are fed into the above regression equation to yield the following result.
.
10
chevron_up_icon
1 out of 10
circle_padding
hide_on_mobile
zoom_out_icon
[object Object]