Statistics Assignment: Analysis of Variance and Probability

Verified

Added on  2023/04/24

|6
|1111
|221
Homework Assignment
AI Summary
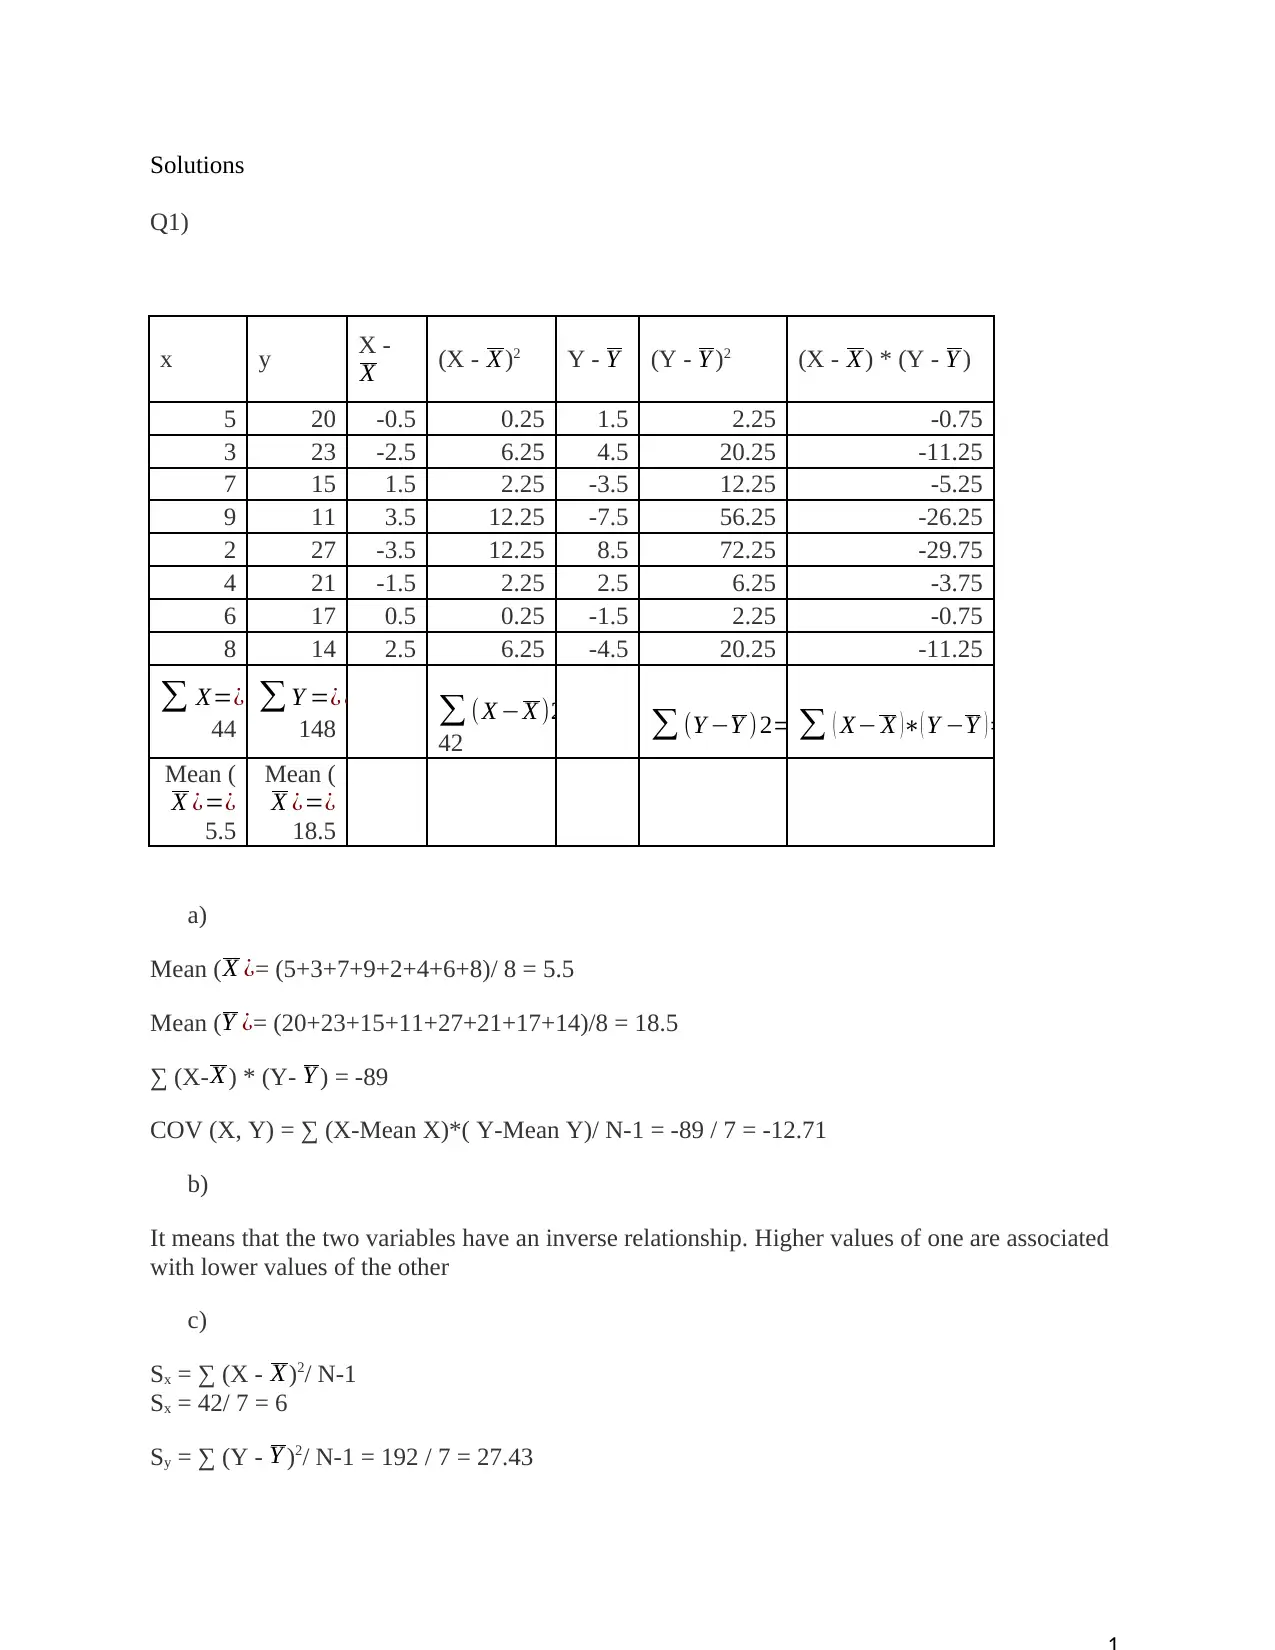
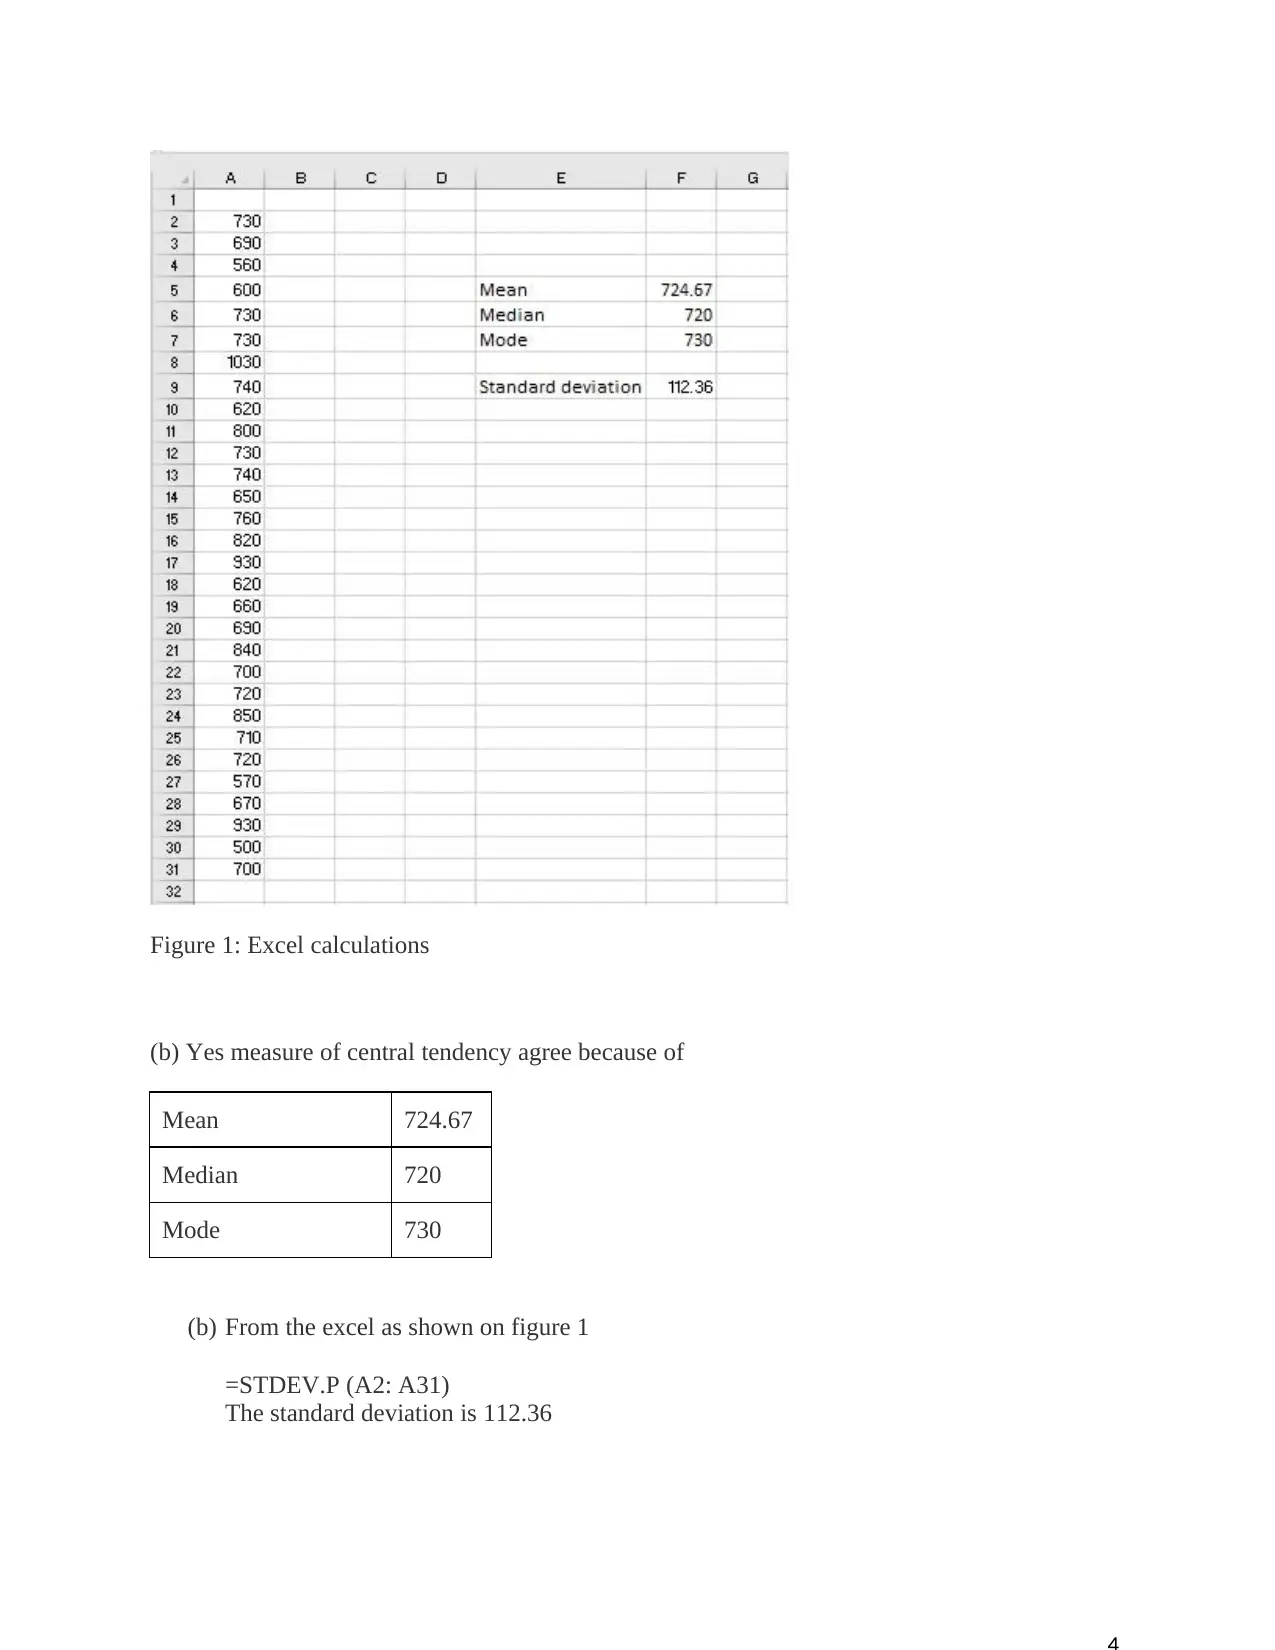
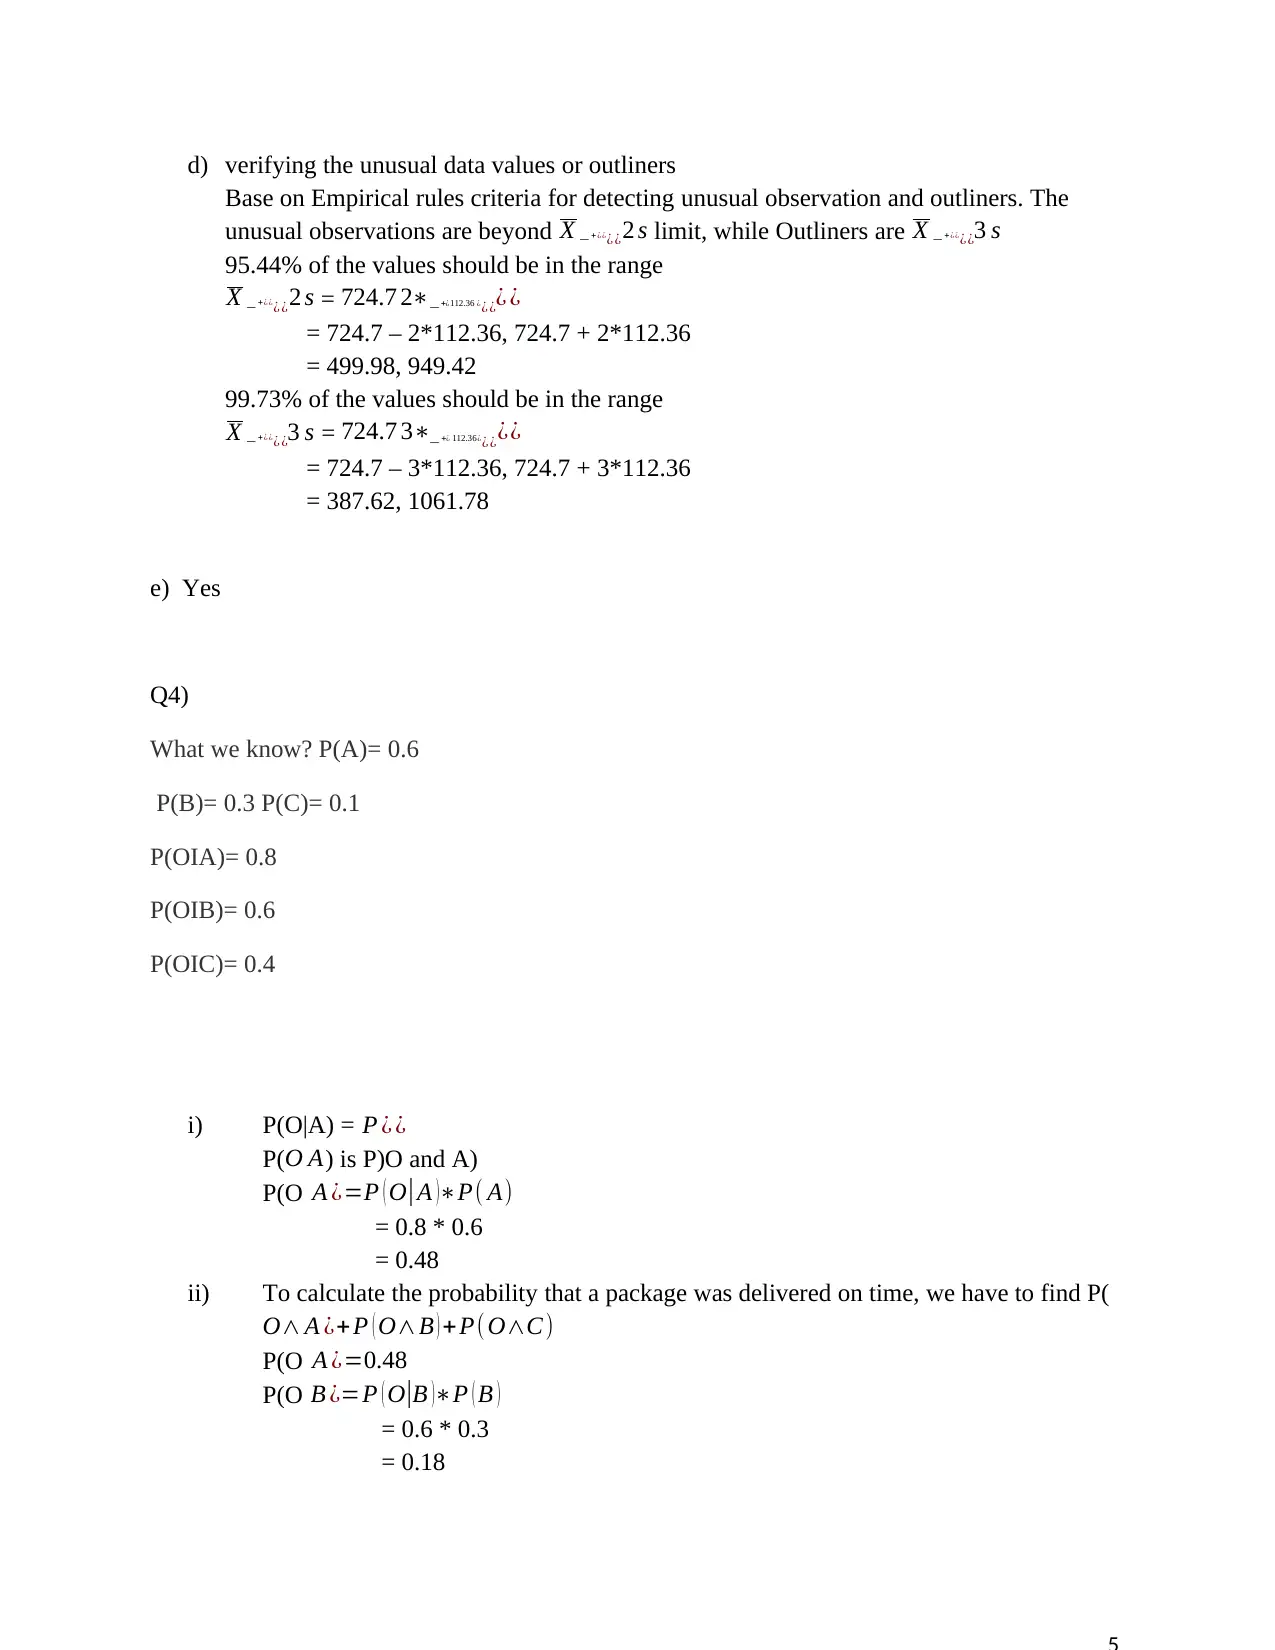
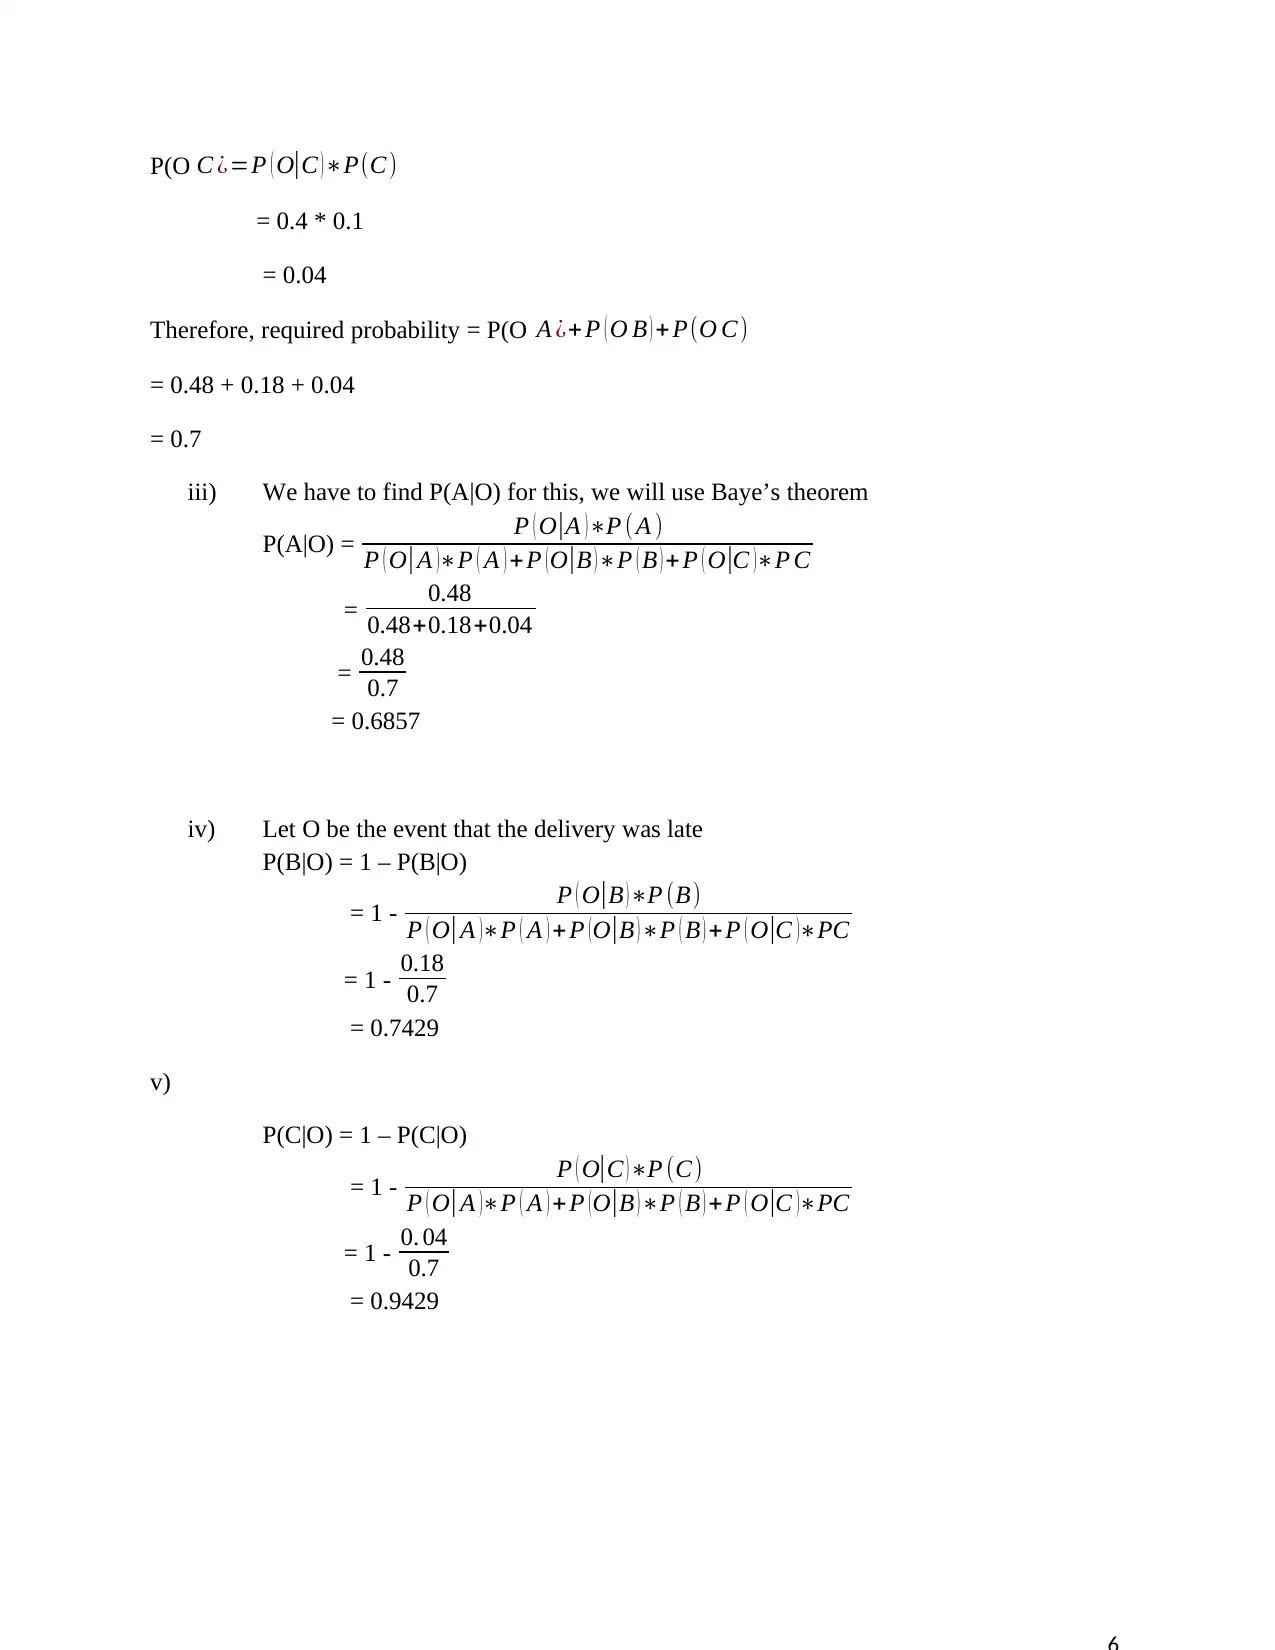
This statistics assignment provides solutions to four key questions. Question 1 covers the calculation and interpretation of covariance and correlation between two variables, x (years of experience) and y (salary), including a discussion on the relationship between them. Question 2 addresses hypothesis testing, specifically testing a company's claim about the percentage of users experiencing drowsiness from a sinus drug, involving the calculation of a p-value and confidence interval. Question 3 delves into measures of central tendency (mean, median, mode), standard deviation, and identifying unusual data values using empirical rules. Finally, Question 4 focuses on probability calculations using Bayes' theorem and conditional probability to determine the probability of events occurring, such as on-time delivery, given certain conditions. All solutions include detailed calculations and explanations.
Document Page
Solutions
Q1)
x y X -
X (X - X )2 Y - Y (Y - Y )2 (X - X ) * (Y - Y )
5 20 -0.5 0.25 1.5 2.25 -0.75
3 23 -2.5 6.25 4.5 20.25 -11.25
7 15 1.5 2.25 -3.5 12.25 -5.25
9 11 3.5 12.25 -7.5 56.25 -26.25
2 27 -3.5 12.25 8.5 72.25 -29.75
4 21 -1.5 2.25 2.5 6.25 -3.75
6 17 0.5 0.25 -1.5 2.25 -0.75
8 14 2.5 6.25 -4.5 20.25 -11.25
X=¿ ¿
44
Y =¿ ¿
148 (X X )2=¿ ¿
42 (Y Y ) 2=¿ 192 ¿ ( X X )( Y Y )=89
Mean (
X ¿=¿
5.5
Mean (
X ¿=¿
18.5
a)
Mean ( X ¿= (5+3+7+9+2+4+6+8)/ 8 = 5.5
Mean (Y ¿= (20+23+15+11+27+21+17+14)/8 = 18.5
∑ (X- X ) * (Y- Y ) = -89
COV (X, Y) = ∑ (X-Mean X)*( Y-Mean Y)/ N-1 = -89 / 7 = -12.71
b)
It means that the two variables have an inverse relationship. Higher values of one are associated
with lower values of the other
c)
Sx = ∑ (X - X )2/ N-1
Sx = 42/ 7 = 6
Sy = ∑ (Y - Y )2/ N-1 = 192 / 7 = 27.43
tabler-icon-diamond-filled.svg

Secure Best Marks with AI Grader

Need help grading? Try our AI Grader for instant feedback on your assignments.
Document Page
We got Sy = 6, Sy = 27.43
Cov(x, y) = -12.71
r(x, y) = Cov(x, y) / Sx * Sy
r(x, y) = -12.71 / 6*27.43 = -0.077
d)
Since the value of r(x, y) is negative so both X and y are negatively related with each other
Q2)
a) H0: P = 0.10
Ha: P 0.10
b) ^P = 81/900 = 0.09
Z =
p ^p
p ( 1 p )
n
=
0.090.10
0.10 ( 10.10 )
900
= -1
The P-value = 2 * P(Z < -1)
= 2 * 0.1587
= 0.3174
Since The P-value > = 0.05, so we should not reject H0.
So at 5% significance level there is enough evidence to infer that the competitor is correct.
c) For 95% confidence interval, the critical value z* = 1.96
The 95% confidence interval for population proportion is
^P +/- z* * P ( 1P )
n
Document Page
= 0.09 +/- 1.96 * 0.10 ( 10.10 )
900
= 0.09 +/- 0.0196
= 0.0704, 0.1096
d)
The values within the intervals of a 95% confidence will be considered acceptable, while values
that will be outside the intervals are always rejected. Therefore for the null hypothesis P = 0.10 is
contained in the 95% interval 0.0704 to 0.1096, this means that the null hypothesis will be
accepted at 0.05 level.
Q3)
(a) using excel to solve for the Measure of central tendency
For Mean use
= AVERAGE (A2:A31)
For median use
=MEDIAN (A2: A31)
For Mode use
=MODE (A2: A31).
Document Page
Figure 1: Excel calculations
(b) Yes measure of central tendency agree because of
Mean 724.67
Median 720
Mode 730
(b) From the excel as shown on figure 1
=STDEV.P (A2: A31)
The standard deviation is 112.36
tabler-icon-diamond-filled.svg

Secure Best Marks with AI Grader

Need help grading? Try our AI Grader for instant feedback on your assignments.
Document Page
d) verifying the unusual data values or outliners
Base on Empirical rules criteria for detecting unusual observation and outliners. The
unusual observations are beyond X 2 s ¿+ ¿¿ ¿ limit, while Outliners are X 3 s ¿+¿¿ ¿
95.44% of the values should be in the range
X 2 s ¿+¿¿ ¿ = 724.7 2 ¿ ¿+¿112.36 ¿ ¿ ¿
= 724.7 – 2*112.36, 724.7 + 2*112.36
= 499.98, 949.42
99.73% of the values should be in the range
X 3 s ¿+¿¿ ¿ = 724.7 3 ¿ ¿+¿ 112.36¿ ¿ ¿
= 724.7 – 3*112.36, 724.7 + 3*112.36
= 387.62, 1061.78
e) Yes
Q4)
What we know? P(A)= 0.6
P(B)= 0.3 P(C)= 0.1
P(OIA)= 0.8
P(OIB)= 0.6
P(OIC)= 0.4
i) P(O|A) = P ¿ ¿
P(O A) is P)O and A)
P(O A ¿=P ( O| A )P( A)
= 0.8 * 0.6
= 0.48
ii) To calculate the probability that a package was delivered on time, we have to find P(
O A ¿+ P ( OB ) + P(OC)
P(O A ¿=0.48
P(O B ¿=P ( O|B )P ( B )
= 0.6 * 0.3
= 0.18
Document Page
P(O C ¿=P ( O|C ) P(C)
= 0.4 * 0.1
= 0.04
Therefore, required probability = P(O A ¿+ P ( O B ) + P(O C)
= 0.48 + 0.18 + 0.04
= 0.7
iii) We have to find P(A|O) for this, we will use Baye’s theorem
P(A|O) = P ( O|A )P ( A )
P ( O|A )P ( A ) + P (O|B )P ( B ) + P ( O|C )P C
= 0.48
0.48+0.18+0.04
= 0.48
0.7
= 0.6857
iv) Let O be the event that the delivery was late
P(B|O) = 1 – P(B|O)
= 1 - P ( O|B ) P (B)
P ( O| A )P ( A ) + P ( O|B ) P ( B ) +P ( O|C )PC
= 1 - 0.18
0.7
= 0.7429
v)
P(C|O) = 1 – P(C|O)
= 1 - P ( O|C ) P (C)
P ( O| A )P ( A ) + P ( O|B ) P ( B ) +P ( O|C )PC
= 1 - 0. 04
0.7
= 0.9429
chevron_up_icon
1 out of 6
circle_padding
hide_on_mobile
zoom_out_icon
logo.png

Your All-in-One AI-Powered Toolkit for Academic Success.

Available 24*7 on WhatsApp / Email

[object Object]