Statistics Assignment: Frequency, Plots, and Measures

Verified

Added on  2021/10/11

|11
|1132
|77
Homework Assignment
AI Summary
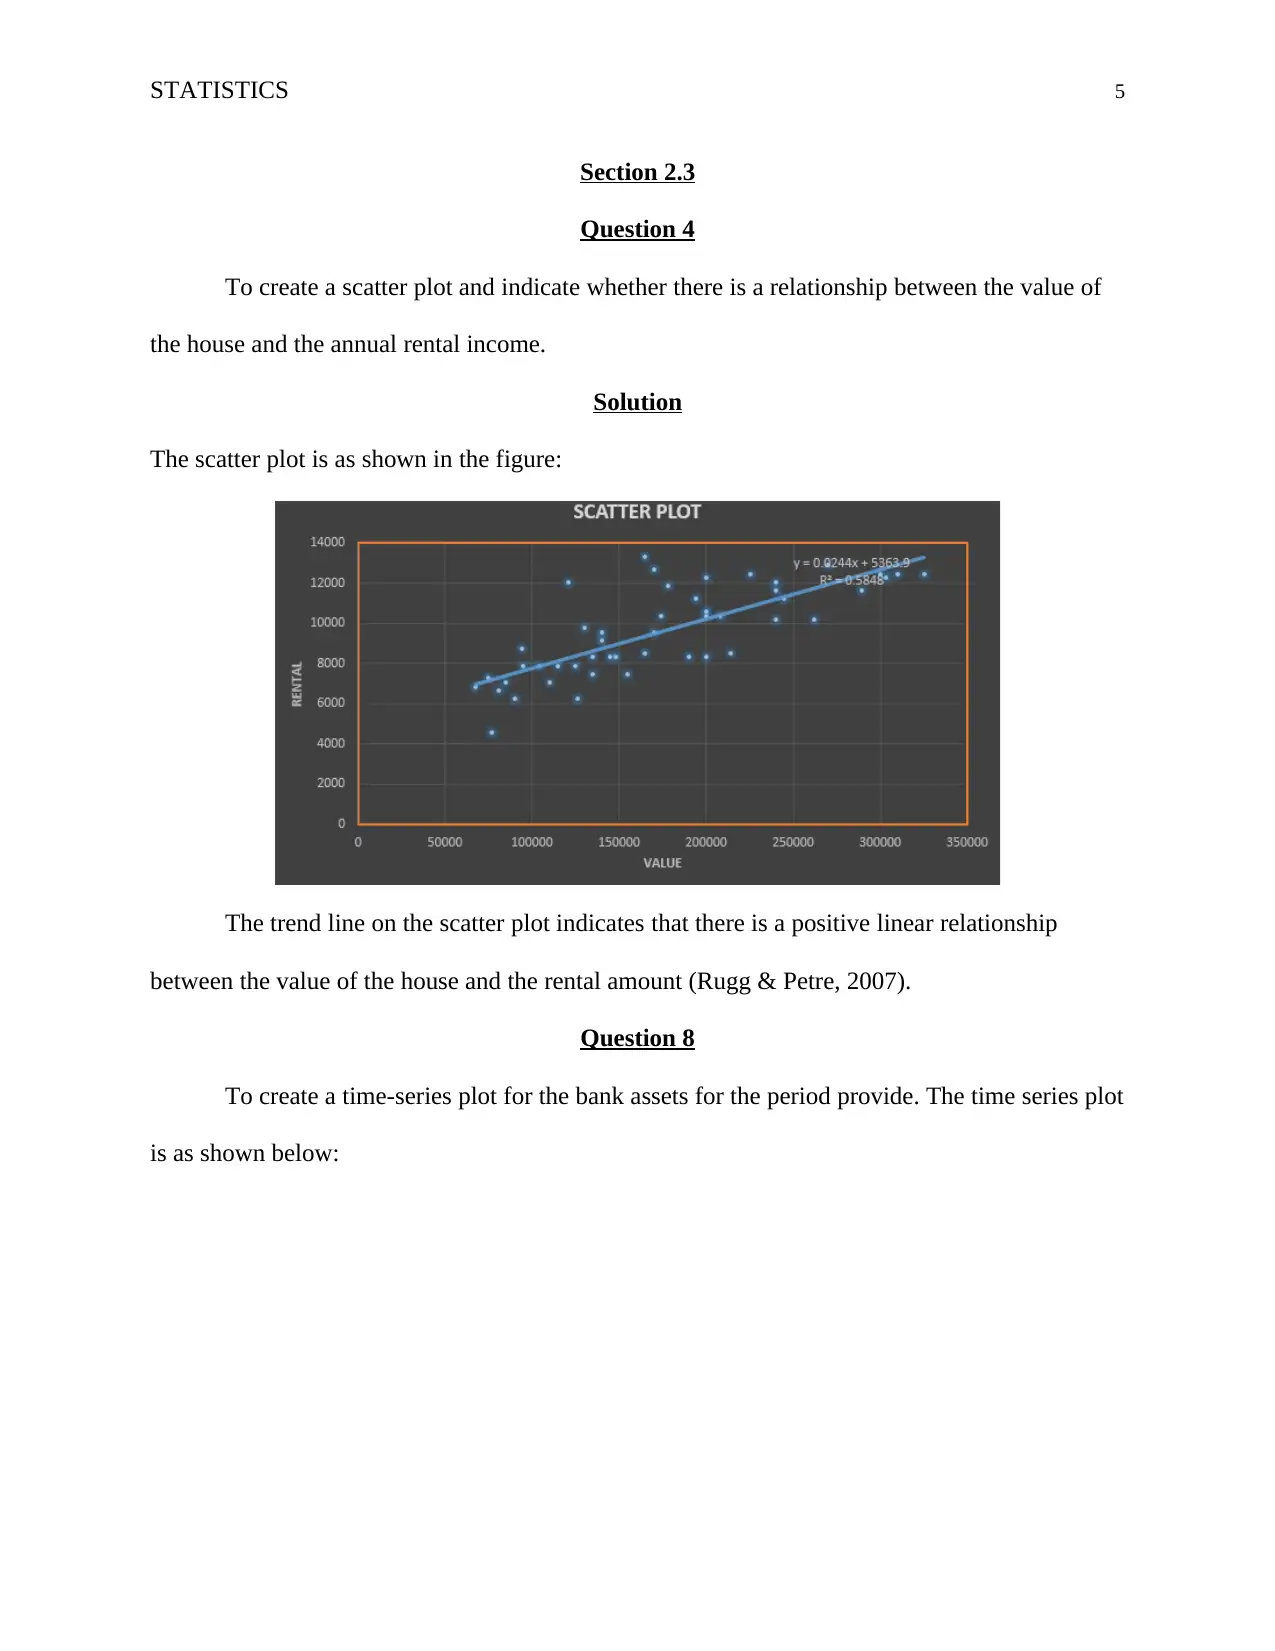
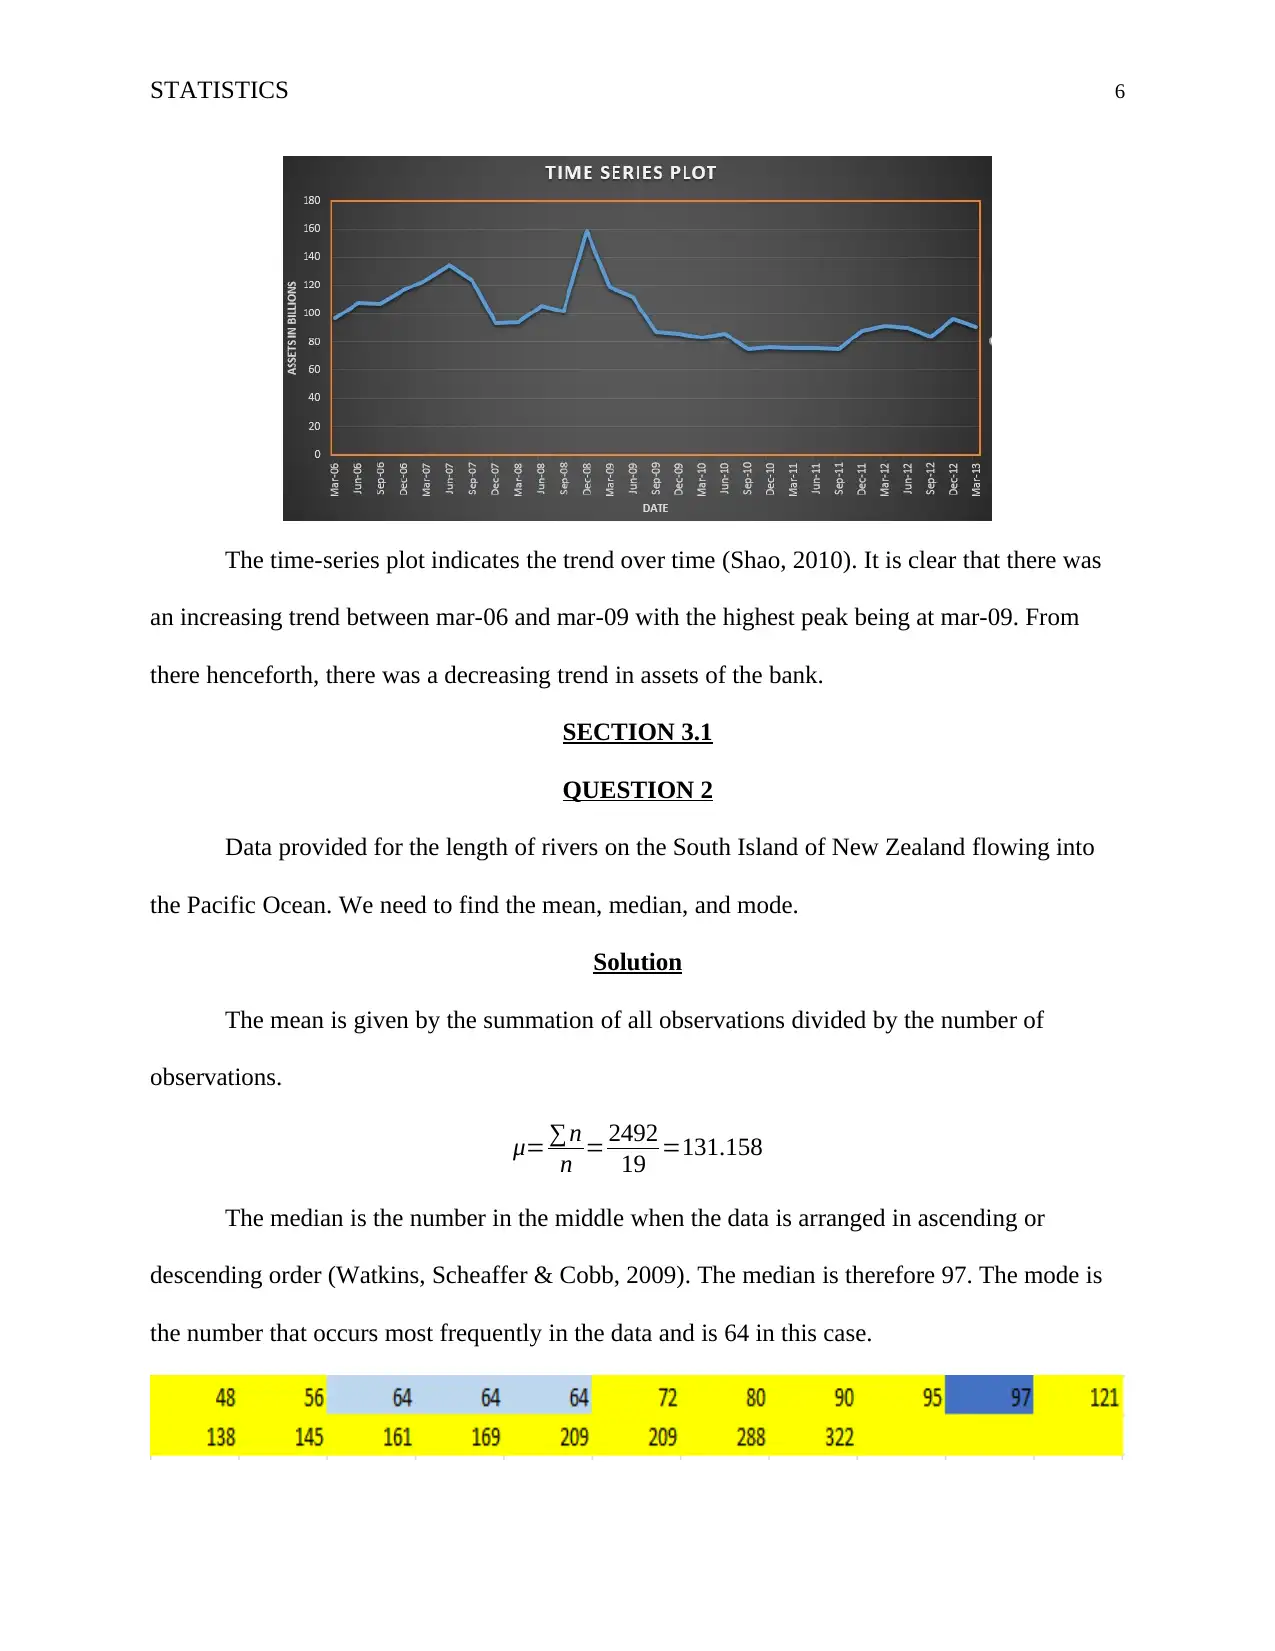
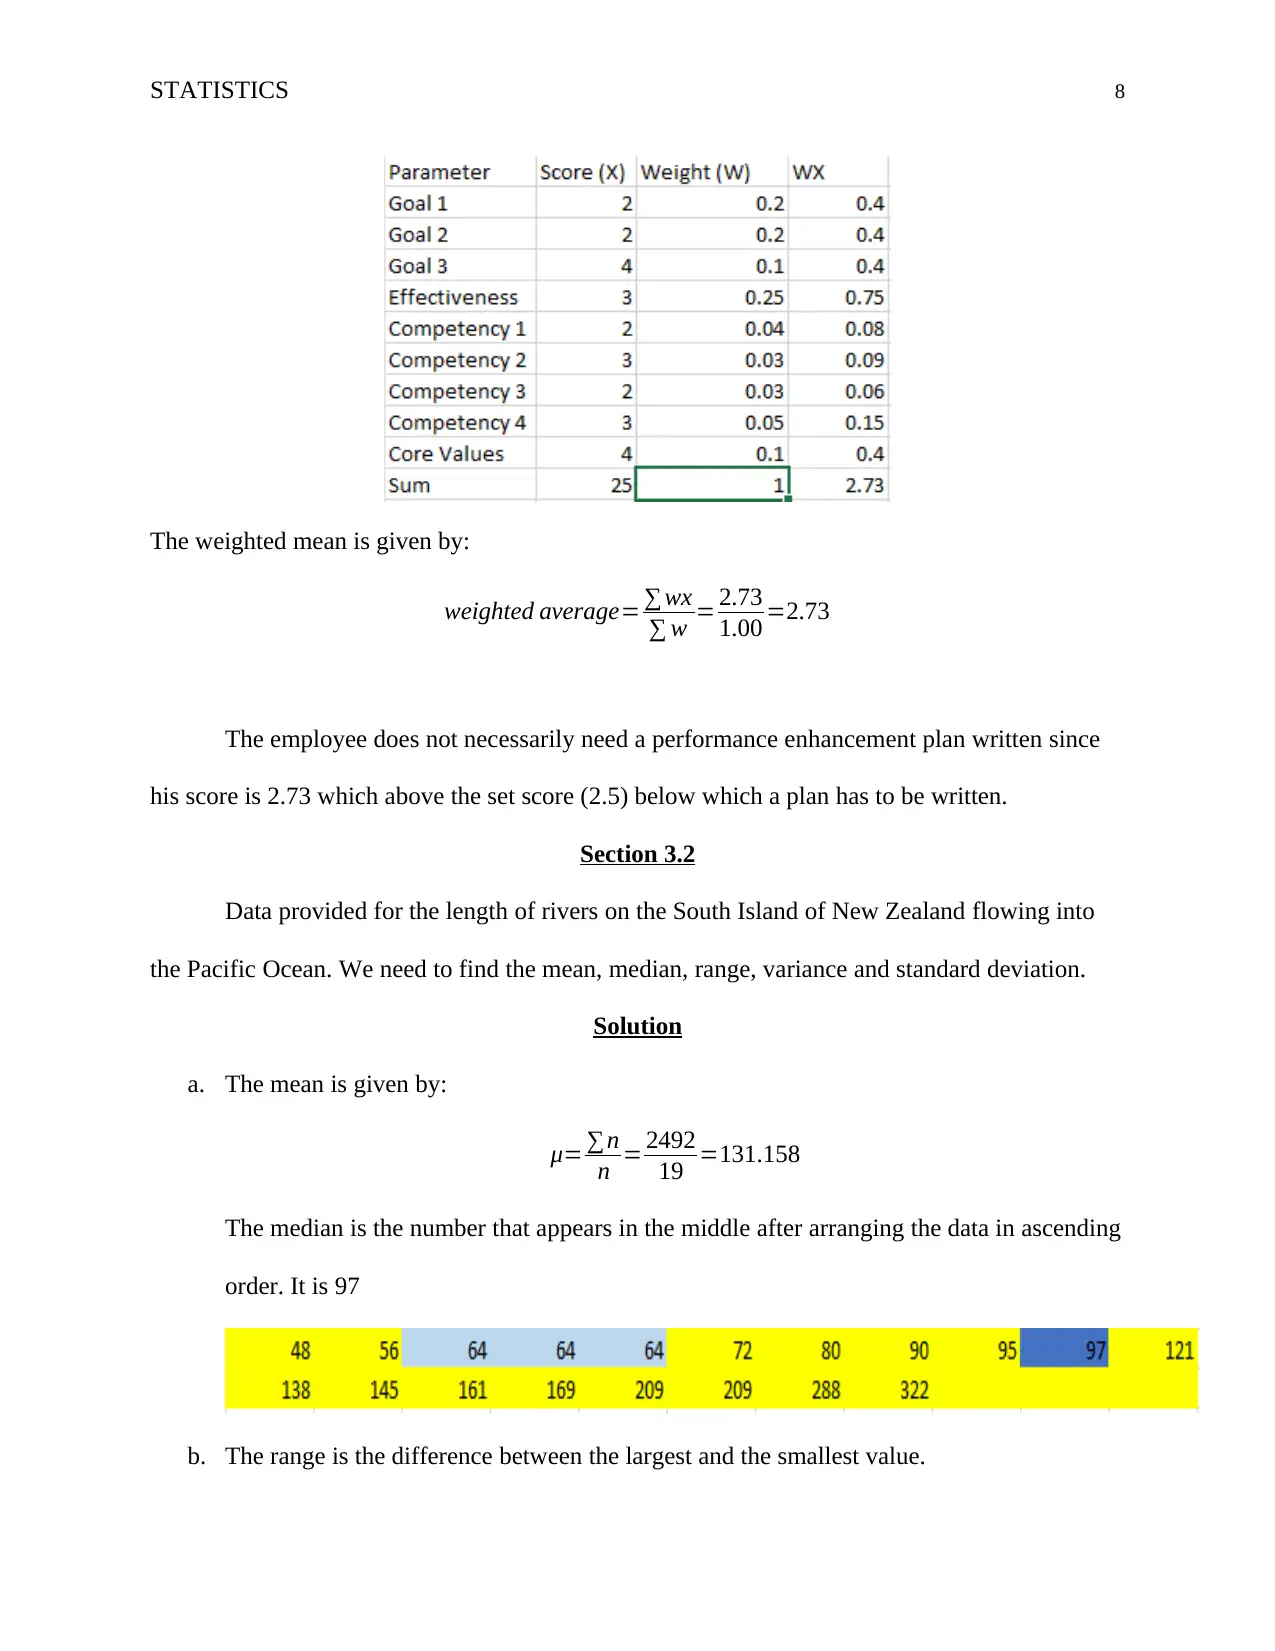
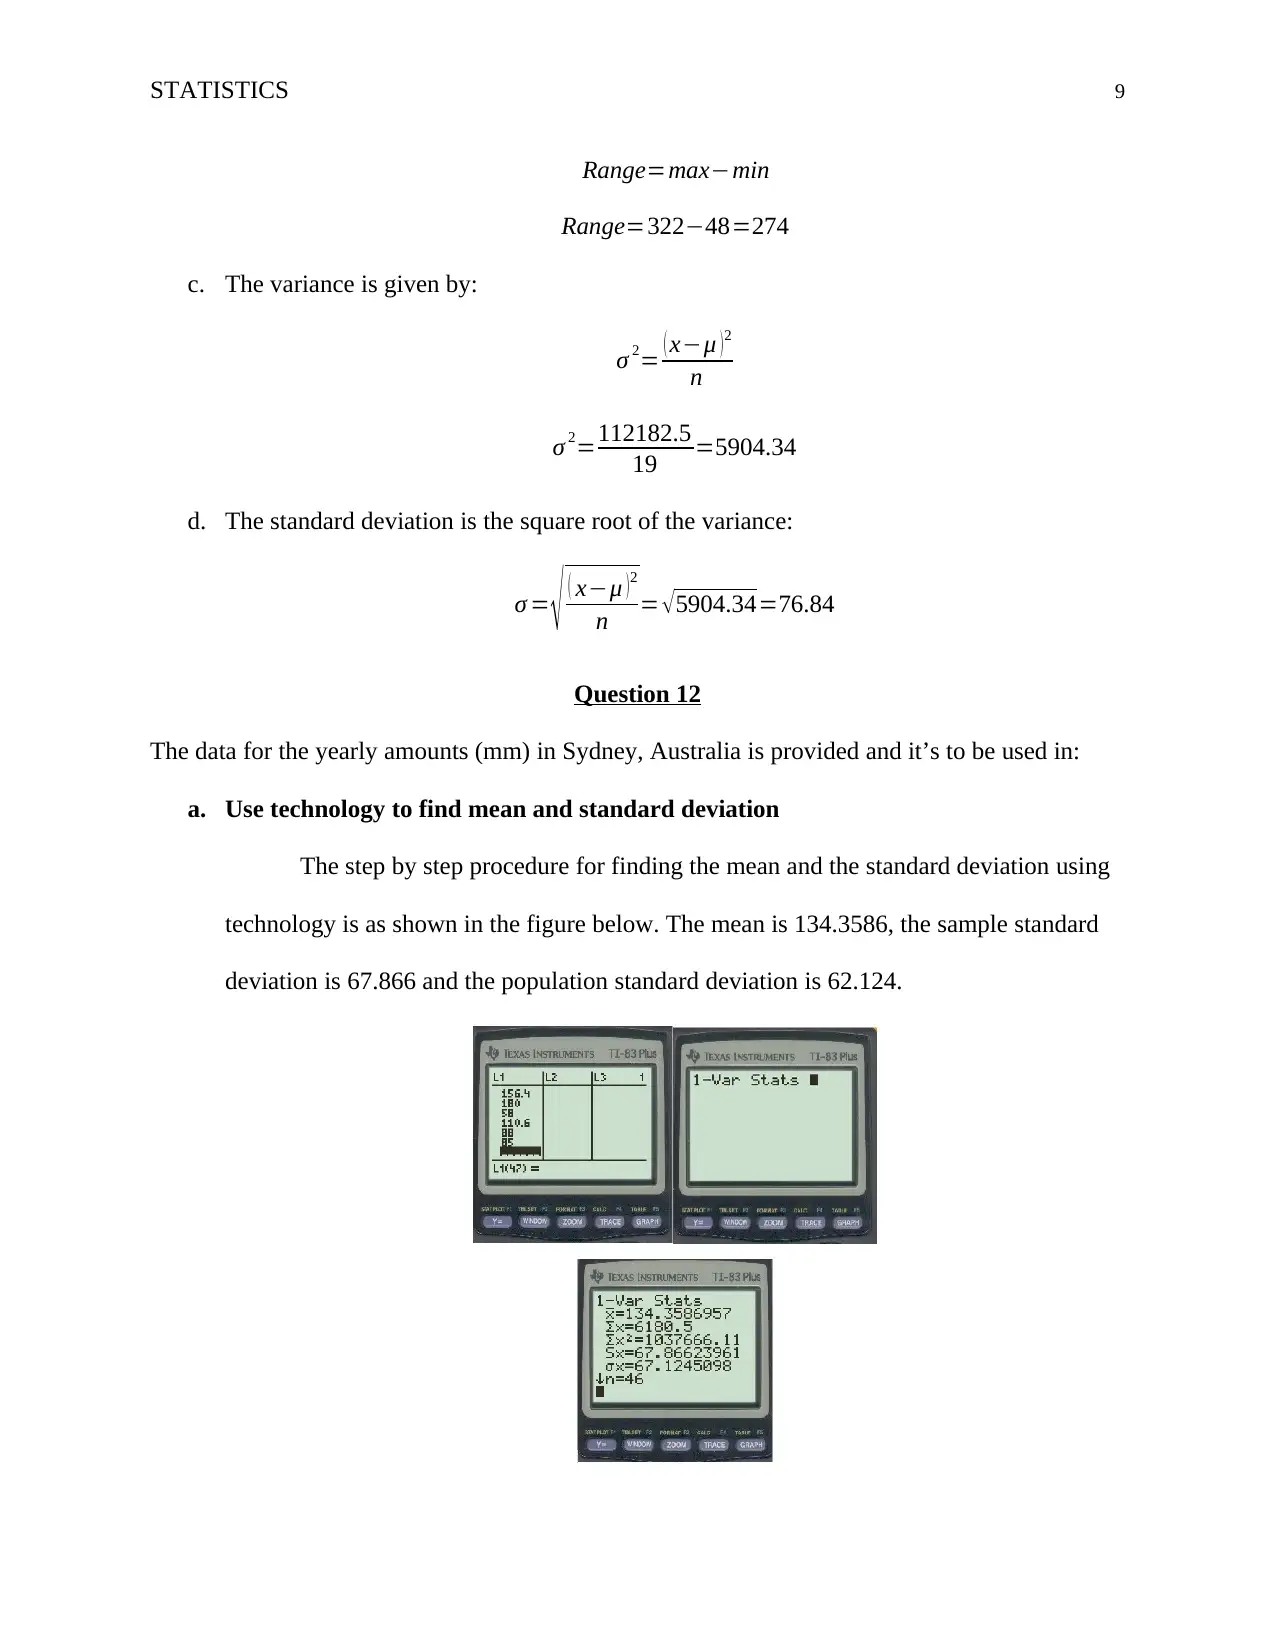
This document presents a comprehensive solution to a statistics homework assignment, covering various topics in descriptive statistics and data analysis. The solution includes the creation of frequency distributions, relative frequency distributions, and cumulative frequency distributions. It also involves constructing and interpreting histograms, relative frequency histograms, scatter plots, and time-series plots to visualize and analyze data. Furthermore, the assignment addresses calculating measures of central tendency (mean, median, mode) and dispersion (range, variance, standard deviation) for different datasets. The solution also includes applying Chebyshev's theorem to determine intervals for data distribution and calculating weighted averages. The assignment utilizes real-world datasets and provides step-by-step procedures for solving statistical problems, along with relevant references to support the analyses. This resource is valuable for students seeking to understand and solve statistics problems.
Document Page
Running head: STATISTICS 1
Statistics
Student Name
University
tabler-icon-diamond-filled.svg

Paraphrase This Document

Need a fresh take? Get an instant paraphrase of this document with our AI Paraphraser
Document Page
STATISTICS 2
SECTION 2.2
QUESTION 2
To create a frequency distribution, relative frequency distribution, and cumulative
frequency distribution for the data of median incomes of females in each state in the US using 7
classes.
Solution
Question 6
To create a histogram and relative frequency histogram for the data above #2.2.10.
The histogram is a shown below:
Document Page
STATISTICS 3
From the histogram above and the relative histogram below, the data can be said to be
negatively skewed meaning that majority of the observations lie below the mean. There also
exists an outlier to the extreme right (Rumsey, 2007).
The relative frequency histogram is as shown below:
QUESTION 8.
To create a histogram and relative frequency histogram for data in table #2.2.12 (Data of
Health Insurance Premiums)
Solution
The data prepared for construction of the histograms is as below:
The histogram is as shown below:
Document Page
STATISTICS 4
The relative frequency histogram is as shown below:
From the histogram and the relative frequency histogram, it is evident that the data is
skewed to the left and there are outliers in the data.
tabler-icon-diamond-filled.svg

Paraphrase This Document

Need a fresh take? Get an instant paraphrase of this document with our AI Paraphraser
Document Page
STATISTICS 5
Section 2.3
Question 4
To create a scatter plot and indicate whether there is a relationship between the value of
the house and the annual rental income.
Solution
The scatter plot is as shown in the figure:
The trend line on the scatter plot indicates that there is a positive linear relationship
between the value of the house and the rental amount (Rugg & Petre, 2007).
Question 8
To create a time-series plot for the bank assets for the period provide. The time series plot
is as shown below:
Document Page
STATISTICS 6
The time-series plot indicates the trend over time (Shao, 2010). It is clear that there was
an increasing trend between mar-06 and mar-09 with the highest peak being at mar-09. From
there henceforth, there was a decreasing trend in assets of the bank.
SECTION 3.1
QUESTION 2
Data provided for the length of rivers on the South Island of New Zealand flowing into
the Pacific Ocean. We need to find the mean, median, and mode.
Solution
The mean is given by the summation of all observations divided by the number of
observations.
μ= n
n = 2492
19 =131.158
The median is the number in the middle when the data is arranged in ascending or
descending order (Watkins, Scheaffer & Cobb, 2009). The median is therefore 97. The mode is
the number that occurs most frequently in the data and is 64 in this case.
Document Page
STATISTICS 7
QUESTION 8
Types of measure scale and the center measure used for the variable used when;
a. You collect data on the height of plants using a new fertilizer.
This is a ratio measure of scale as in the case the scale has an absolute zero, that is no
values below zero. The measure of center can be determined using the mean, median or
mode.
b. You collect data on the cars that people drive in Campbell town, Australia.
This is a ratio measure of scale that only takes discrete values. The measure of center can
be determined by the mean.
c. You collect data on the temperature at different locations in Antarctica.
This is an interval scale of measurement since it has equal units also the zero represents a
point of measurement in the interval. The measure of center can be determined by either
mean, median or the mode.
d. You collect data on the first, second, and third winner in beer competition.
This is as ordinal scale of measurement since it represents a well-defined order of ranks.
In this case the measure of center can be identified by the mode.
Question 12
To find the weighted average for the scores of an employee prepared against a set standard.
tabler-icon-diamond-filled.svg

Paraphrase This Document

Need a fresh take? Get an instant paraphrase of this document with our AI Paraphraser
Document Page
STATISTICS 8
The weighted mean is given by:
weighted average= wx
w = 2.73
1.00 =2.73
The employee does not necessarily need a performance enhancement plan written since
his score is 2.73 which above the set score (2.5) below which a plan has to be written.
Section 3.2
Data provided for the length of rivers on the South Island of New Zealand flowing into
the Pacific Ocean. We need to find the mean, median, range, variance and standard deviation.
Solution
a. The mean is given by:
μ= n
n = 2492
19 =131.158
The median is the number that appears in the middle after arranging the data in ascending
order. It is 97
b. The range is the difference between the largest and the smallest value.
Document Page
STATISTICS 9
Range=maxmin
Range=32248=274
c. The variance is given by:
σ 2= ( xμ ) 2
n
σ 2=112182.5
19 =5904.34
d. The standard deviation is the square root of the variance:
σ = ( xμ )2
n = 5904.34=76.84
Question 12
The data for the yearly amounts (mm) in Sydney, Australia is provided and it’s to be used in:
a. Use technology to find mean and standard deviation
The step by step procedure for finding the mean and the standard deviation using
technology is as shown in the figure below. The mean is 134.3586, the sample standard
deviation is 67.866 and the population standard deviation is 62.124.
Document Page
STATISTICS 10
b. Use Chebyshev’s theorem to find an interval centered about the mean yearly
rainfall amount in which you expect at least 75% of the amounts of fall.
Based on the theorem, at least 75% of the data will fall in the interval μ2 σ ¿ μ+2 σ
Therefore, the interval will be:
μ2 σ=134.35862 ( 67.124 )=0.1106
μ+2 σ =134.3586+2 ( 67.124 )=268.6066
Hence the interval is from 0.1106 to 268.6066.
c. Use Chebyshev’s theorem to find an interval centered about the mean yearly
rainfall amount in which you expect at least 88.9% of the amounts of fall.
Based on the theorem, at least 88.9% of the data will fall in the interval μ3 σ ¿ μ+3 σ
Therefore, the interval will be:
μ3 σ=134.35863 ( 67.124 ) =67.0134
μ+2 σ =134.3586+3 ( 67.124 ) =335.7306
Hence the interval is from -67.0134 to 335.7306.
tabler-icon-diamond-filled.svg

Paraphrase This Document

Need a fresh take? Get an instant paraphrase of this document with our AI Paraphraser
Document Page
STATISTICS 11
References
Rugg, G., & Petre, M. (2007). A gentle guide to research methods. Maidenhead: Open
University Press.
Rumsey, D. (2007). Intermediate statistics for dummies (1st ed). Hoboken, N.J.: Wiley.
Shao, J. (2010). Mathematical statistics (2nd ed). New York: Springer.
Watkins, A. E., Scheaffer, R. L., & Cobb, G. W. (2009). Statistics in action: Understanding a
world of data (2nd ed). Hoboken, NJ: Wiley.
chevron_up_icon
1 out of 11
circle_padding
hide_on_mobile
zoom_out_icon
[object Object]