Statistics for Analytical Decisions: Statistical Analysis Homework

Verified

Added on  2021/05/31

|7
|1045
|35
Homework Assignment
AI Summary
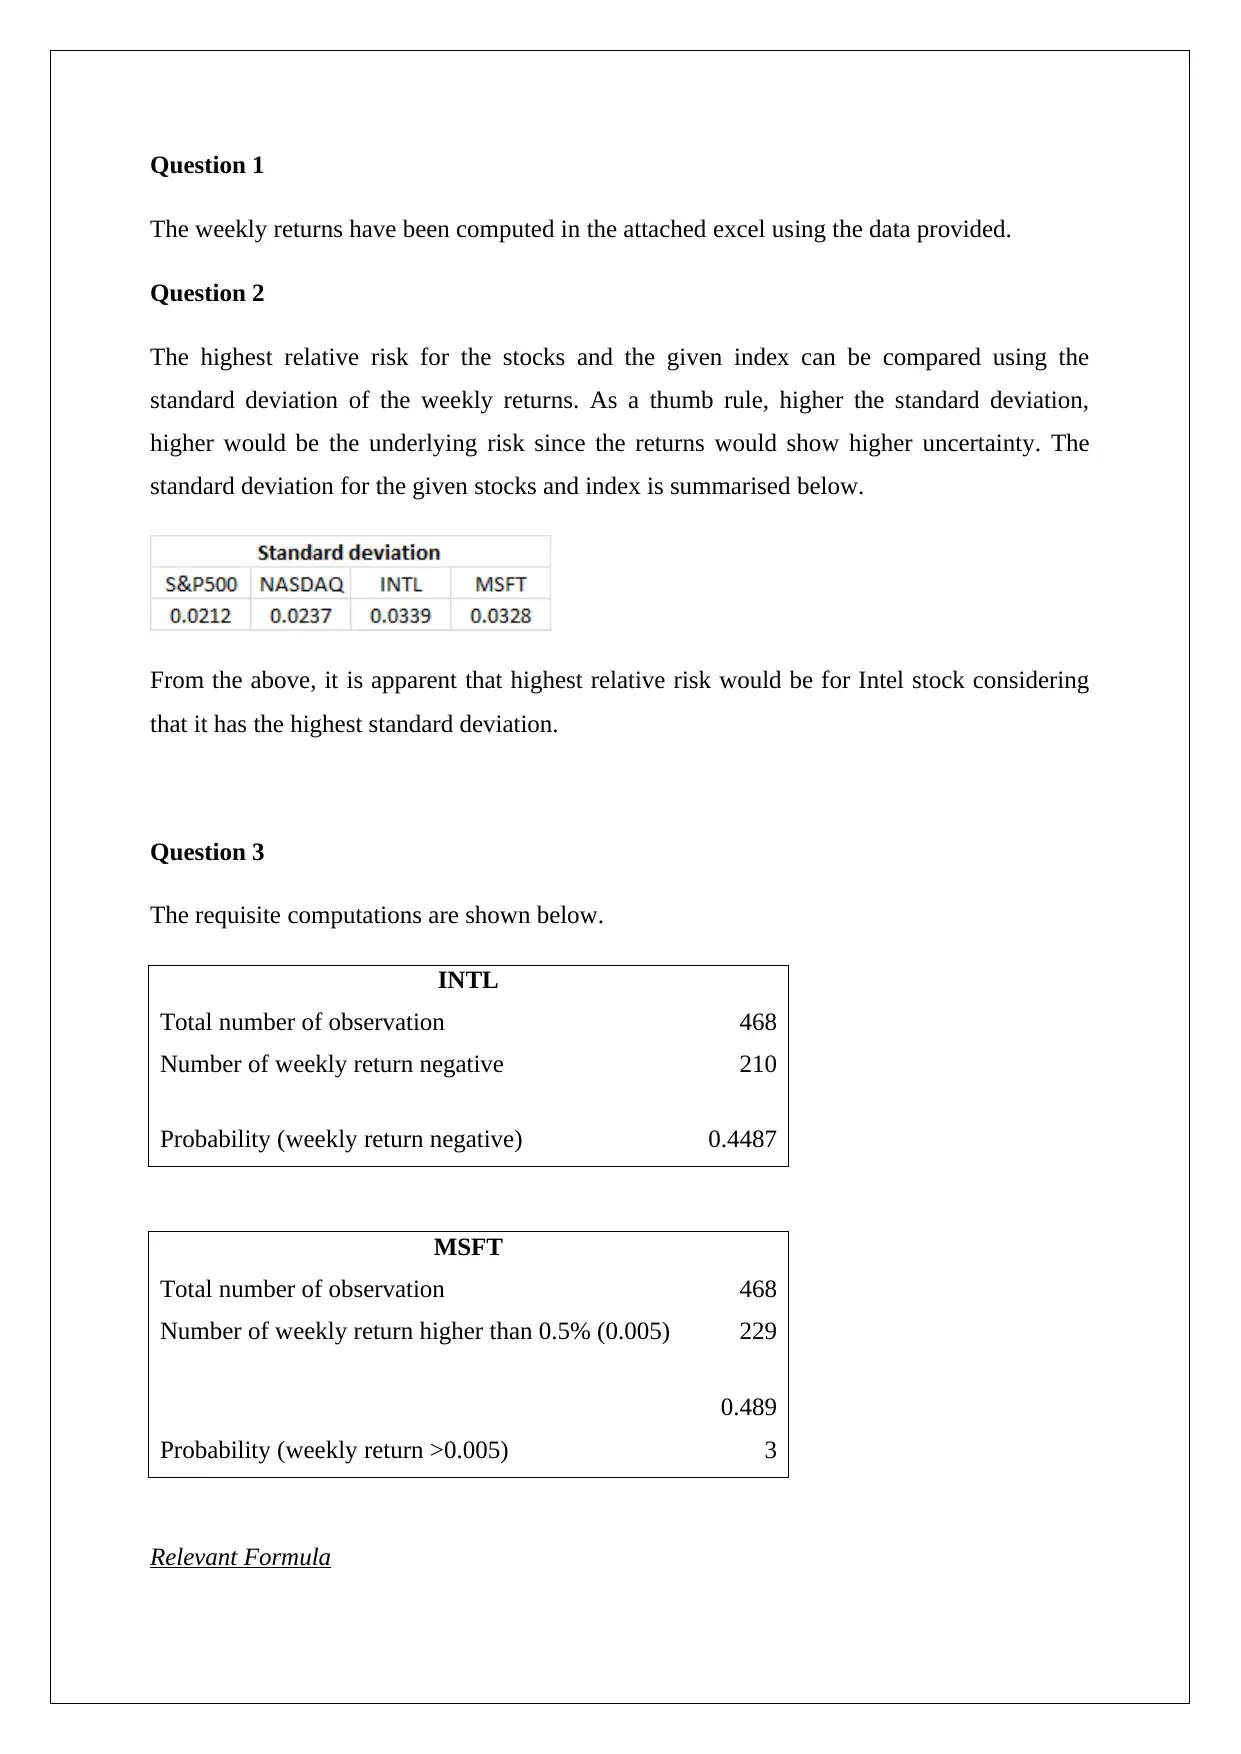
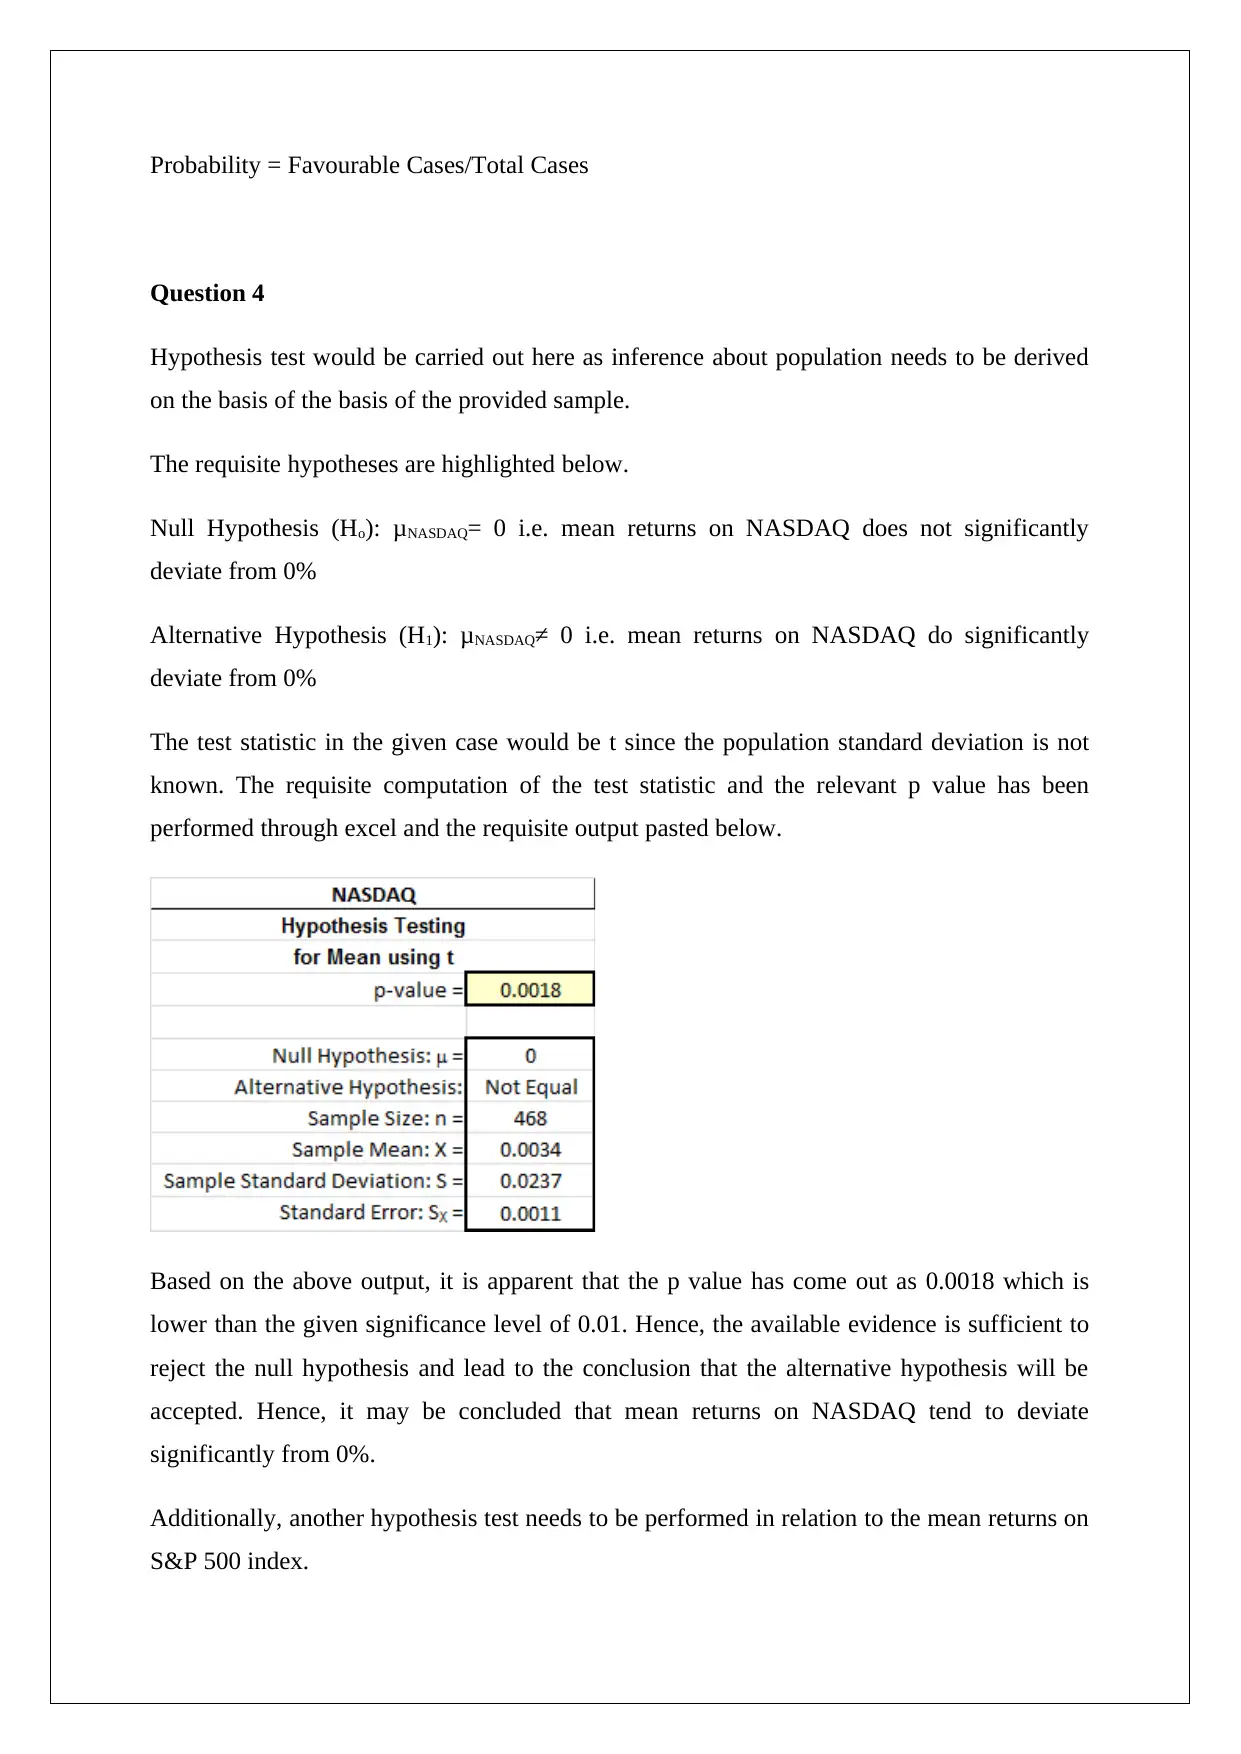
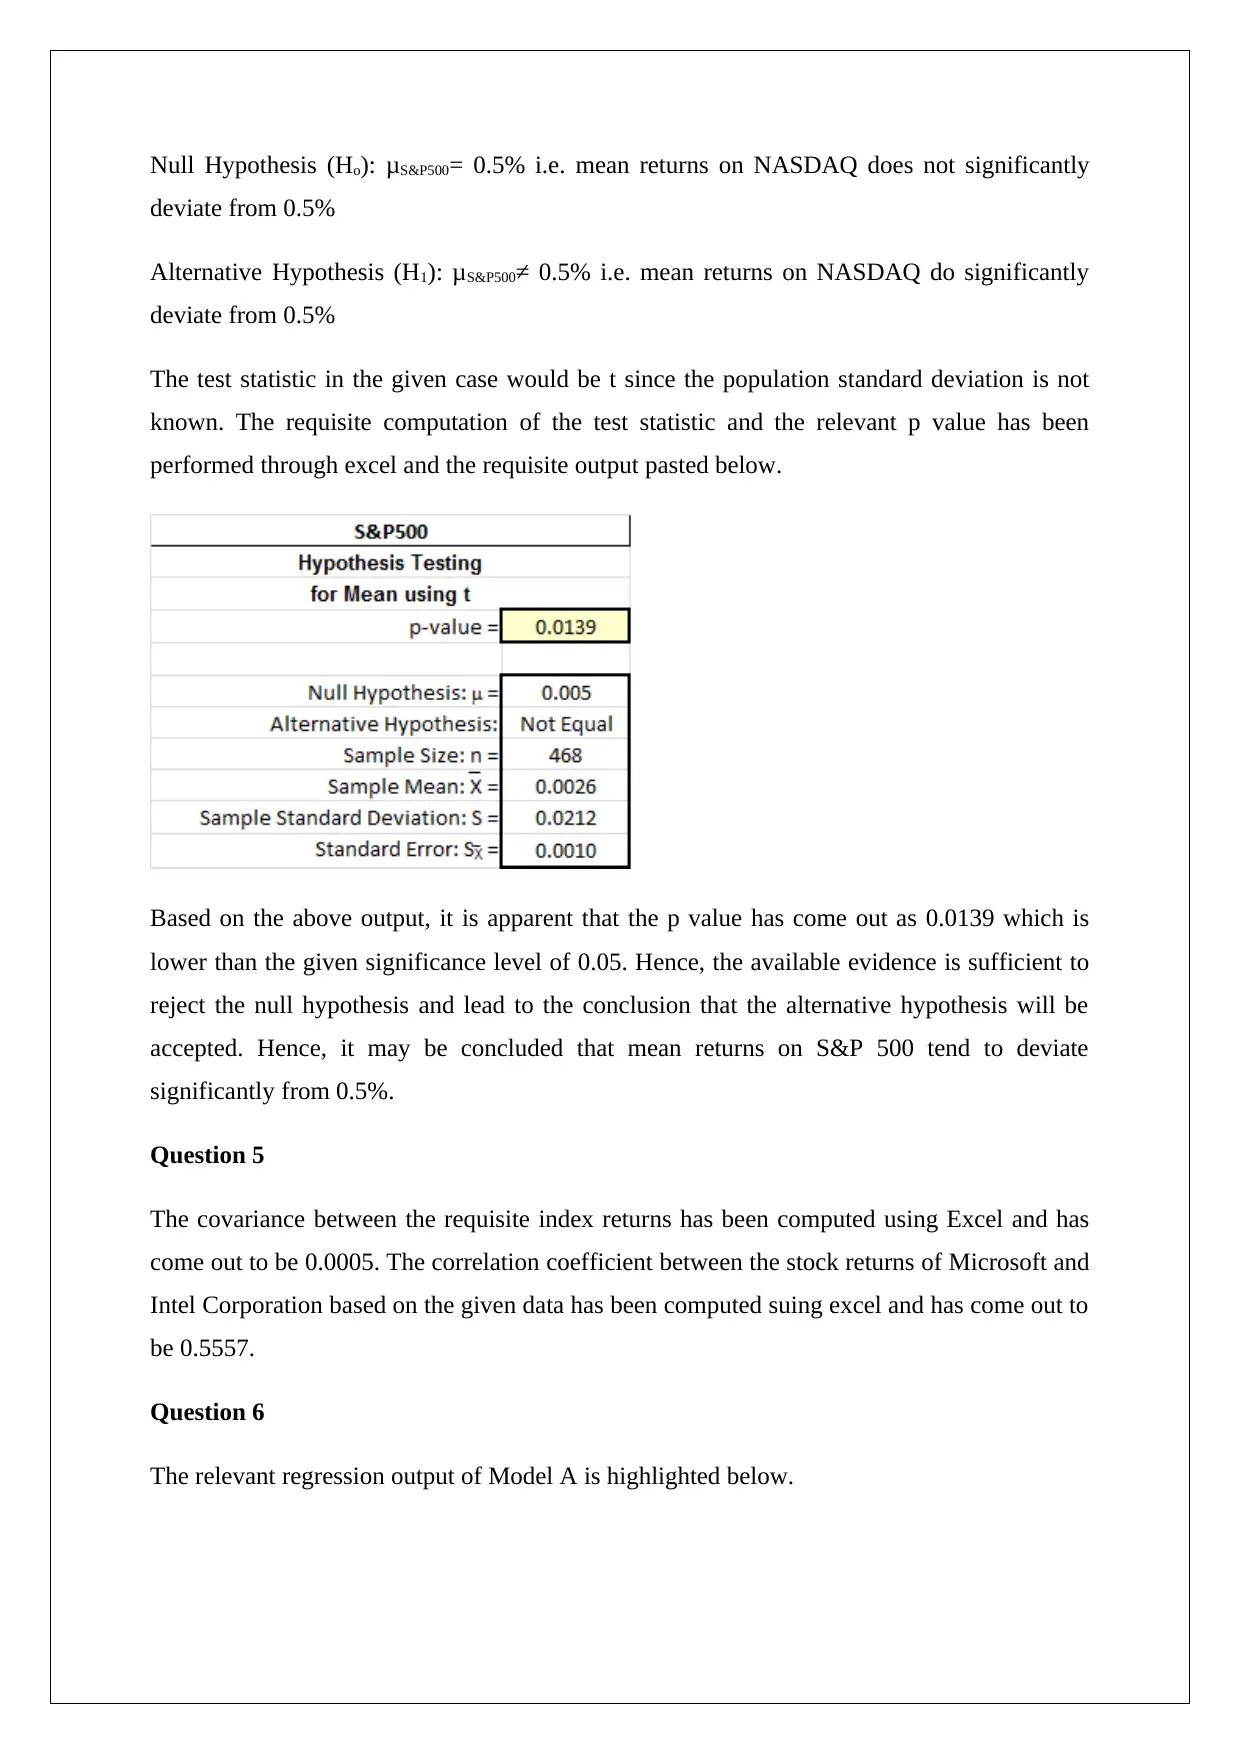
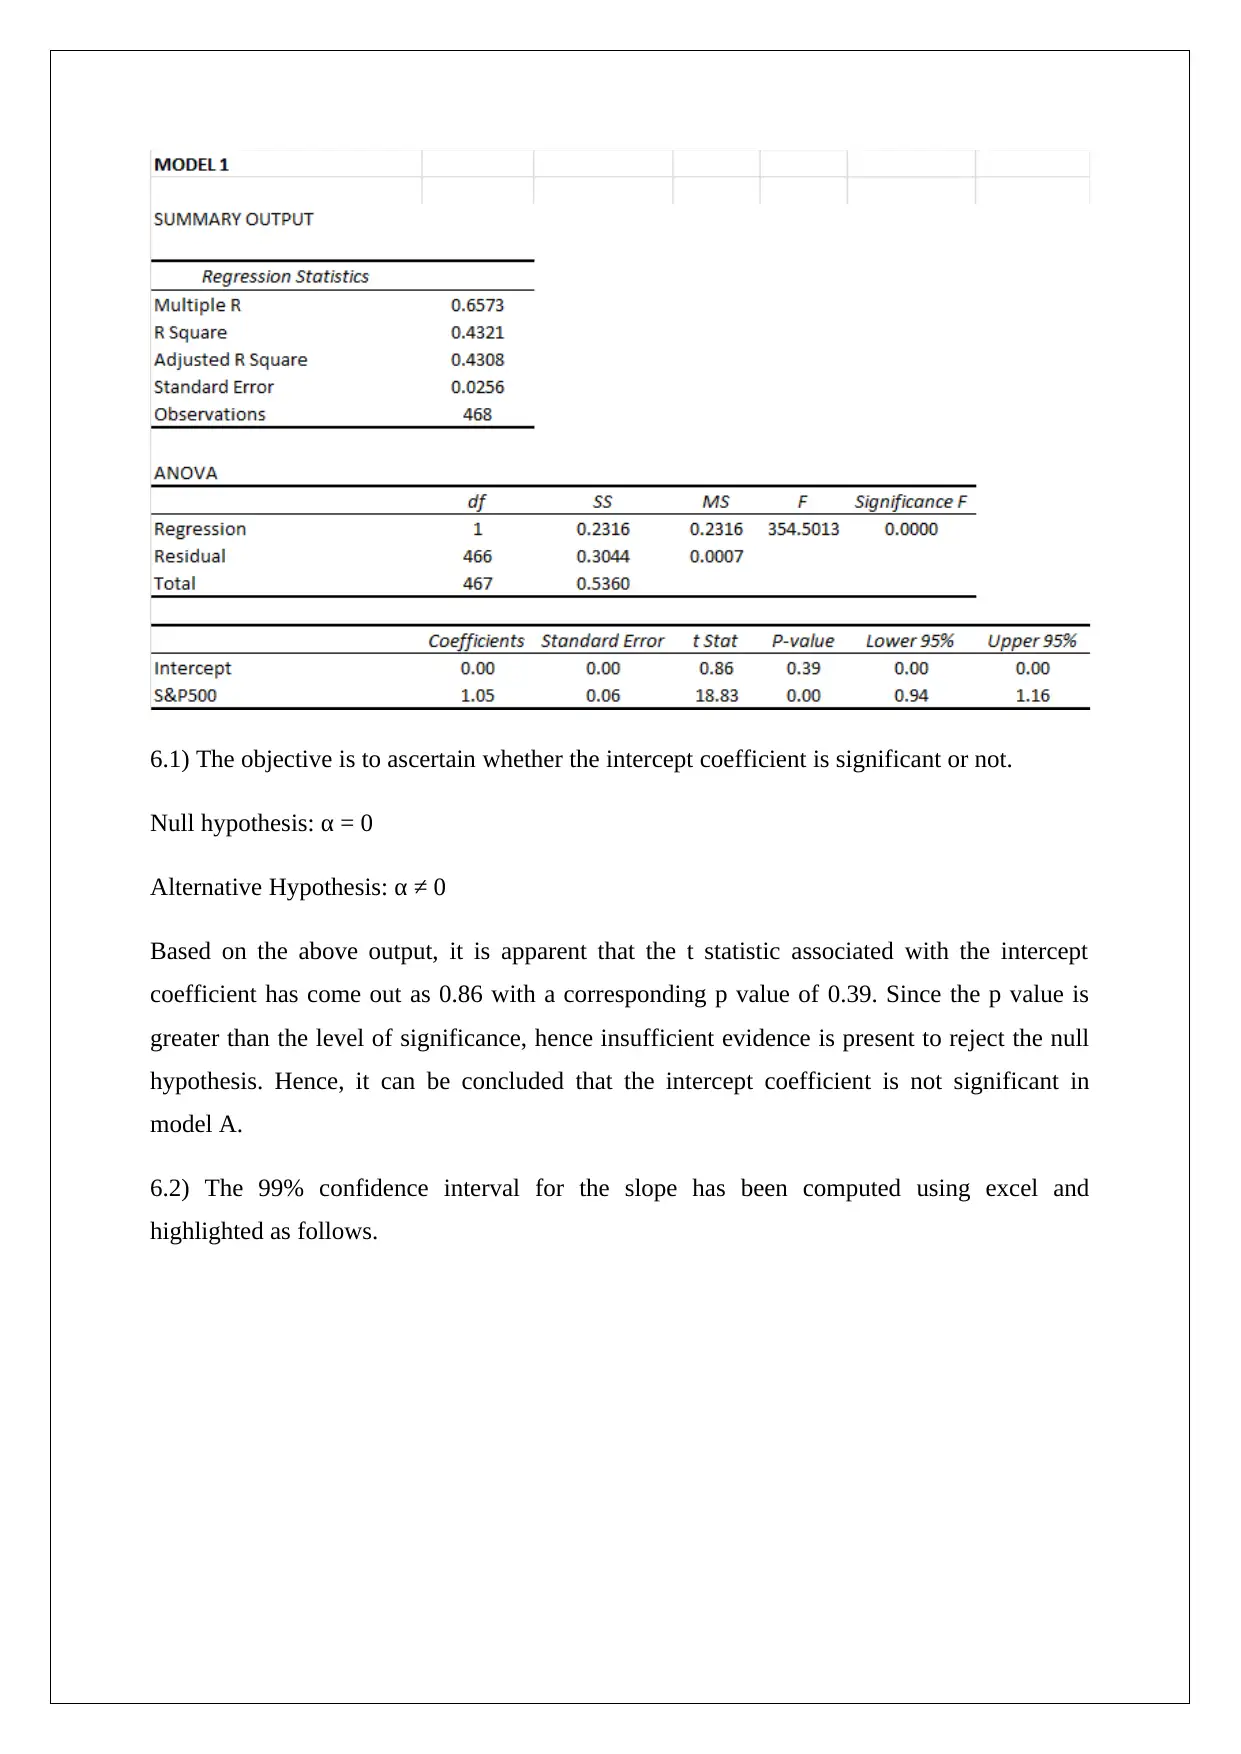
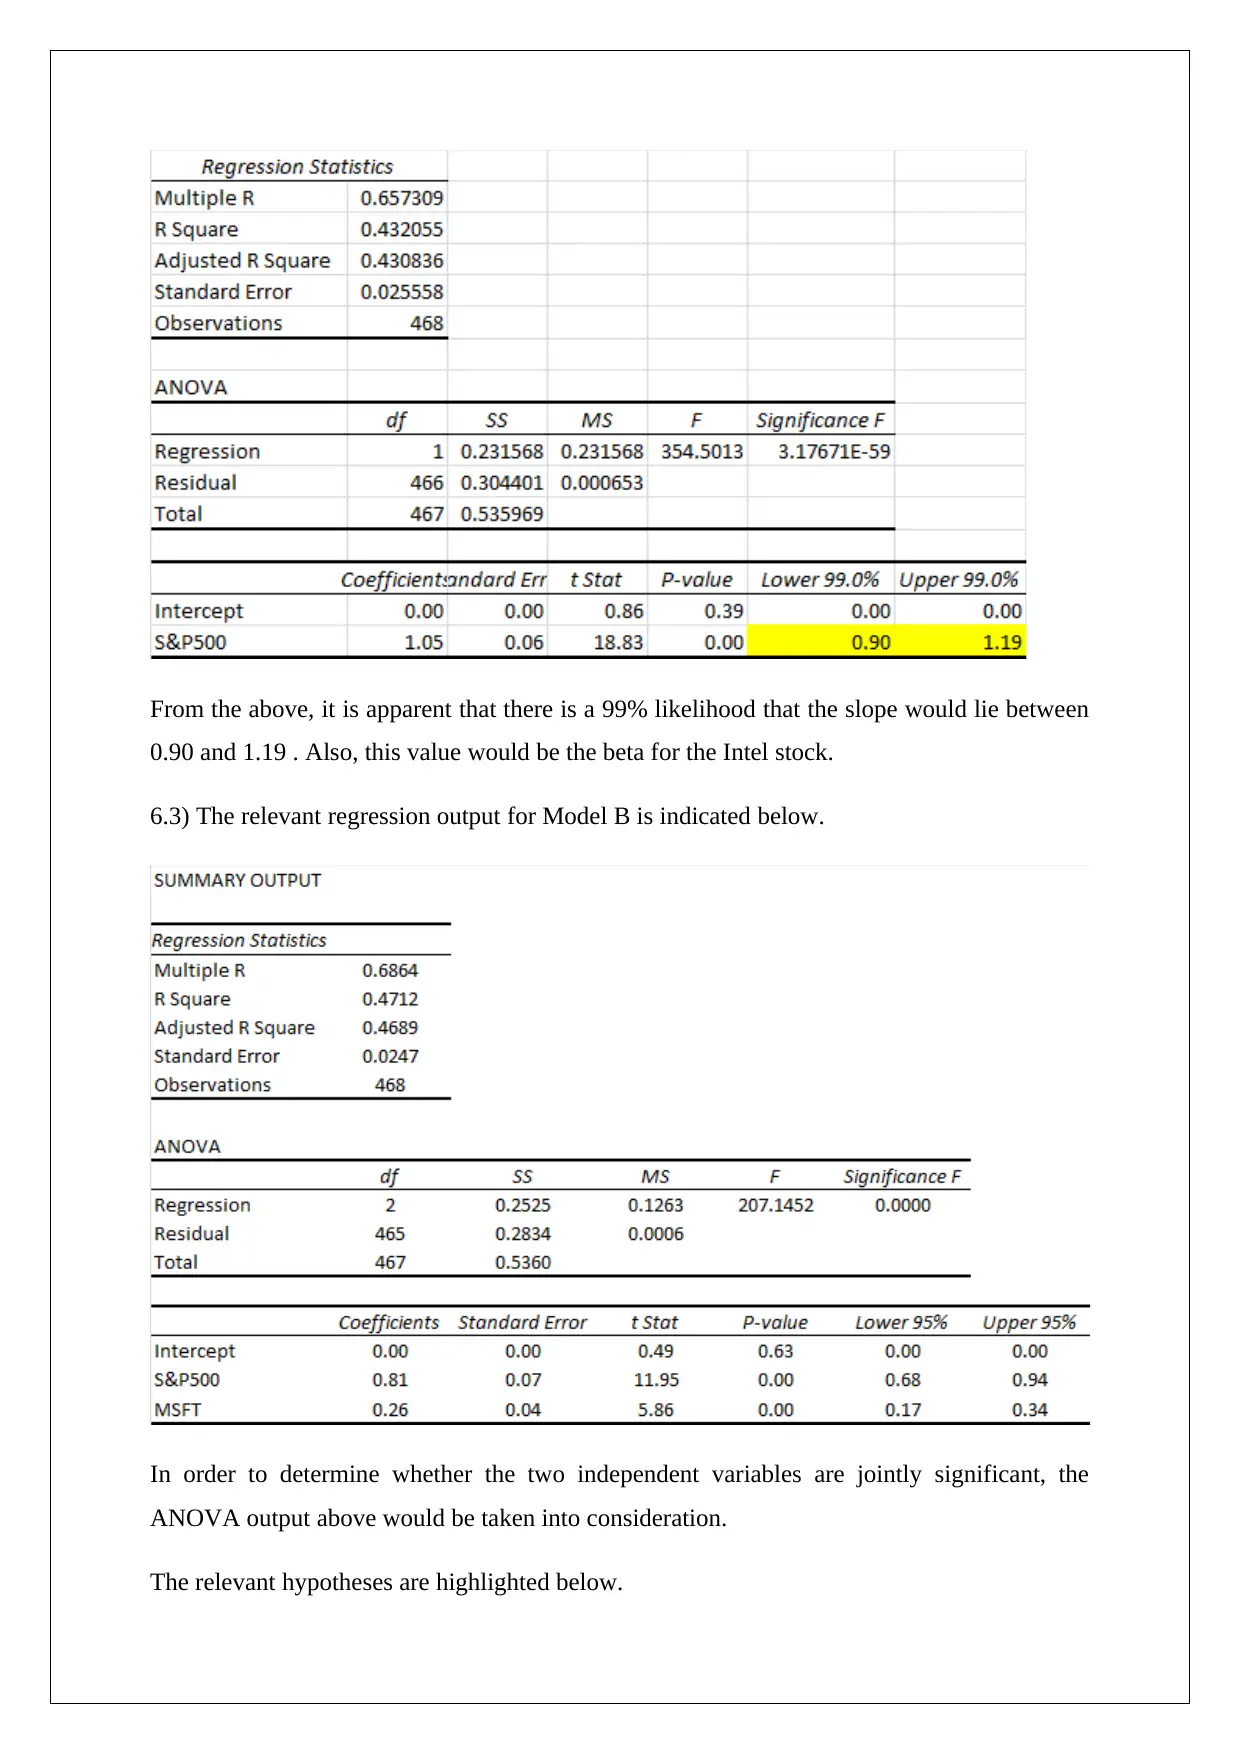
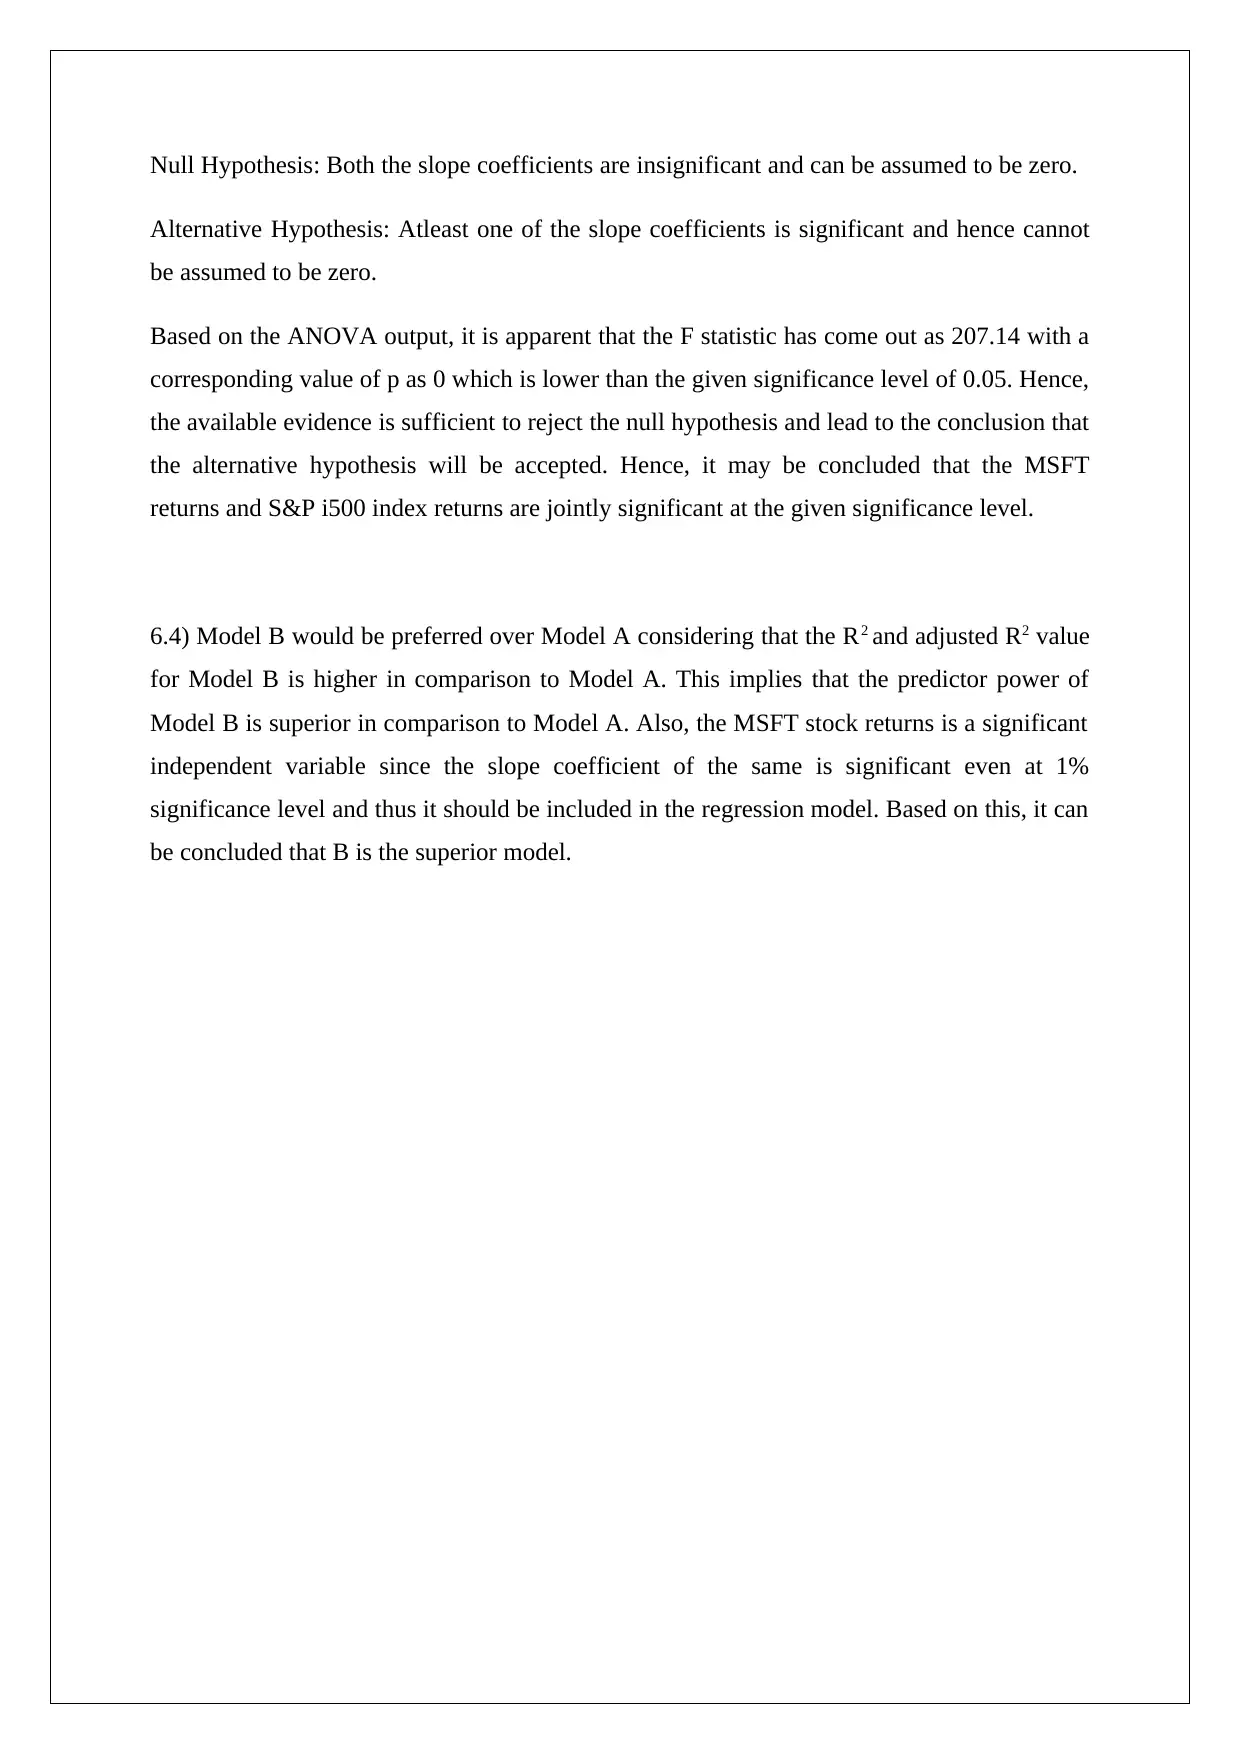
This document presents a complete solution to a statistics assignment focused on analytical decision-making. The assignment covers several key statistical concepts, including calculating weekly returns, assessing relative risk using standard deviation, and determining probabilities. It involves hypothesis testing on NASDAQ and S&P 500 returns, utilizing t-tests and p-values to draw conclusions. Furthermore, the solution explores covariance and correlation coefficients between stock returns. Regression analysis is performed using two models (A and B), evaluating the significance of intercept and slope coefficients, constructing confidence intervals, and comparing model performance based on R-squared values and ANOVA outputs. The analysis aims to determine the best model for predicting stock returns and assessing the joint significance of independent variables. This resource provides detailed calculations, interpretations, and conclusions, offering valuable insights into statistical analysis and its application in financial decision-making.
Document Page
STATISTICS FOR ANALYTICAL DECISIONS
STUDENT ID:
[Pick the date]
tabler-icon-diamond-filled.svg

Paraphrase This Document

Need a fresh take? Get an instant paraphrase of this document with our AI Paraphraser
Document Page
Question 1
The weekly returns have been computed in the attached excel using the data provided.
Question 2
The highest relative risk for the stocks and the given index can be compared using the
standard deviation of the weekly returns. As a thumb rule, higher the standard deviation,
higher would be the underlying risk since the returns would show higher uncertainty. The
standard deviation for the given stocks and index is summarised below.
From the above, it is apparent that highest relative risk would be for Intel stock considering
that it has the highest standard deviation.
Question 3
The requisite computations are shown below.
INTL
Total number of observation 468
Number of weekly return negative 210
Probability (weekly return negative) 0.4487
MSFT
Total number of observation 468
Number of weekly return higher than 0.5% (0.005) 229
Probability (weekly return >0.005)
0.489
3
Relevant Formula
Document Page
Probability = Favourable Cases/Total Cases
Question 4
Hypothesis test would be carried out here as inference about population needs to be derived
on the basis of the basis of the provided sample.
The requisite hypotheses are highlighted below.
Null Hypothesis (Ho): μNASDAQ= 0 i.e. mean returns on NASDAQ does not significantly
deviate from 0%
Alternative Hypothesis (H1): μNASDAQ≠ 0 i.e. mean returns on NASDAQ do significantly
deviate from 0%
The test statistic in the given case would be t since the population standard deviation is not
known. The requisite computation of the test statistic and the relevant p value has been
performed through excel and the requisite output pasted below.
Based on the above output, it is apparent that the p value has come out as 0.0018 which is
lower than the given significance level of 0.01. Hence, the available evidence is sufficient to
reject the null hypothesis and lead to the conclusion that the alternative hypothesis will be
accepted. Hence, it may be concluded that mean returns on NASDAQ tend to deviate
significantly from 0%.
Additionally, another hypothesis test needs to be performed in relation to the mean returns on
S&P 500 index.
Document Page
Null Hypothesis (Ho): μS&P500= 0.5% i.e. mean returns on NASDAQ does not significantly
deviate from 0.5%
Alternative Hypothesis (H1): μS&P500≠ 0.5% i.e. mean returns on NASDAQ do significantly
deviate from 0.5%
The test statistic in the given case would be t since the population standard deviation is not
known. The requisite computation of the test statistic and the relevant p value has been
performed through excel and the requisite output pasted below.
Based on the above output, it is apparent that the p value has come out as 0.0139 which is
lower than the given significance level of 0.05. Hence, the available evidence is sufficient to
reject the null hypothesis and lead to the conclusion that the alternative hypothesis will be
accepted. Hence, it may be concluded that mean returns on S&P 500 tend to deviate
significantly from 0.5%.
Question 5
The covariance between the requisite index returns has been computed using Excel and has
come out to be 0.0005. The correlation coefficient between the stock returns of Microsoft and
Intel Corporation based on the given data has been computed suing excel and has come out to
be 0.5557.
Question 6
The relevant regression output of Model A is highlighted below.
tabler-icon-diamond-filled.svg

Paraphrase This Document

Need a fresh take? Get an instant paraphrase of this document with our AI Paraphraser
Document Page
6.1) The objective is to ascertain whether the intercept coefficient is significant or not.
Null hypothesis: α = 0
Alternative Hypothesis: α ≠ 0
Based on the above output, it is apparent that the t statistic associated with the intercept
coefficient has come out as 0.86 with a corresponding p value of 0.39. Since the p value is
greater than the level of significance, hence insufficient evidence is present to reject the null
hypothesis. Hence, it can be concluded that the intercept coefficient is not significant in
model A.
6.2) The 99% confidence interval for the slope has been computed using excel and
highlighted as follows.
Document Page
From the above, it is apparent that there is a 99% likelihood that the slope would lie between
0.90 and 1.19 . Also, this value would be the beta for the Intel stock.
6.3) The relevant regression output for Model B is indicated below.
In order to determine whether the two independent variables are jointly significant, the
ANOVA output above would be taken into consideration.
The relevant hypotheses are highlighted below.
Document Page
Null Hypothesis: Both the slope coefficients are insignificant and can be assumed to be zero.
Alternative Hypothesis: Atleast one of the slope coefficients is significant and hence cannot
be assumed to be zero.
Based on the ANOVA output, it is apparent that the F statistic has come out as 207.14 with a
corresponding value of p as 0 which is lower than the given significance level of 0.05. Hence,
the available evidence is sufficient to reject the null hypothesis and lead to the conclusion that
the alternative hypothesis will be accepted. Hence, it may be concluded that the MSFT
returns and S&P i500 index returns are jointly significant at the given significance level.
6.4) Model B would be preferred over Model A considering that the R2 and adjusted R2 value
for Model B is higher in comparison to Model A. This implies that the predictor power of
Model B is superior in comparison to Model A. Also, the MSFT stock returns is a significant
independent variable since the slope coefficient of the same is significant even at 1%
significance level and thus it should be included in the regression model. Based on this, it can
be concluded that B is the superior model.
chevron_up_icon
1 out of 7
circle_padding
hide_on_mobile
zoom_out_icon
[object Object]