University Statistics: Regression Analysis Assignment, Semester 1
VerifiedAdded on 2022/08/18
|9
|906
|12
Homework Assignment
AI Summary
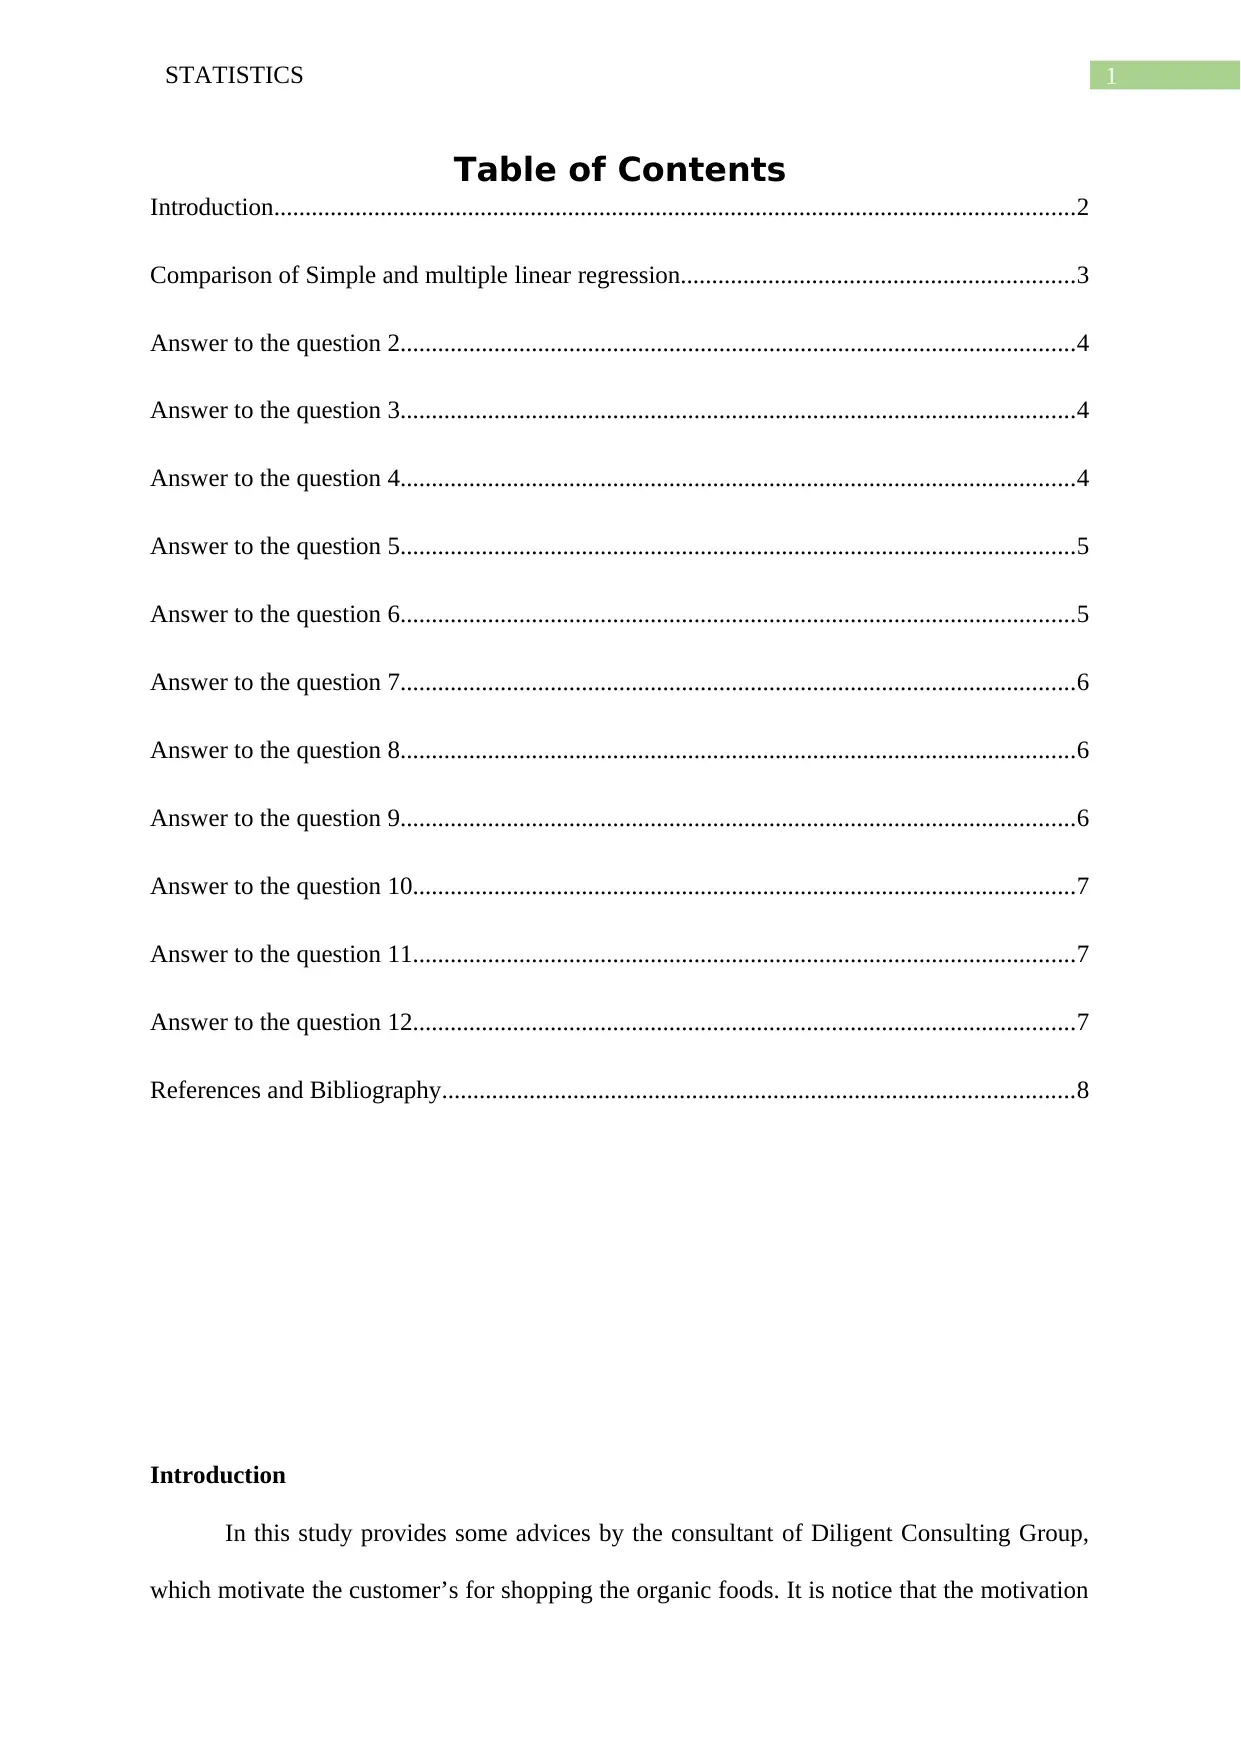
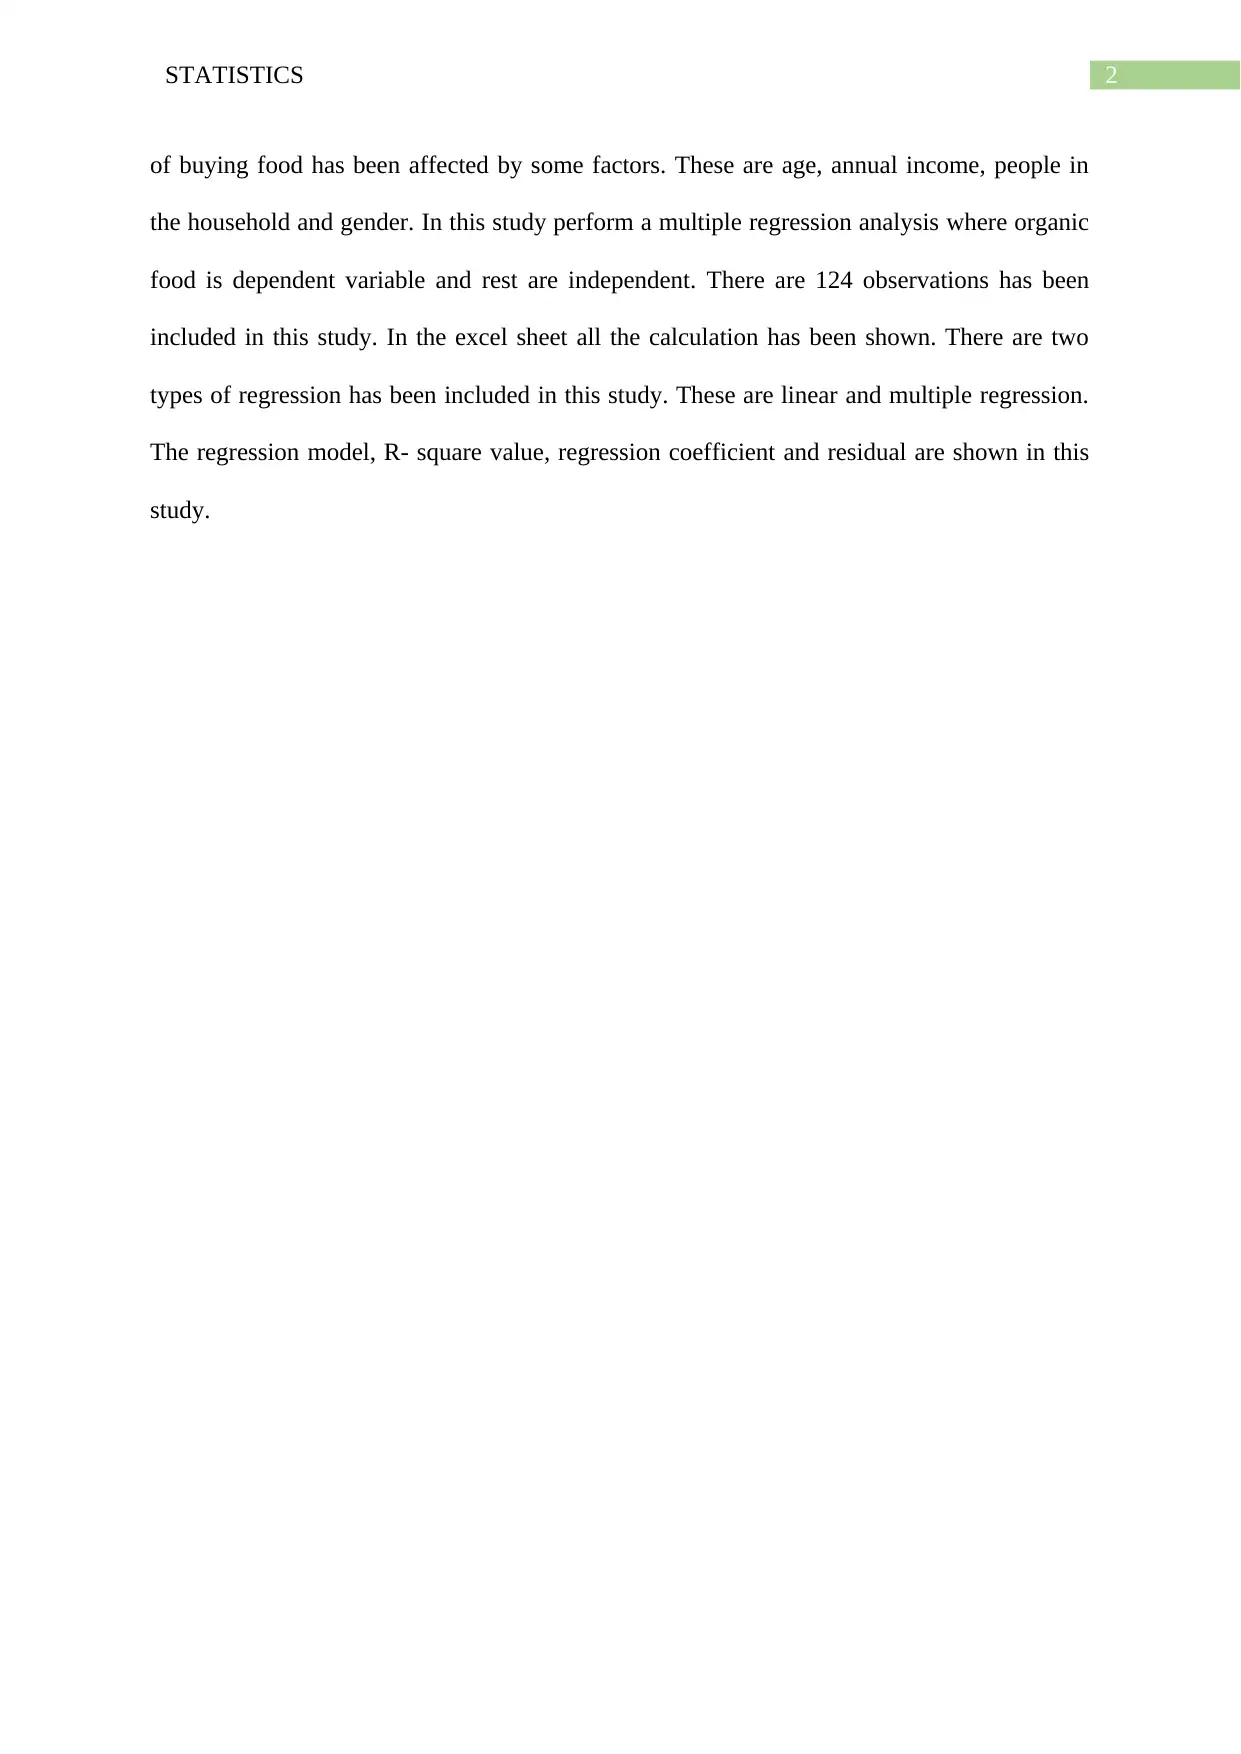
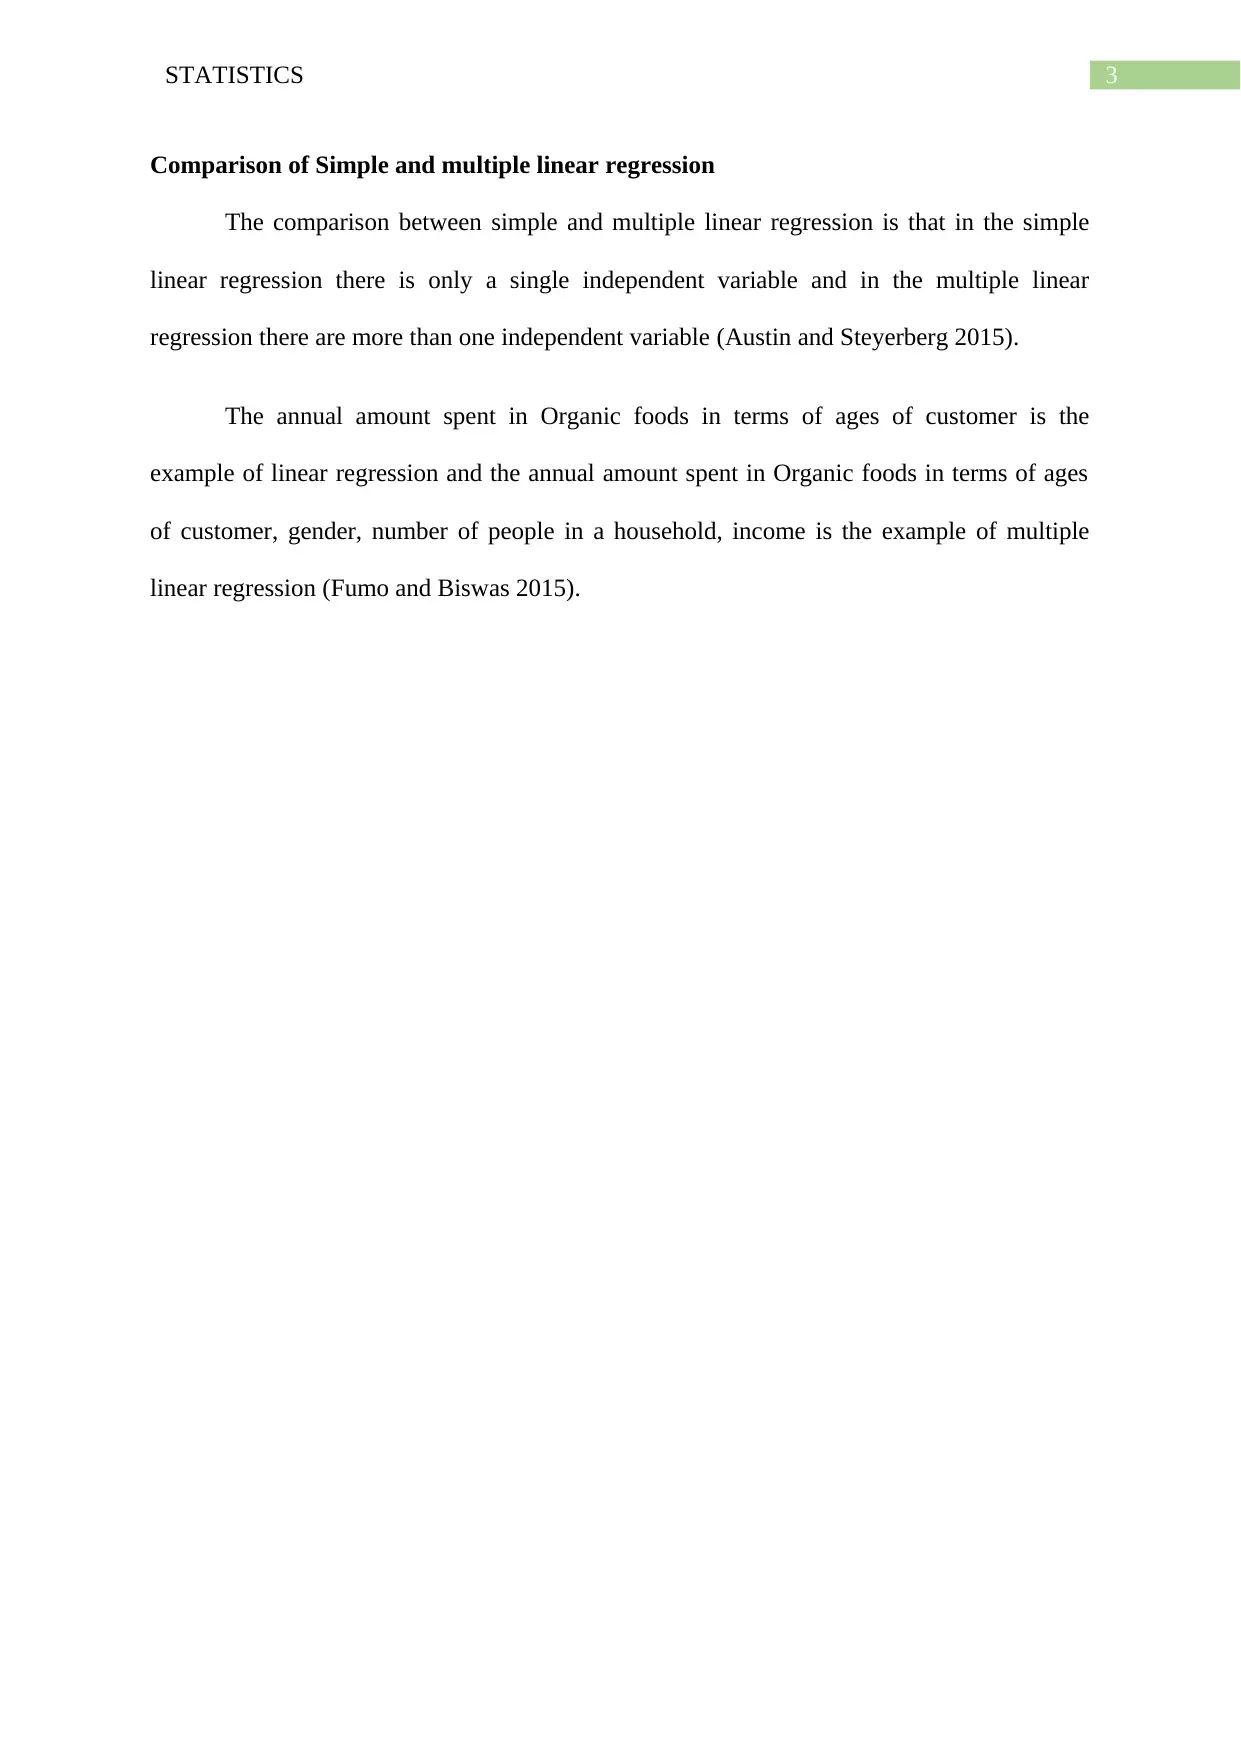
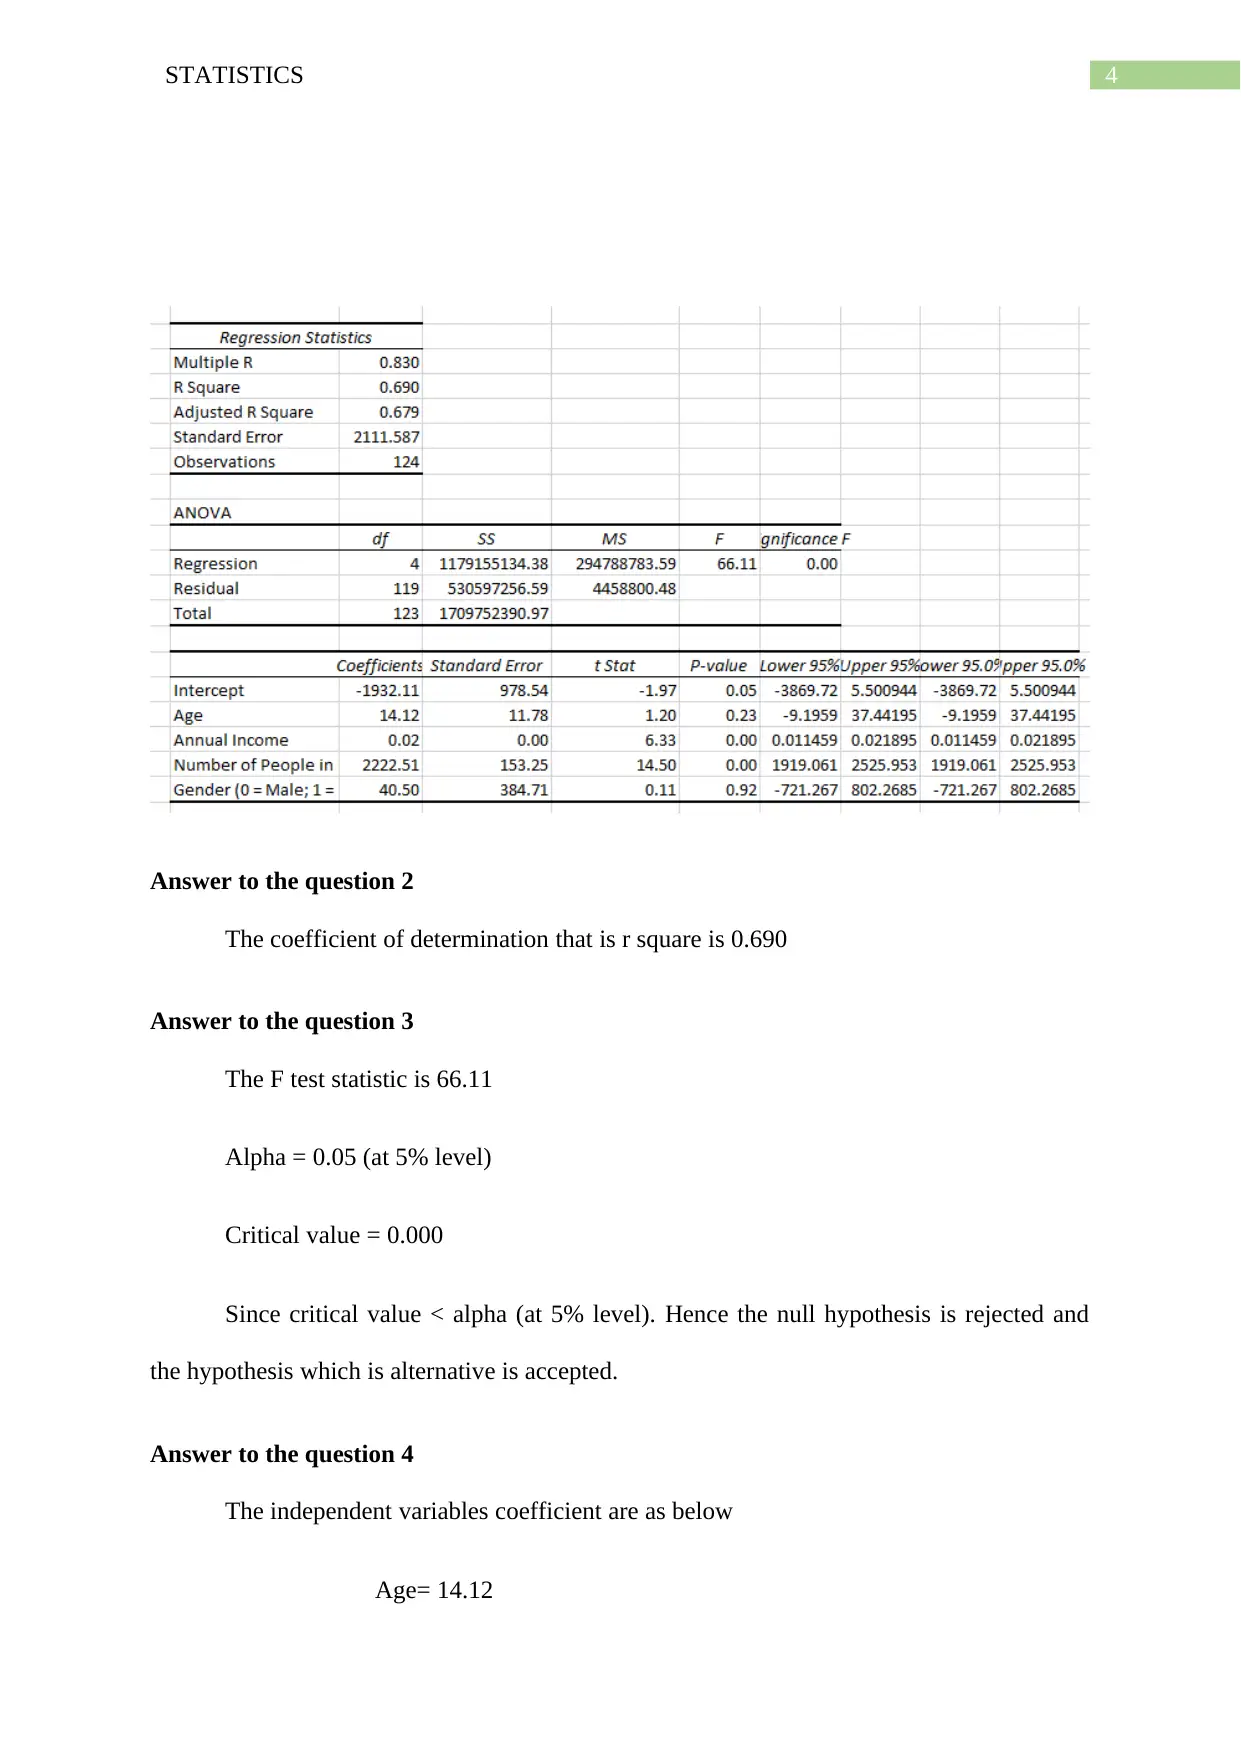
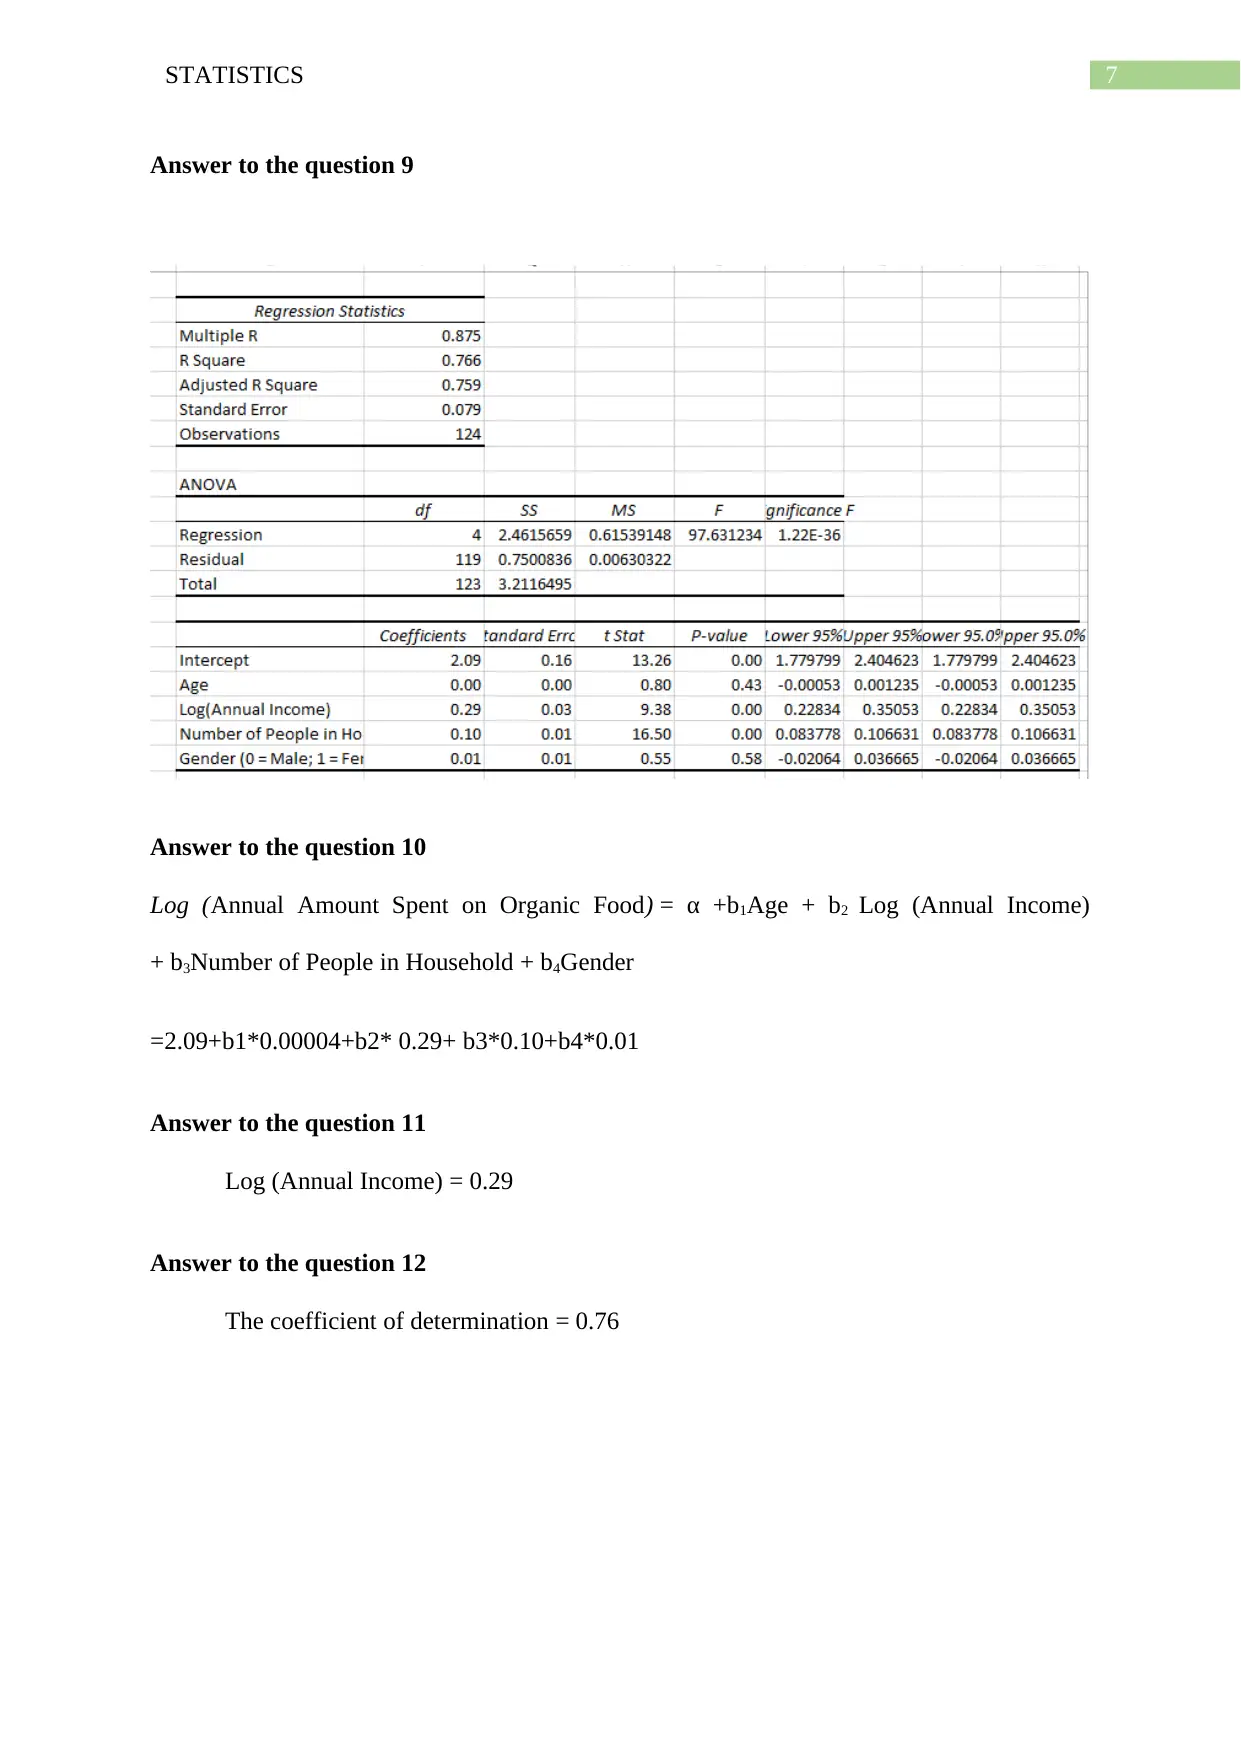
This document presents a comprehensive solution to a statistics assignment focused on regression analysis. The assignment explores both simple linear regression and multiple linear regression, comparing their methodologies and applications. It includes detailed answers to specific questions, such as the calculation and interpretation of the coefficient of determination (R-squared), the F-test statistic, and the coefficients of independent variables (age, annual income, number of people in the household, and gender). The solution also addresses hypothesis testing, including setting up null and alternative hypotheses and interpreting p-values to determine the significance of each independent variable. Furthermore, the assignment involves constructing a regression model, predicting the annual amount spent on organic food based on given inputs, and analyzing the differences in coefficients across different regression modules. The solution also examines a log-transformed regression model, focusing on the interpretation of coefficients and the coefficient of determination. The document concludes with a list of references used in the analysis.

Running head: STATISTICS
Statistics
Name of the Student:
Name of the University:
Author note:
Statistics
Name of the Student:
Name of the University:
Author note:
Paraphrase This Document
Need a fresh take? Get an instant paraphrase of this document with our AI Paraphraser

1STATISTICS
Table of Contents
Introduction................................................................................................................................2
Comparison of Simple and multiple linear regression...............................................................3
Answer to the question 2............................................................................................................4
Answer to the question 3............................................................................................................4
Answer to the question 4............................................................................................................4
Answer to the question 5............................................................................................................5
Answer to the question 6............................................................................................................5
Answer to the question 7............................................................................................................6
Answer to the question 8............................................................................................................6
Answer to the question 9............................................................................................................6
Answer to the question 10..........................................................................................................7
Answer to the question 11..........................................................................................................7
Answer to the question 12..........................................................................................................7
References and Bibliography.....................................................................................................8
Introduction
In this study provides some advices by the consultant of Diligent Consulting Group,
which motivate the customer’s for shopping the organic foods. It is notice that the motivation

2STATISTICS
of buying food has been affected by some factors. These are age, annual income, people in
the household and gender. In this study perform a multiple regression analysis where organic
food is dependent variable and rest are independent. There are 124 observations has been
included in this study. In the excel sheet all the calculation has been shown. There are two
types of regression has been included in this study. These are linear and multiple regression.
The regression model, R- square value, regression coefficient and residual are shown in this
study.
⊘ This is a preview!⊘
Do you want full access?
Subscribe today to unlock all pages.

Trusted by 1+ million students worldwide

3STATISTICS
Comparison of Simple and multiple linear regression
The comparison between simple and multiple linear regression is that in the simple
linear regression there is only a single independent variable and in the multiple linear
regression there are more than one independent variable (Austin and Steyerberg 2015).
The annual amount spent in Organic foods in terms of ages of customer is the
example of linear regression and the annual amount spent in Organic foods in terms of ages
of customer, gender, number of people in a household, income is the example of multiple
linear regression (Fumo and Biswas 2015).
Paraphrase This Document
Need a fresh take? Get an instant paraphrase of this document with our AI Paraphraser

4STATISTICS
Answer to the question 2
The coefficient of determination that is r square is 0.690
Answer to the question 3
The F test statistic is 66.11
Alpha = 0.05 (at 5% level)
Critical value = 0.000
Since critical value < alpha (at 5% level). Hence the null hypothesis is rejected and
the hypothesis which is alternative is accepted.
Answer to the question 4
The independent variables coefficient are as below
Age= 14.12

5STATISTICS
Annual income= 0.02
Number of people in the household = 2222.51
Gender = 40.50
Answer to the question 5
The P- Value for age = 0.23
The P- Value for annual income = 0.00
The P- value for number of people in the household= 0.00
The P- value for gender = 0.92
It has been seen that the P-Value for annual income and number people in the
household is less than the alpha at 5% significance level. Hence the null hypothesis for
annual income and number people in the household is rejected and the alternative hypothesis
is accepted. Similarly it has been seen that the critical or P- Value for age and gender is larger
than the alpha at 5% significance level. Thus the null hypothesis for age and gender is
accepted and the alternative hypothesis is rejected.
Answer to the question 6
The regression model is
Y= 14.12*X1+0.02*X2+2222.51*X3+40.50*X4-1932.11
Here Y = Annual amount spent in Organic foods
X1= Age
X2= Annual income
⊘ This is a preview!⊘
Do you want full access?
Subscribe today to unlock all pages.

Trusted by 1+ million students worldwide

6STATISTICS
X3= Number of people in the household
X4= Gender
Answer to the question 7
Annual amount spent on organic food= 14.12*X1+0.02*X2+2222.51*X3+40.50*X4-
1932.11
= 14.12*48.23+0.02*161006.6+2222.51*4.3+40.50*62-1932.11
= 13502.066
Answer to the question 8
In the module 3 the coefficient of age variable = 26.29
In the module 4 the coefficient of age variable = 14.12
Yes, there is a difference between the coefficient of age variable in the linear
regression and the multiple linear regression.
Paraphrase This Document
Need a fresh take? Get an instant paraphrase of this document with our AI Paraphraser

7STATISTICS
Answer to the question 9
Answer to the question 10
Log (Annual Amount Spent on Organic Food) = α +b1Age + b2 Log (Annual Income)
+ b3Number of People in Household + b4Gender
=2.09+b1*0.00004+b2* 0.29+ b3*0.10+b4*0.01
Answer to the question 11
Log (Annual Income) = 0.29
Answer to the question 12
The coefficient of determination = 0.76

8STATISTICS
References and Bibliography
Austin, P.C. and Steyerberg, E.W., 2015. The number of subjects per variable required in
linear regression analyses. Journal of clinical epidemiology, 68(6), pp.627-636.
Cohen, P., West, S.G. and Aiken, L.S., 2014. Applied multiple regression/correlation
analysis for the behavioral sciences. Psychology Press.
Fumo, N. and Biswas, M.R., 2015. Regression analysis for prediction of residential energy
consumption. Renewable and sustainable energy reviews, 47, pp.332-343.
Jeon, J., 2015. The strengths and limitations of the statistical modeling of complex social
phenomenon: Focusing on SEM, path analysis, or multiple regression models. Int J Soc
Behav Educ Econ Bus Ind Eng, 9(5), pp.1594-1602.
⊘ This is a preview!⊘
Do you want full access?
Subscribe today to unlock all pages.

Trusted by 1+ million students worldwide
1 out of 9
Related Documents

Your All-in-One AI-Powered Toolkit for Academic Success.
+13062052269
info@desklib.com
Available 24*7 on WhatsApp / Email
Unlock your academic potential
Copyright © 2020–2025 A2Z Services. All Rights Reserved. Developed and managed by ZUCOL.