Statistics and Probability Assignment: Solutions and Analysis

Verified

Added on  2021/12/11

|3
|518
|258
Homework Assignment
AI Summary
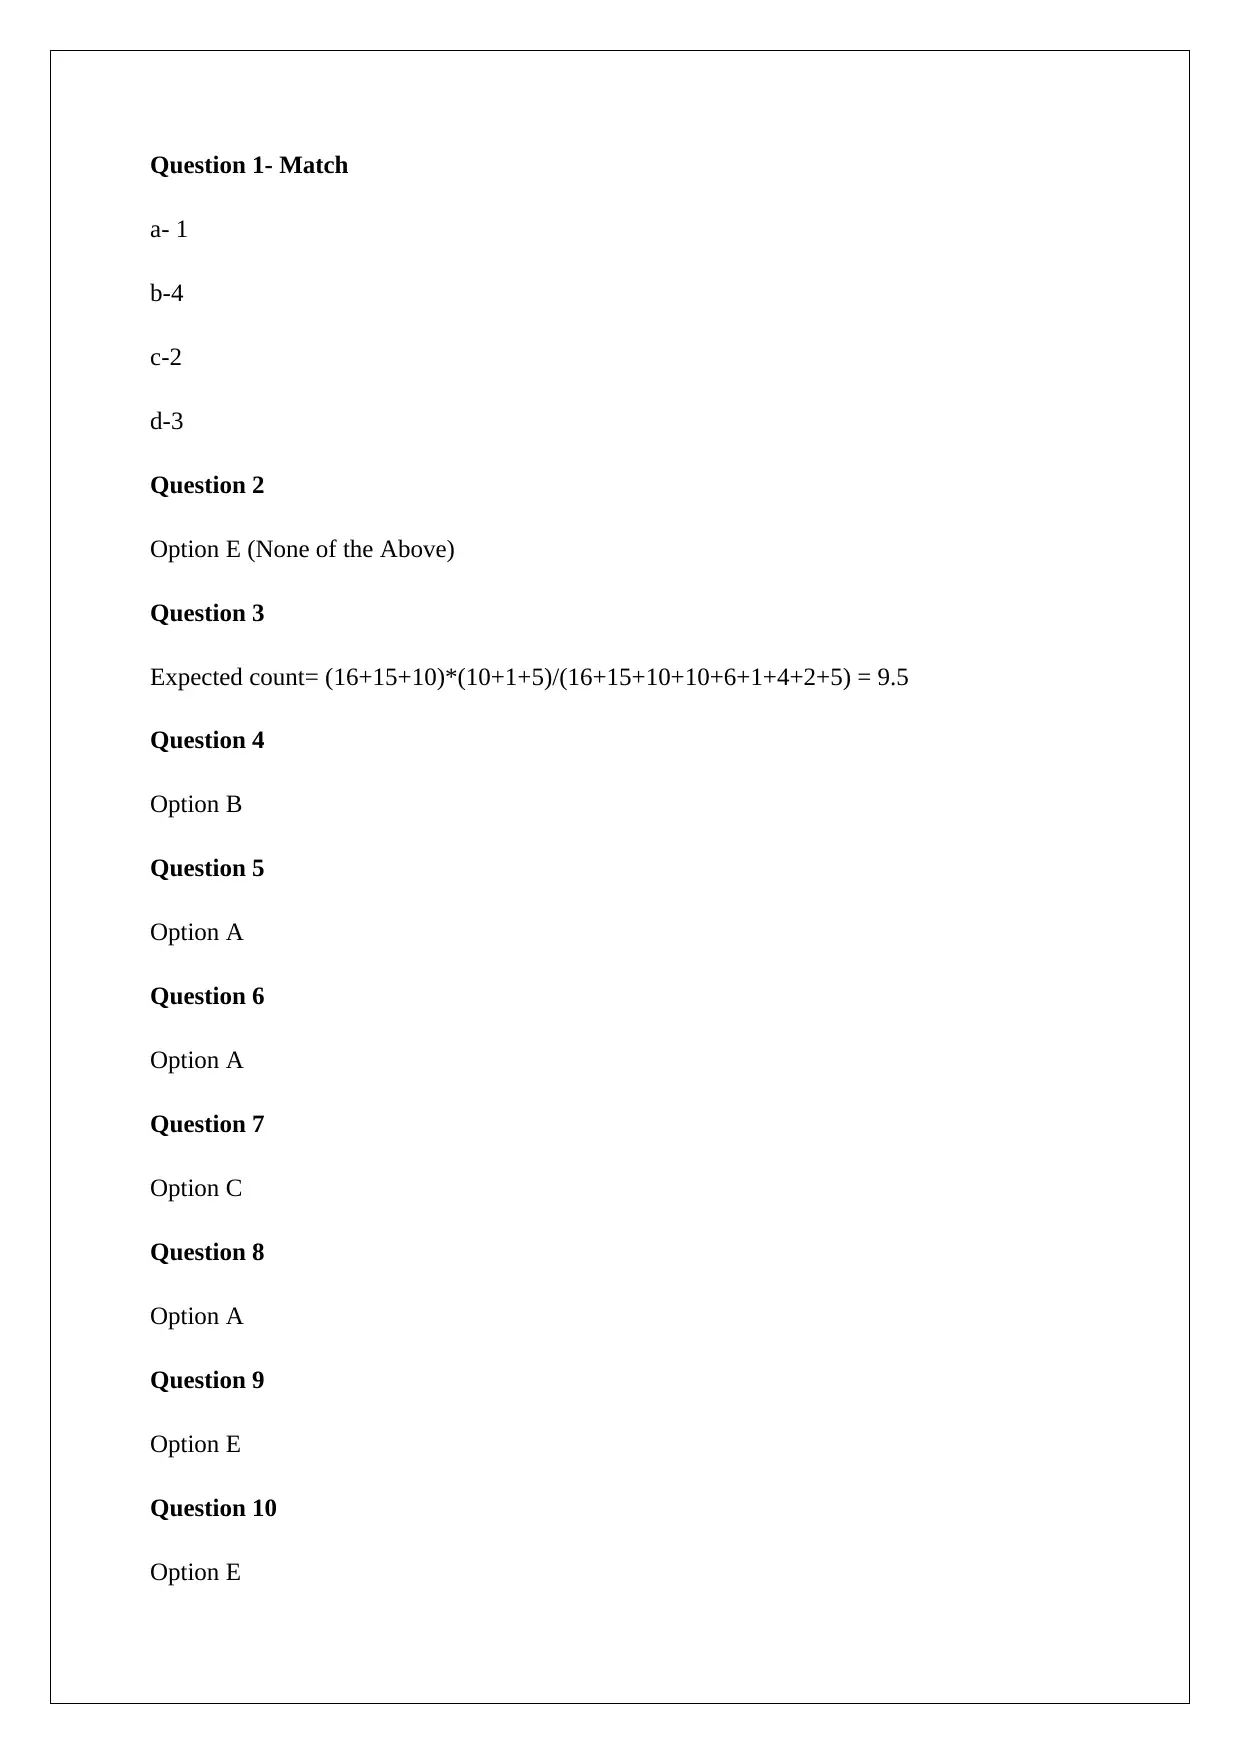
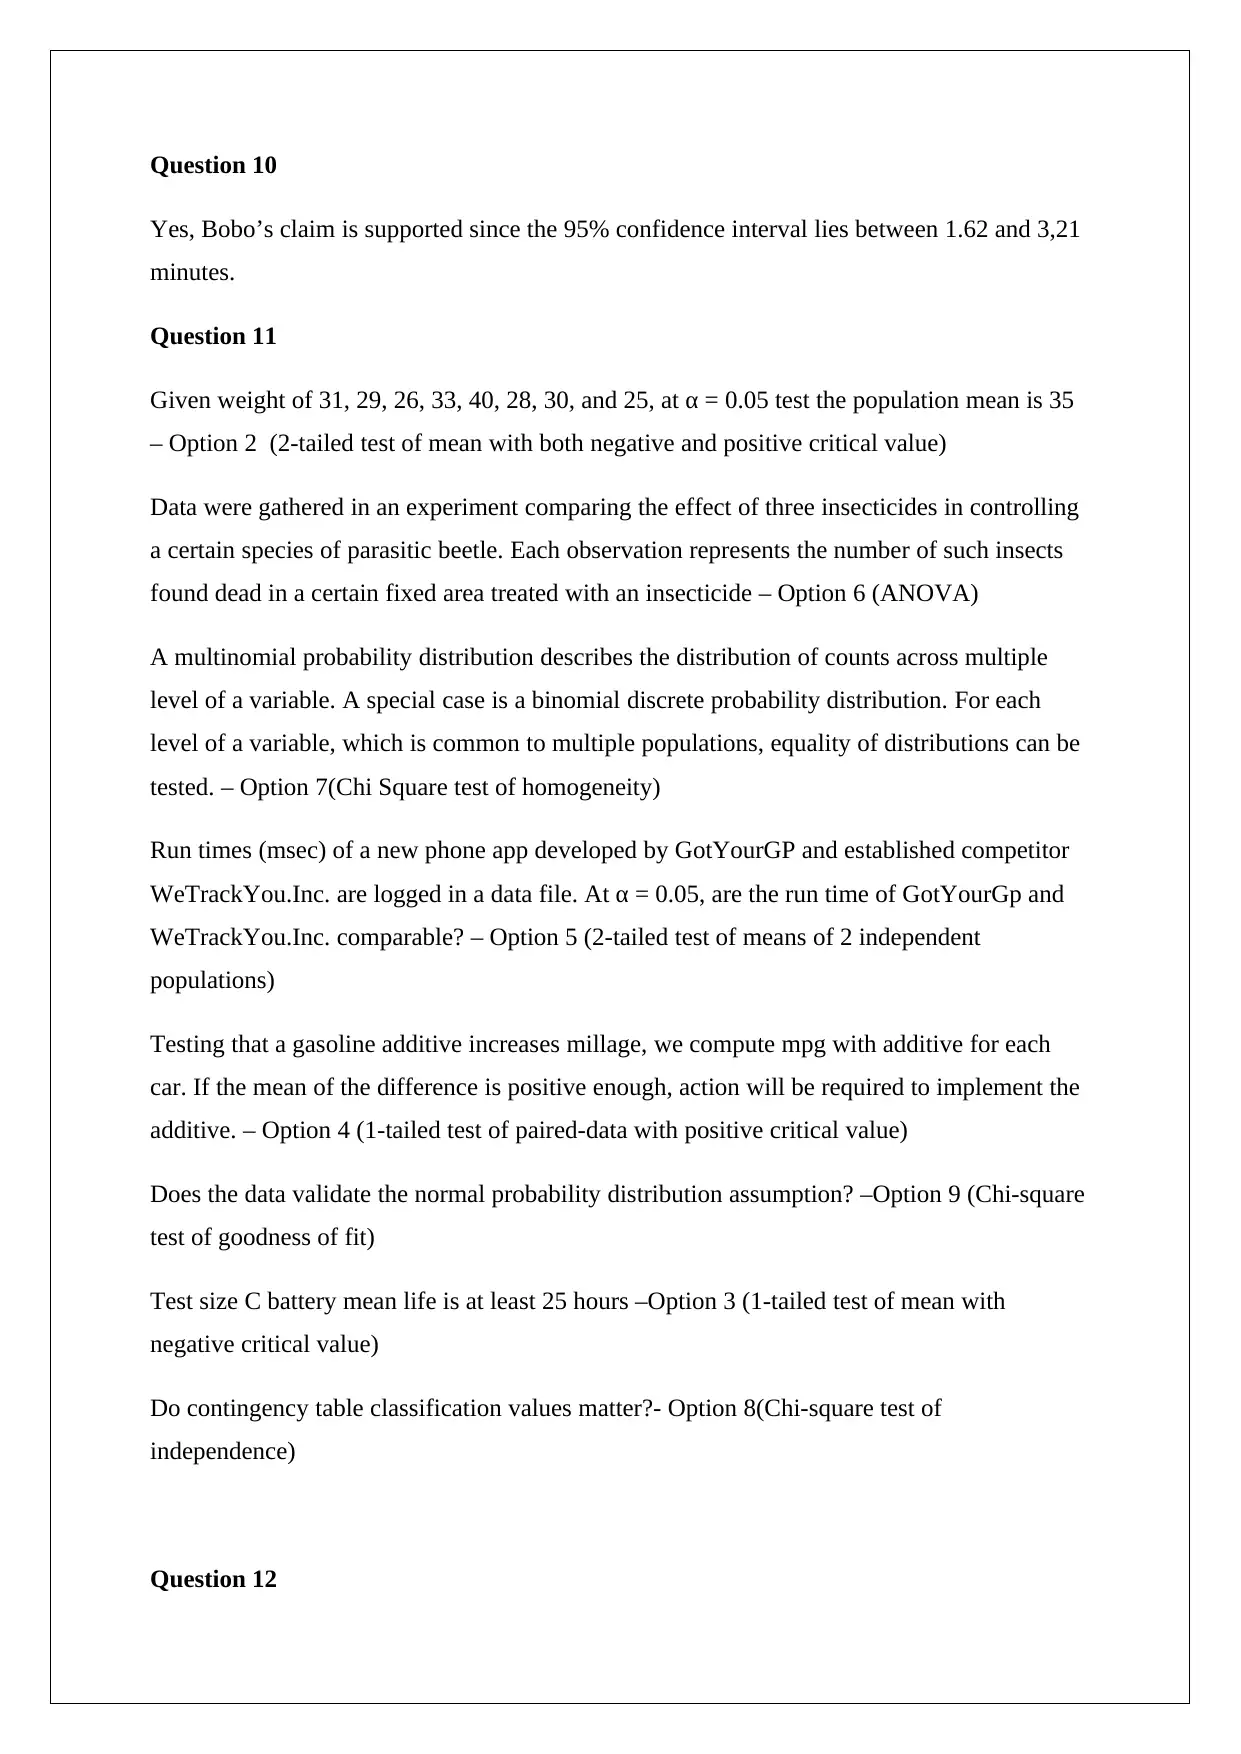
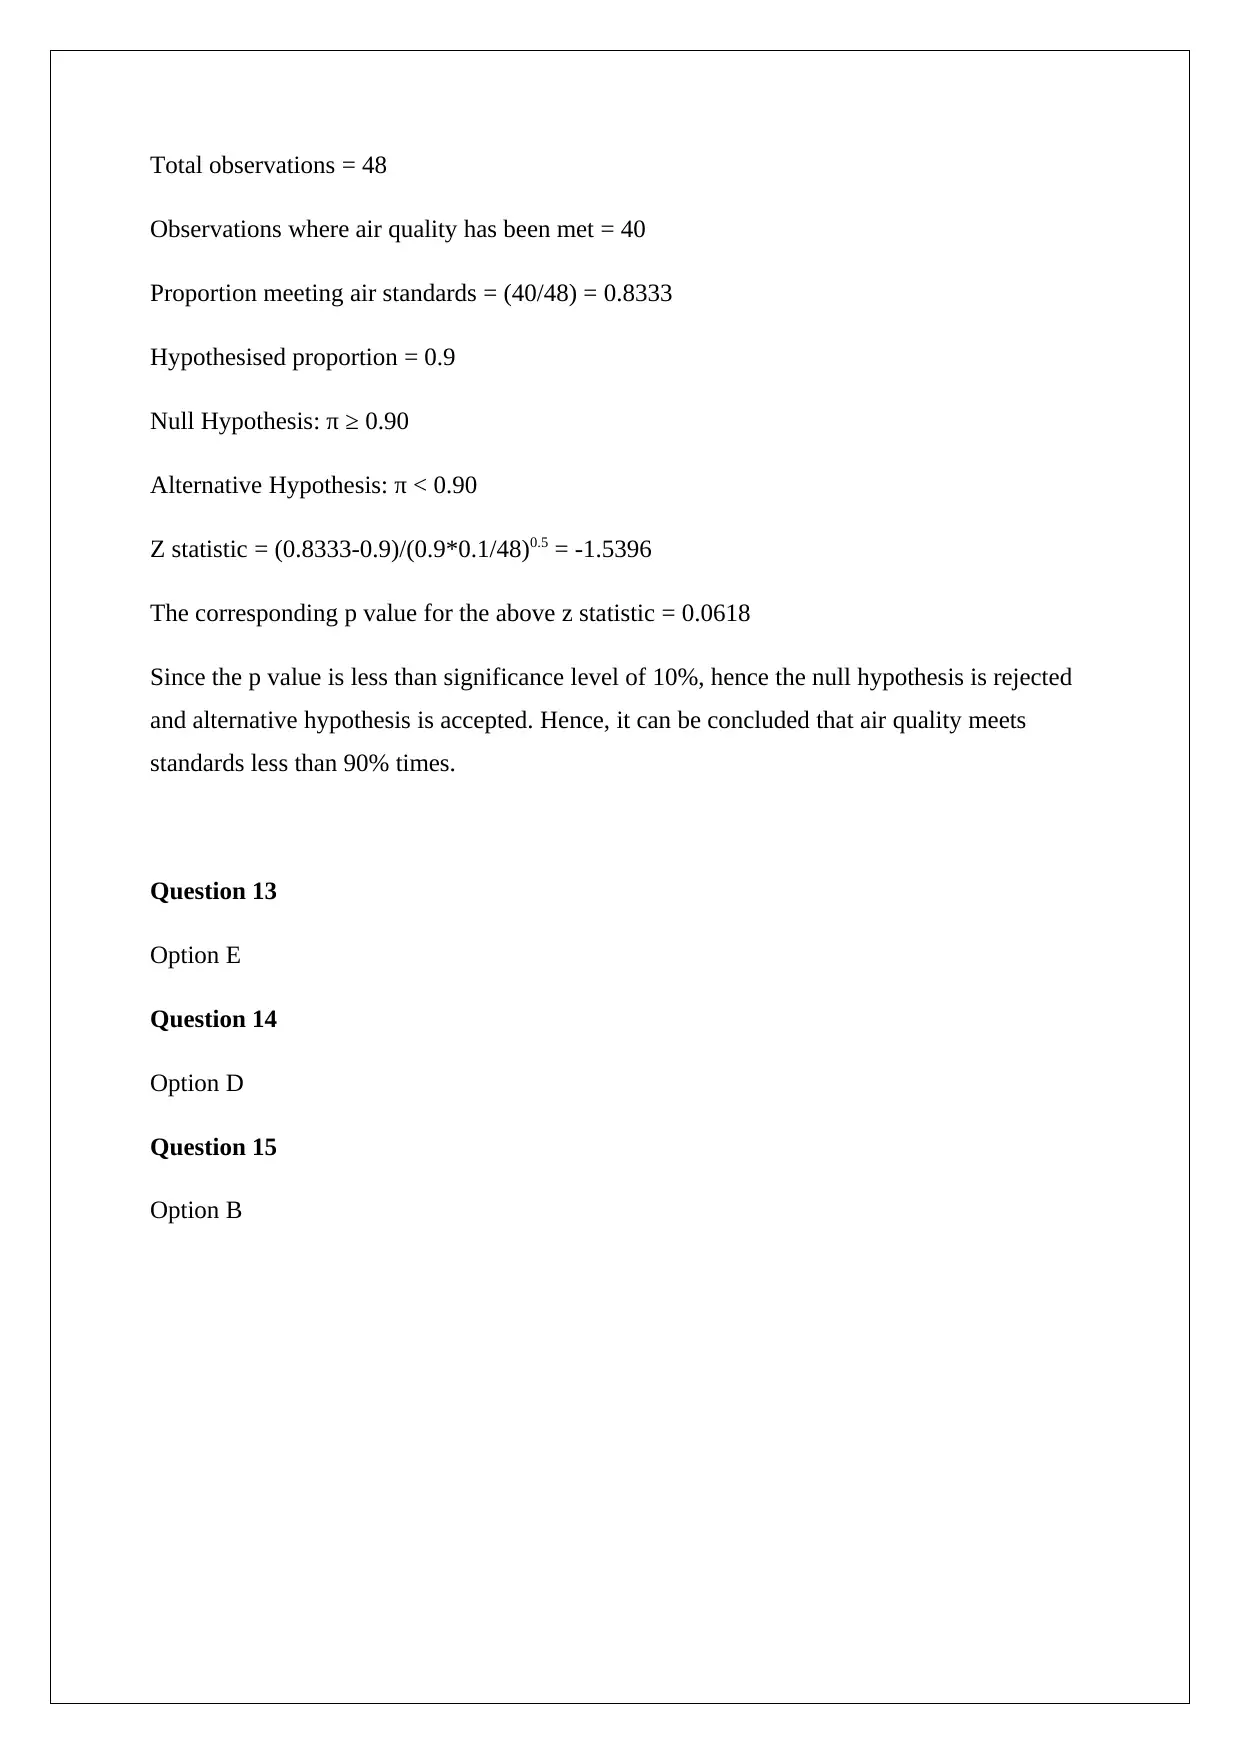
This document presents the solutions to a statistics homework assignment. The assignment includes multiple-choice questions and problem-solving exercises. Question 1 involves matching, while Question 2 is a multiple-choice question. Question 3 calculates expected values, and questions 4, 5, 6, 7, 8, 13, 14, and 15 are all multiple-choice. Question 9 is also a multiple-choice question. Question 10 involves determining if a confidence interval supports a claim. Question 11 addresses the appropriate statistical tests for various scenarios, including t-tests, ANOVA, and chi-square tests. Question 12 tests a hypothesis about air quality standards using a z-statistic and p-value. The assignment covers a range of statistical concepts including hypothesis testing, confidence intervals, chi-square tests, and the binomial distribution.
Document Page
Question 1- Match
a- 1
b-4
c-2
d-3
Question 2
Option E (None of the Above)
Question 3
Expected count= (16+15+10)*(10+1+5)/(16+15+10+10+6+1+4+2+5) = 9.5
Question 4
Option B
Question 5
Option A
Question 6
Option A
Question 7
Option C
Question 8
Option A
Question 9
Option E
Question 10
Option E
tabler-icon-diamond-filled.svg

Paraphrase This Document

Need a fresh take? Get an instant paraphrase of this document with our AI Paraphraser
Document Page
Question 10
Yes, Bobo’s claim is supported since the 95% confidence interval lies between 1.62 and 3,21
minutes.
Question 11
Given weight of 31, 29, 26, 33, 40, 28, 30, and 25, at α = 0.05 test the population mean is 35
– Option 2 (2-tailed test of mean with both negative and positive critical value)
Data were gathered in an experiment comparing the effect of three insecticides in controlling
a certain species of parasitic beetle. Each observation represents the number of such insects
found dead in a certain fixed area treated with an insecticide – Option 6 (ANOVA)
A multinomial probability distribution describes the distribution of counts across multiple
level of a variable. A special case is a binomial discrete probability distribution. For each
level of a variable, which is common to multiple populations, equality of distributions can be
tested. – Option 7(Chi Square test of homogeneity)
Run times (msec) of a new phone app developed by GotYourGP and established competitor
WeTrackYou.Inc. are logged in a data file. At α = 0.05, are the run time of GotYourGp and
WeTrackYou.Inc. comparable? – Option 5 (2-tailed test of means of 2 independent
populations)
Testing that a gasoline additive increases millage, we compute mpg with additive for each
car. If the mean of the difference is positive enough, action will be required to implement the
additive. – Option 4 (1-tailed test of paired-data with positive critical value)
Does the data validate the normal probability distribution assumption? –Option 9 (Chi-square
test of goodness of fit)
Test size C battery mean life is at least 25 hours –Option 3 (1-tailed test of mean with
negative critical value)
Do contingency table classification values matter?- Option 8(Chi-square test of
independence)
Question 12
Document Page
Total observations = 48
Observations where air quality has been met = 40
Proportion meeting air standards = (40/48) = 0.8333
Hypothesised proportion = 0.9
Null Hypothesis: π ≥ 0.90
Alternative Hypothesis: π < 0.90
Z statistic = (0.8333-0.9)/(0.9*0.1/48)0.5 = -1.5396
The corresponding p value for the above z statistic = 0.0618
Since the p value is less than significance level of 10%, hence the null hypothesis is rejected
and alternative hypothesis is accepted. Hence, it can be concluded that air quality meets
standards less than 90% times.
Question 13
Option E
Question 14
Option D
Question 15
Option B
chevron_up_icon
1 out of 3
circle_padding
hide_on_mobile
zoom_out_icon
[object Object]