University Statistics: Household Analysis Assignment, Semester 1
VerifiedAdded on 2023/06/07
|6
|657
|323
Homework Assignment
AI Summary
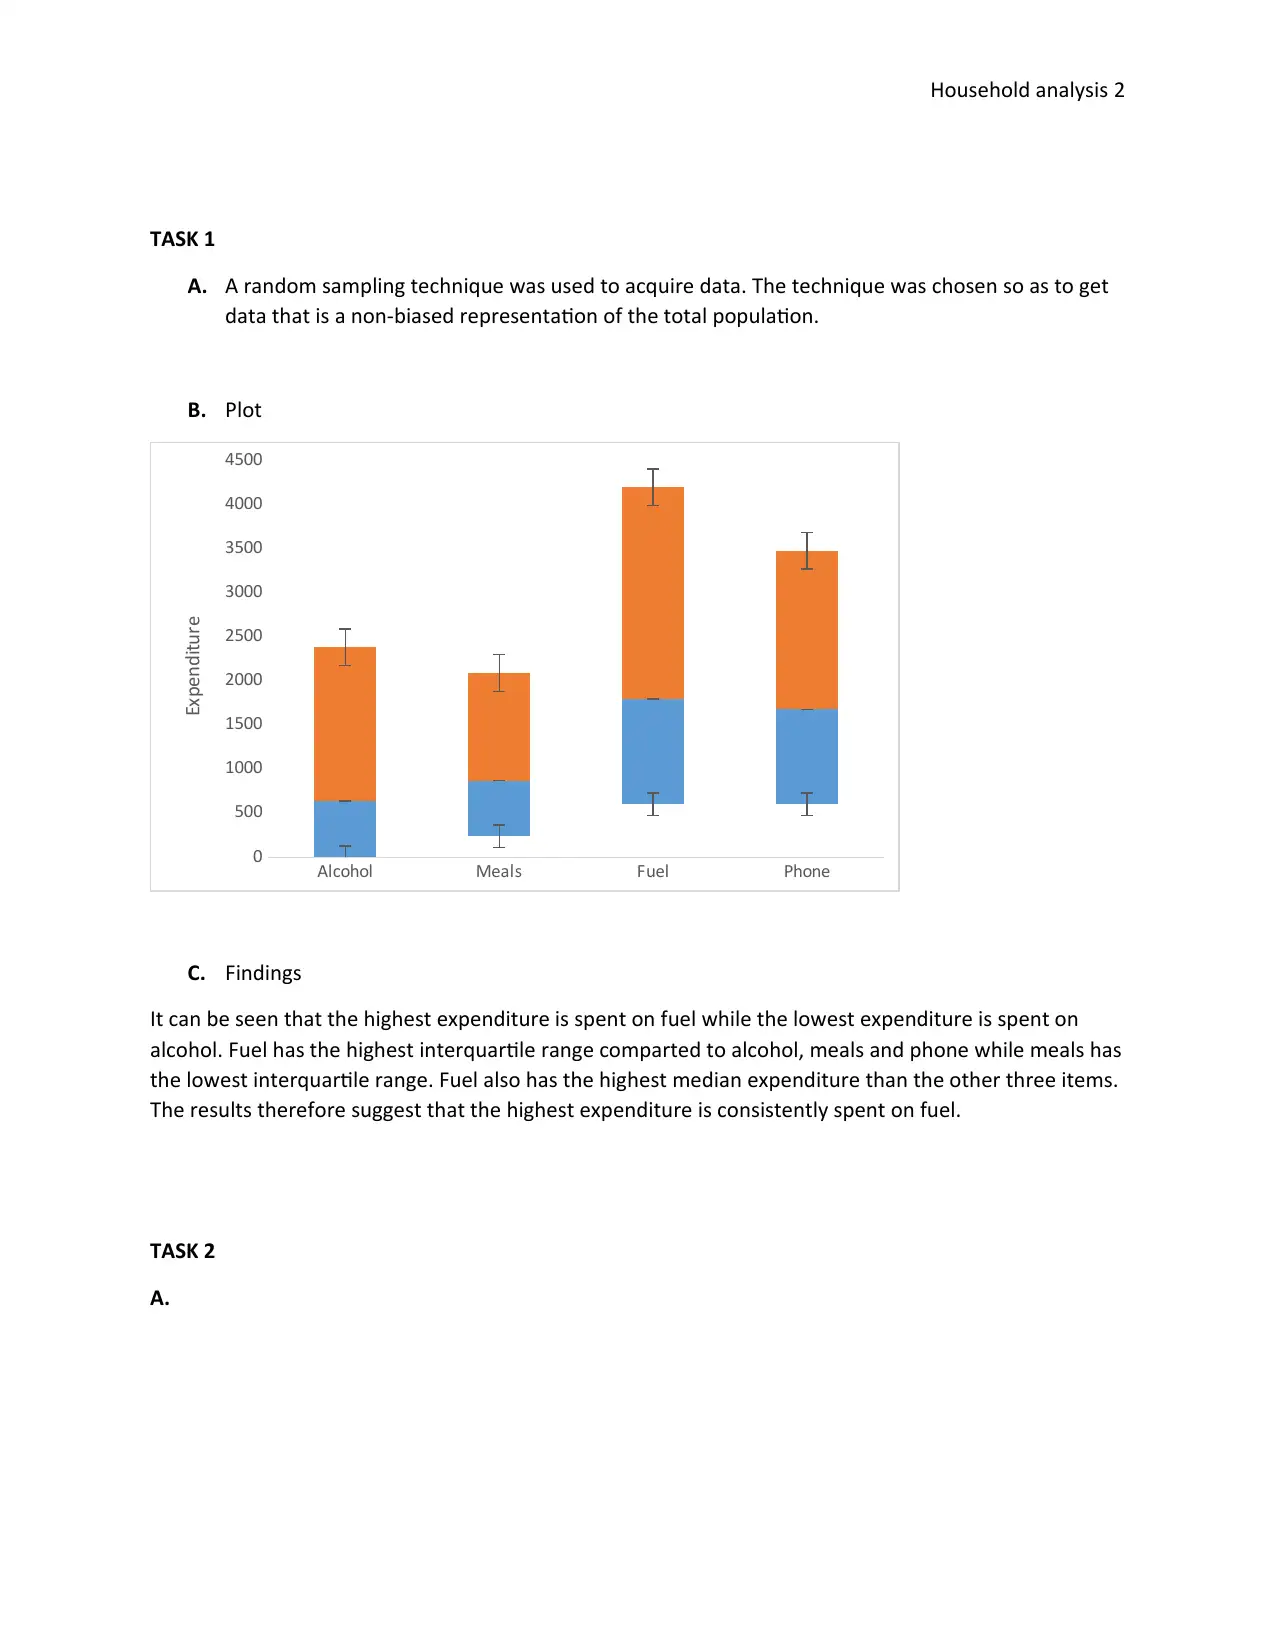
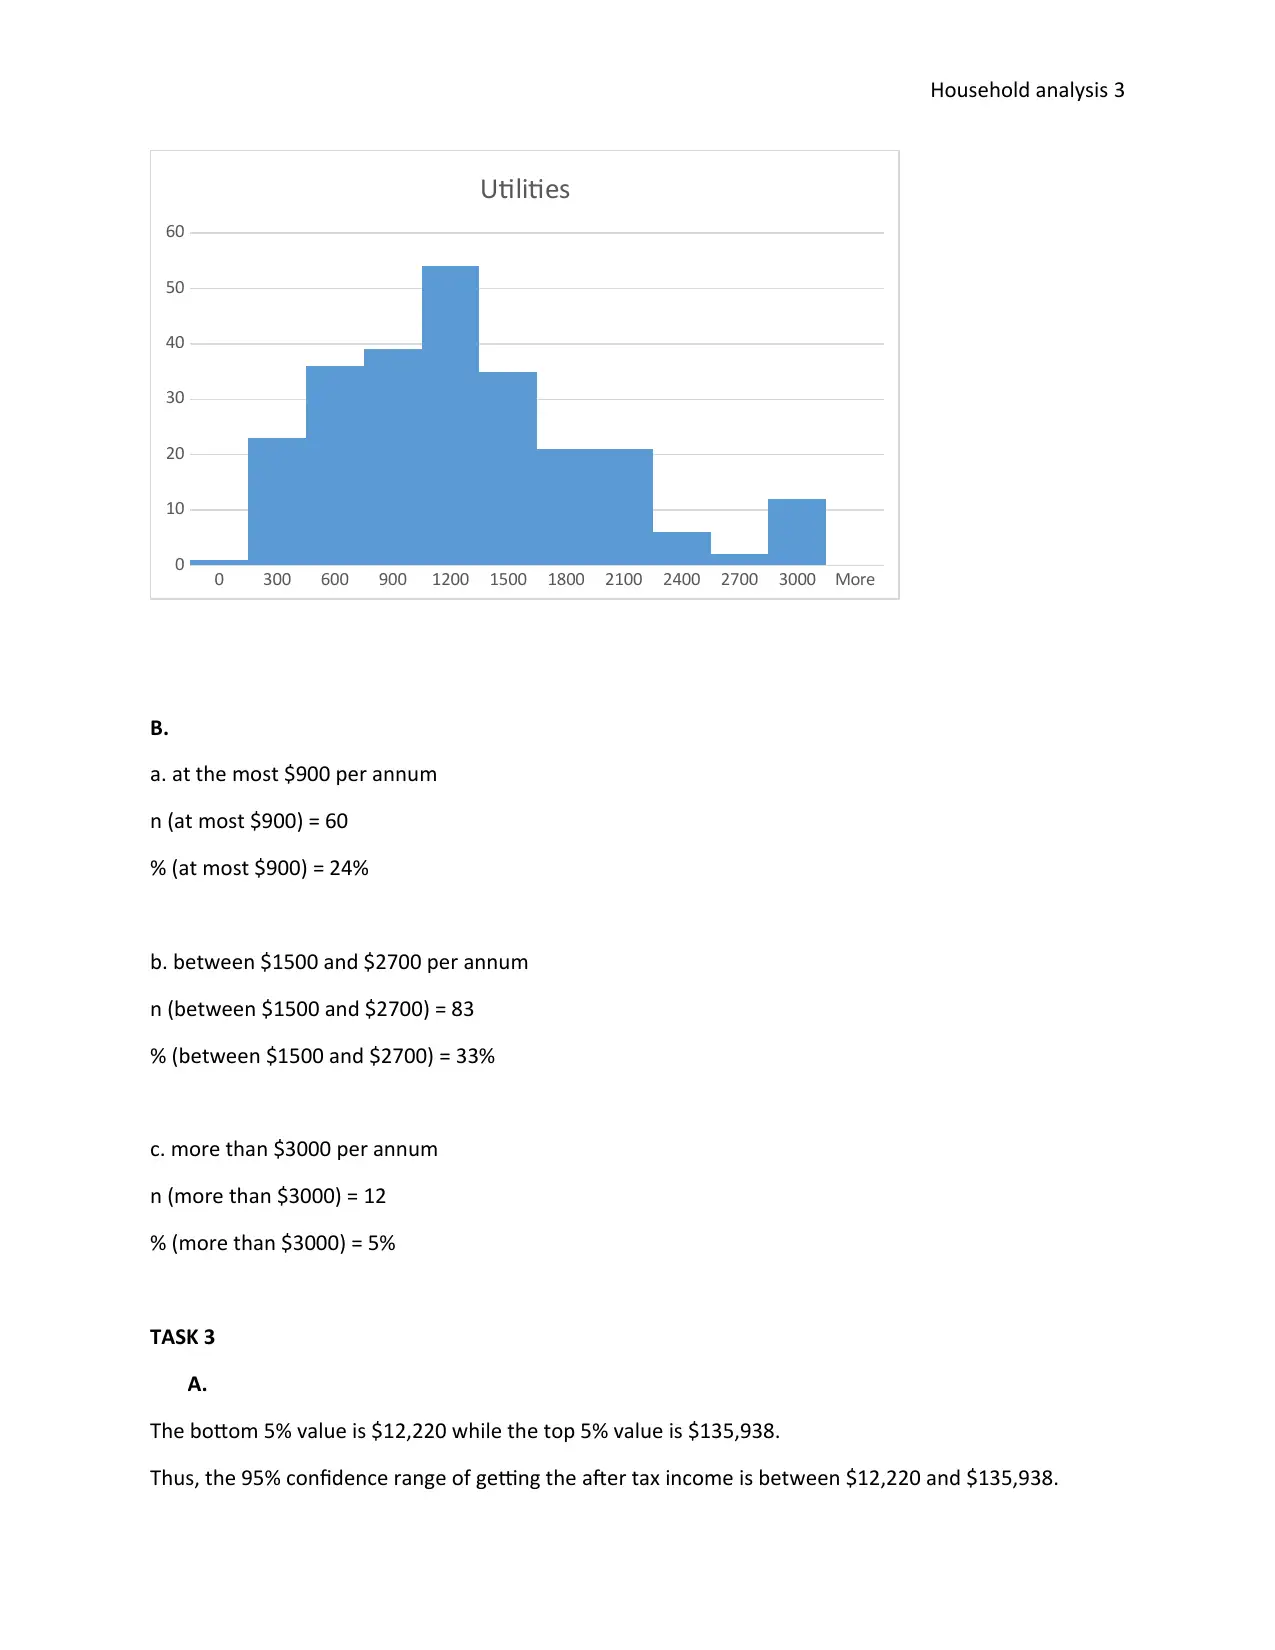
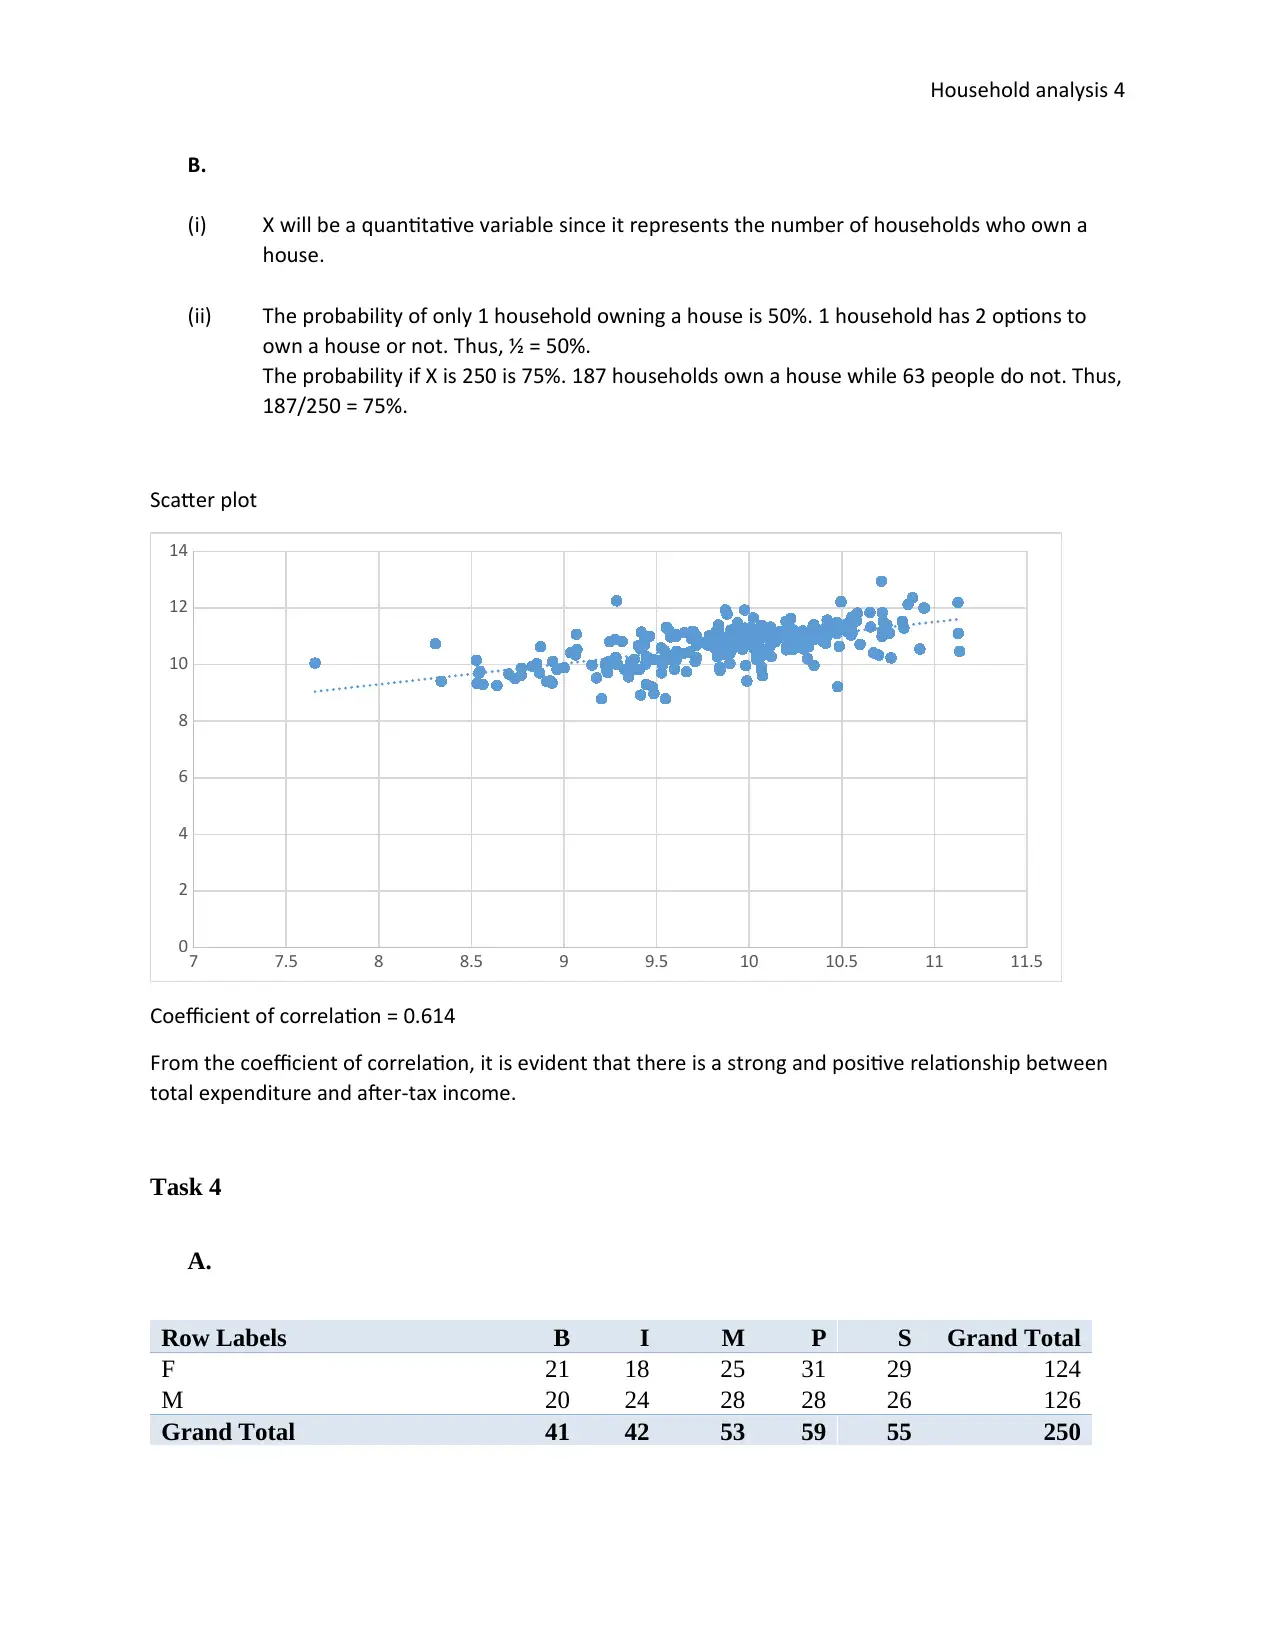
This document presents a complete solution to a household analysis assignment, likely for a statistics or data analysis course. The assignment covers several key areas, including random sampling techniques, data visualization (likely through charts), and statistical analysis. Task 1 focuses on data acquisition using random sampling, followed by the analysis of expenditure data, possibly using box plots or other visual representations to highlight spending patterns across different categories (alcohol, meals, fuel, phone). Task 2 delves into the analysis of utility expenditure using a cumulative frequency graph to determine the proportion of households spending within certain annual ranges. Task 3 explores confidence intervals for after-tax income and applies probability concepts to household characteristics, such as house ownership. Finally, Task 4 involves creating a contingency table to analyze the relationship between gender and education level and calculating probabilities based on the data presented, including conditional probabilities and tests for independence.
1 out of 6
Related Documents


Your All-in-One AI-Powered Toolkit for Academic Success.
+13062052269
info@desklib.com
Available 24*7 on WhatsApp / Email
![[object Object]](/_next/static/media/star-bottom.7253800d.svg)
Copyright © 2020–2026 A2Z Services. All Rights Reserved. Developed and managed by ZUCOL.