Statistics Assignment: Task 1 & 2 - Hypothesis Testing & Regression

Verified

Added on  2020/04/01

|10
|471
|91
Homework Assignment
AI Summary
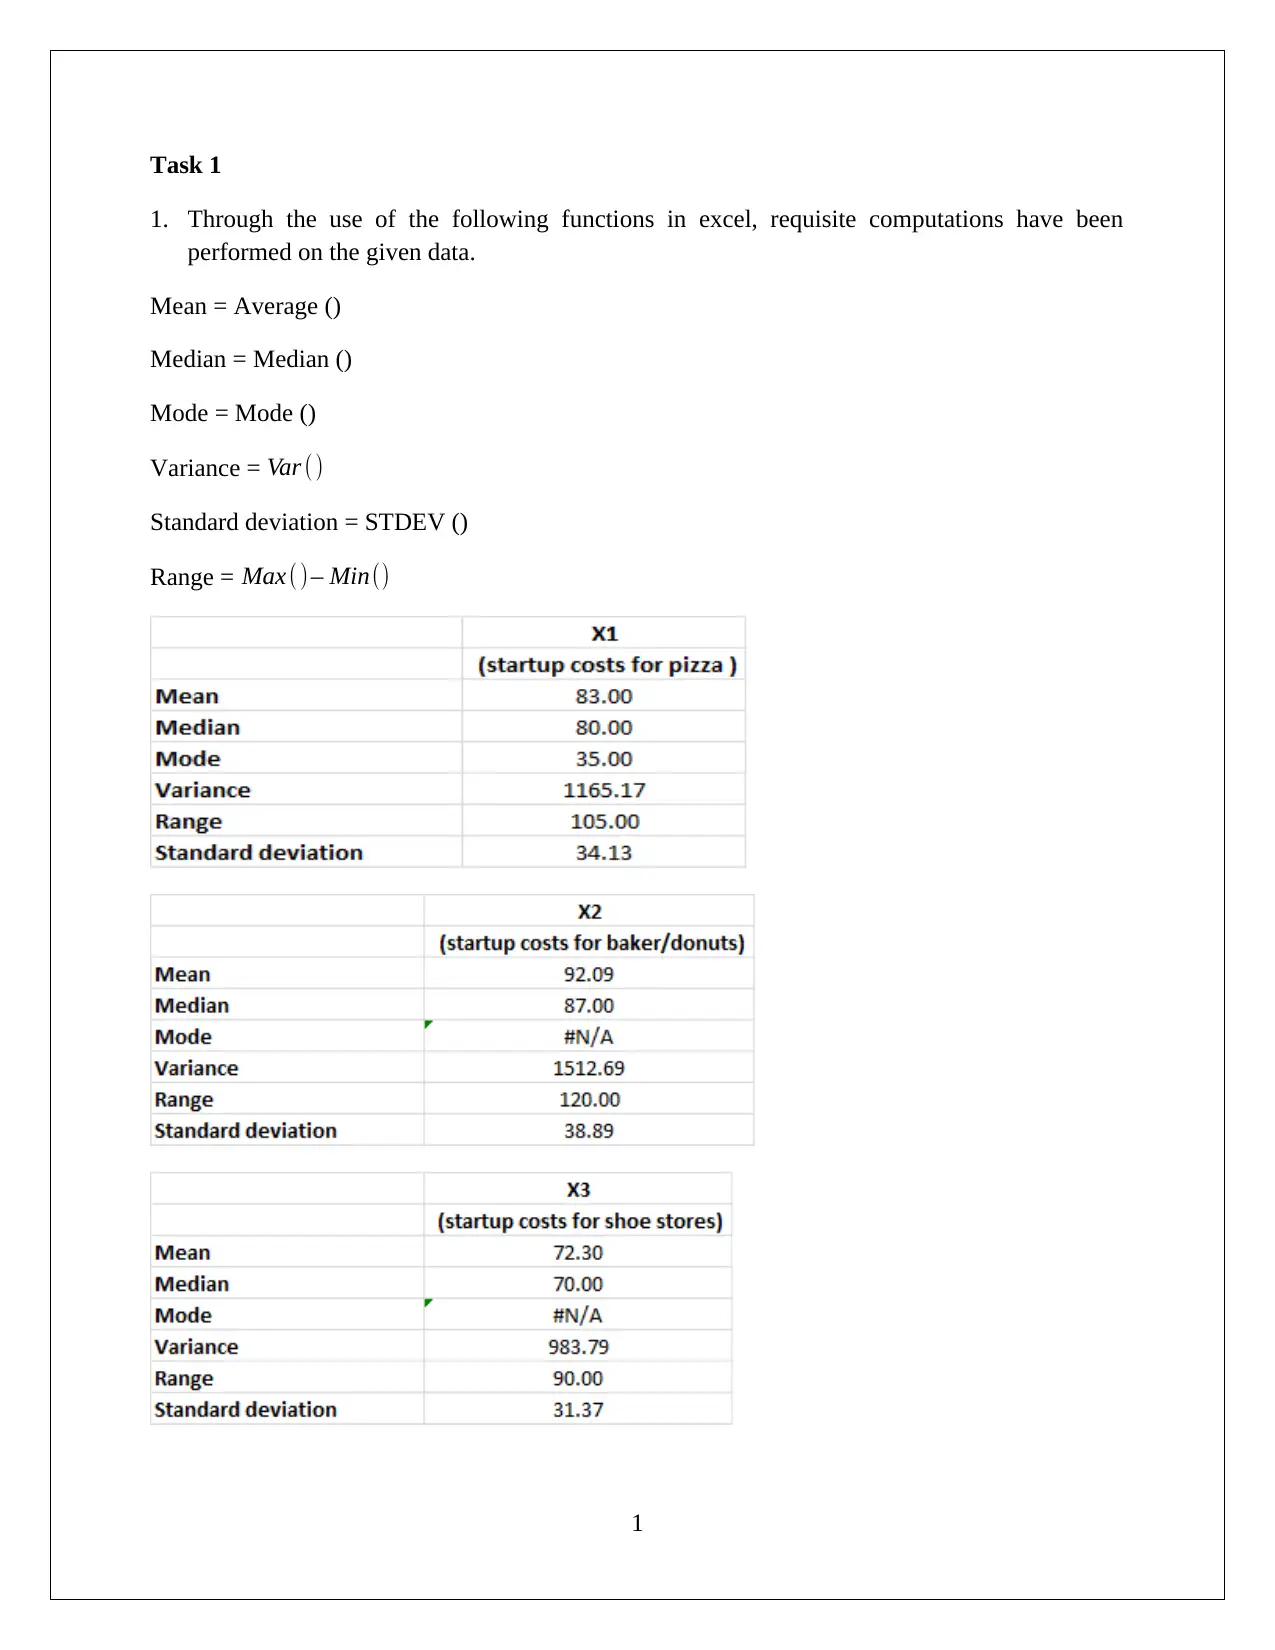
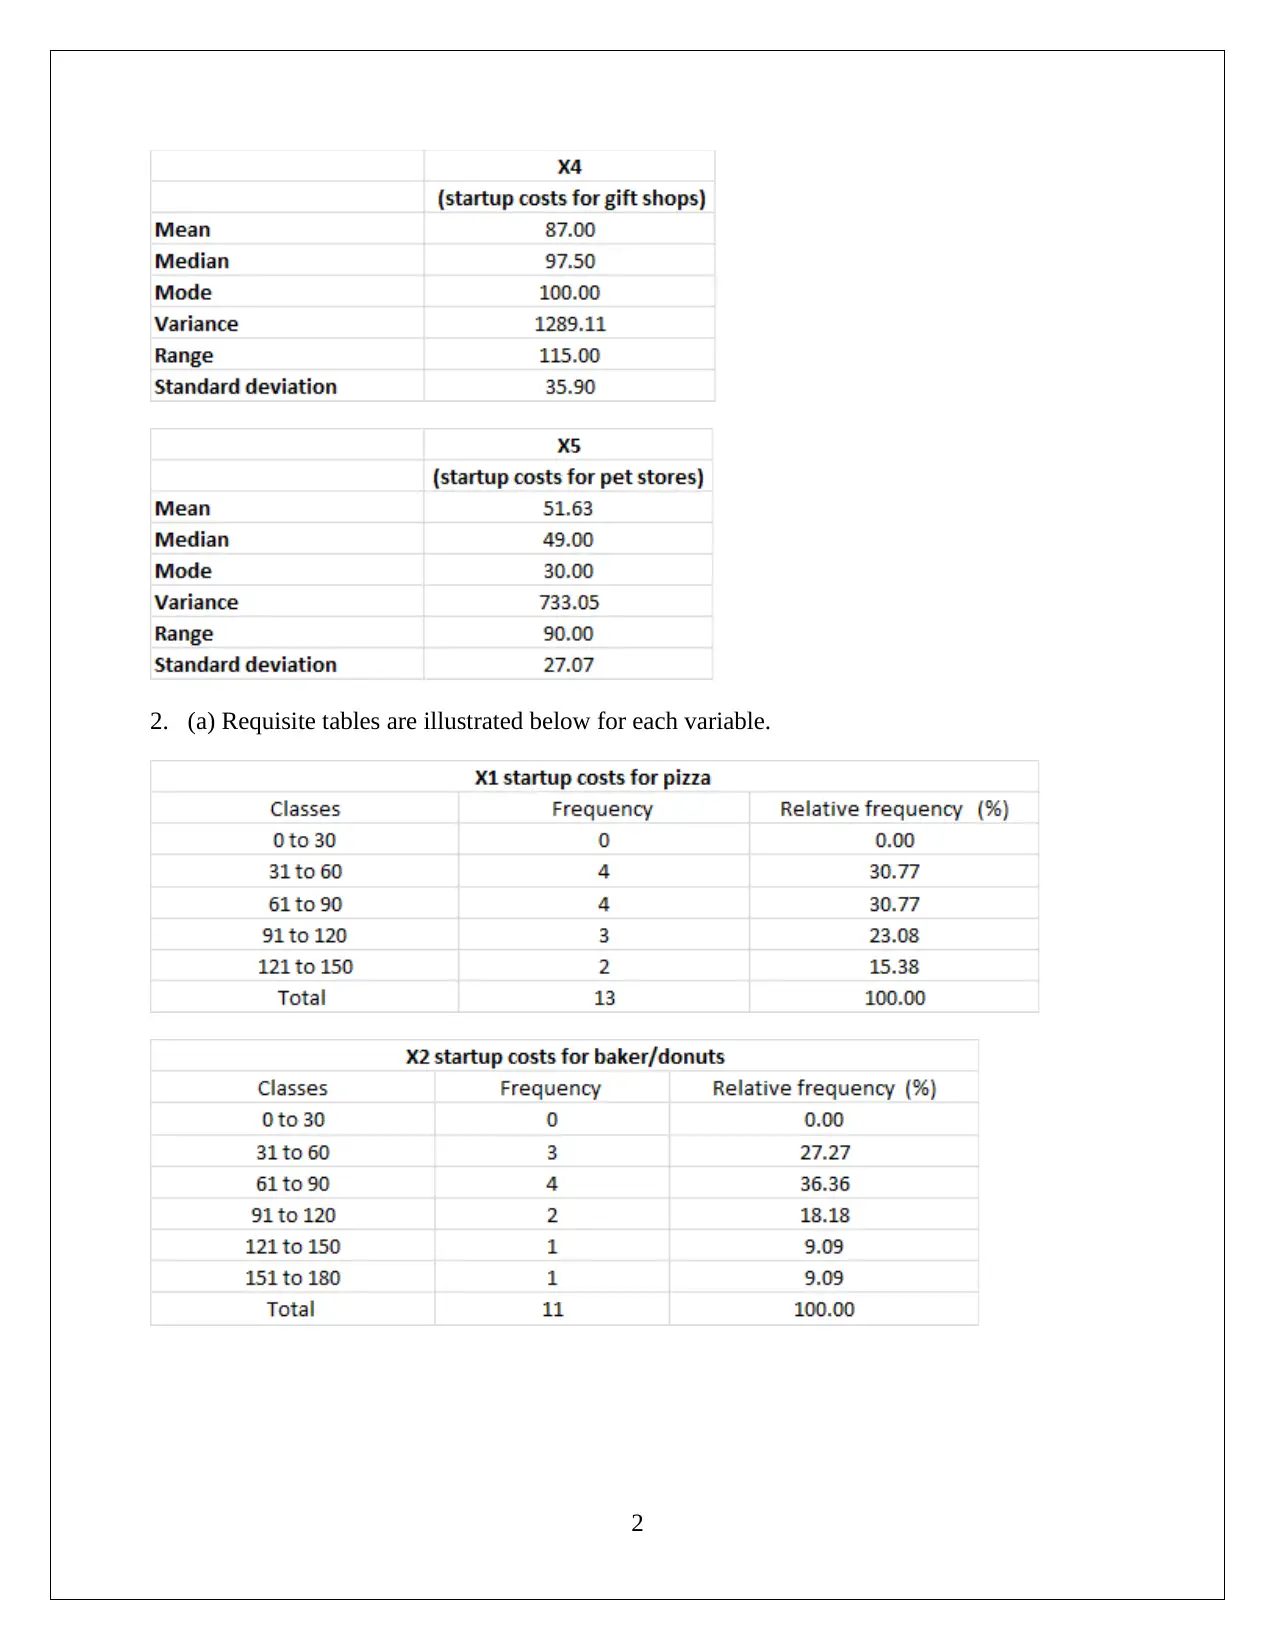
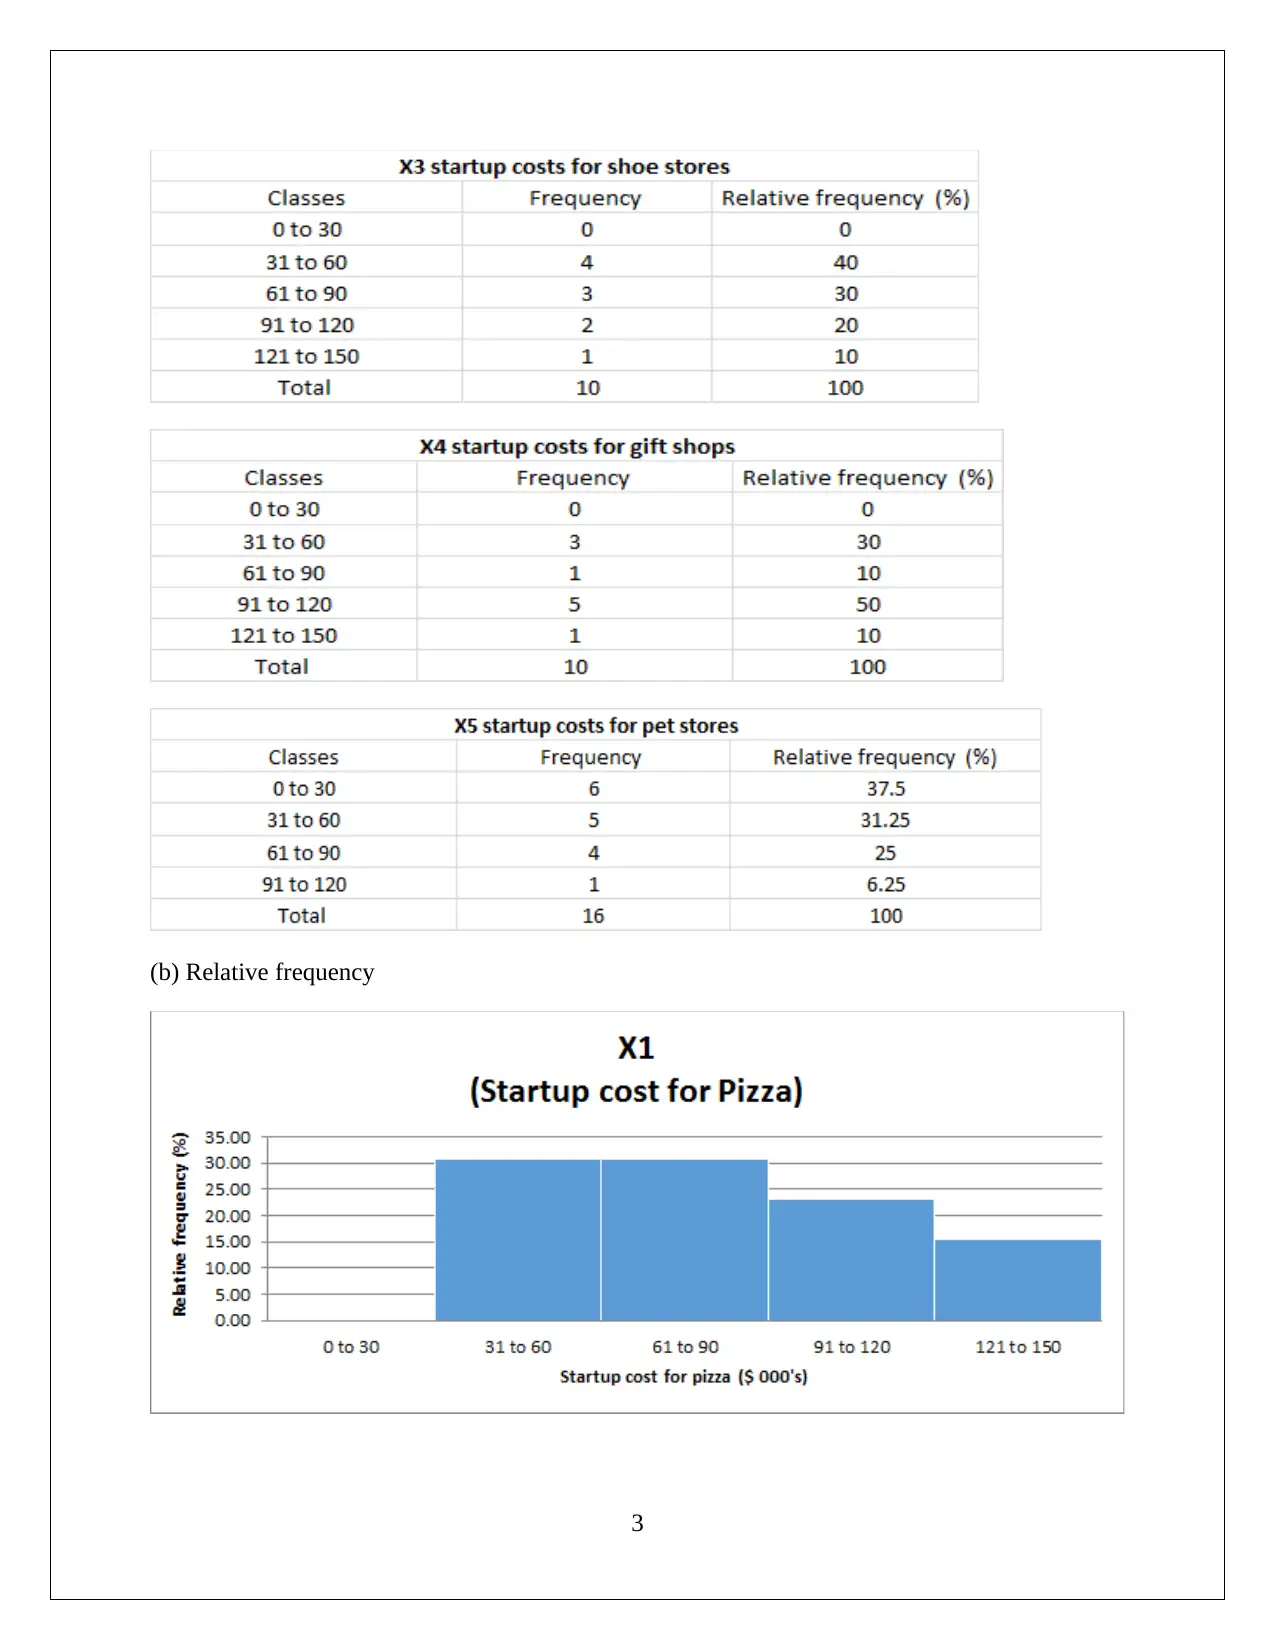
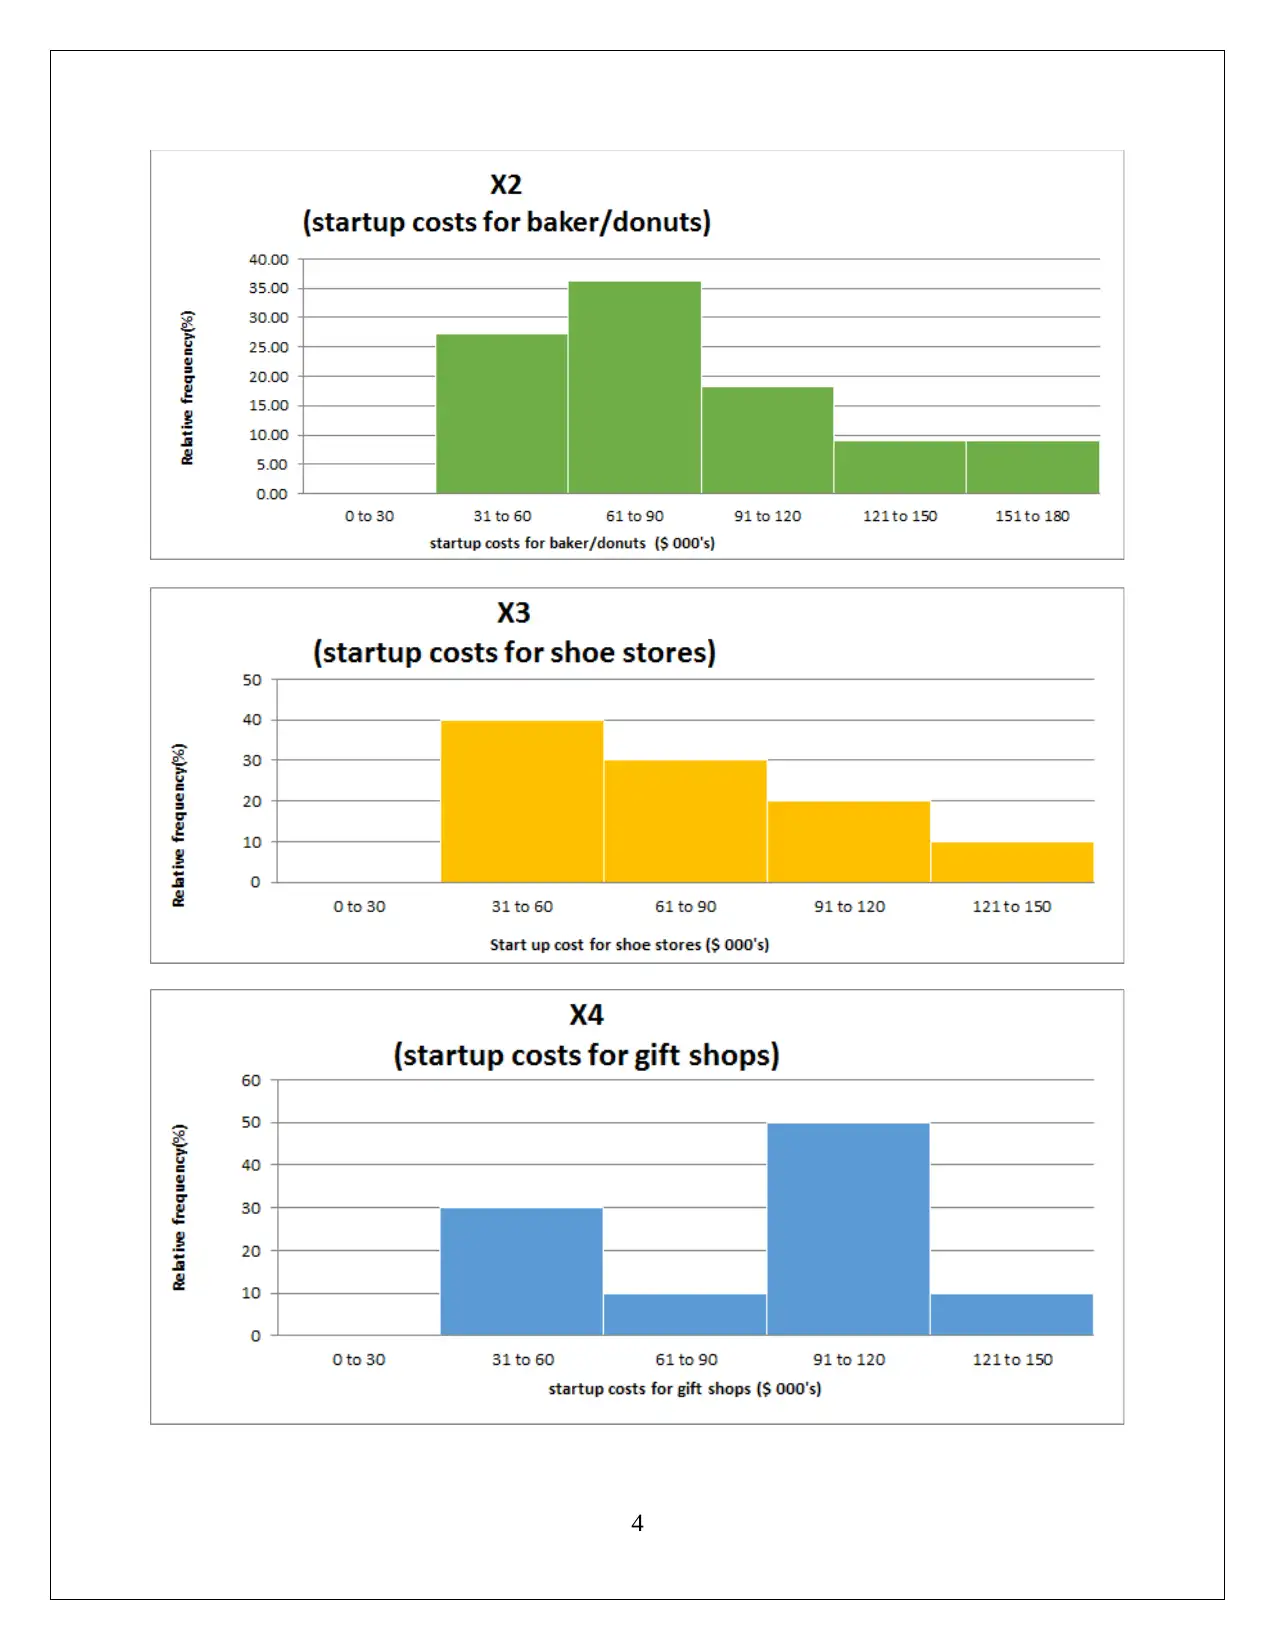
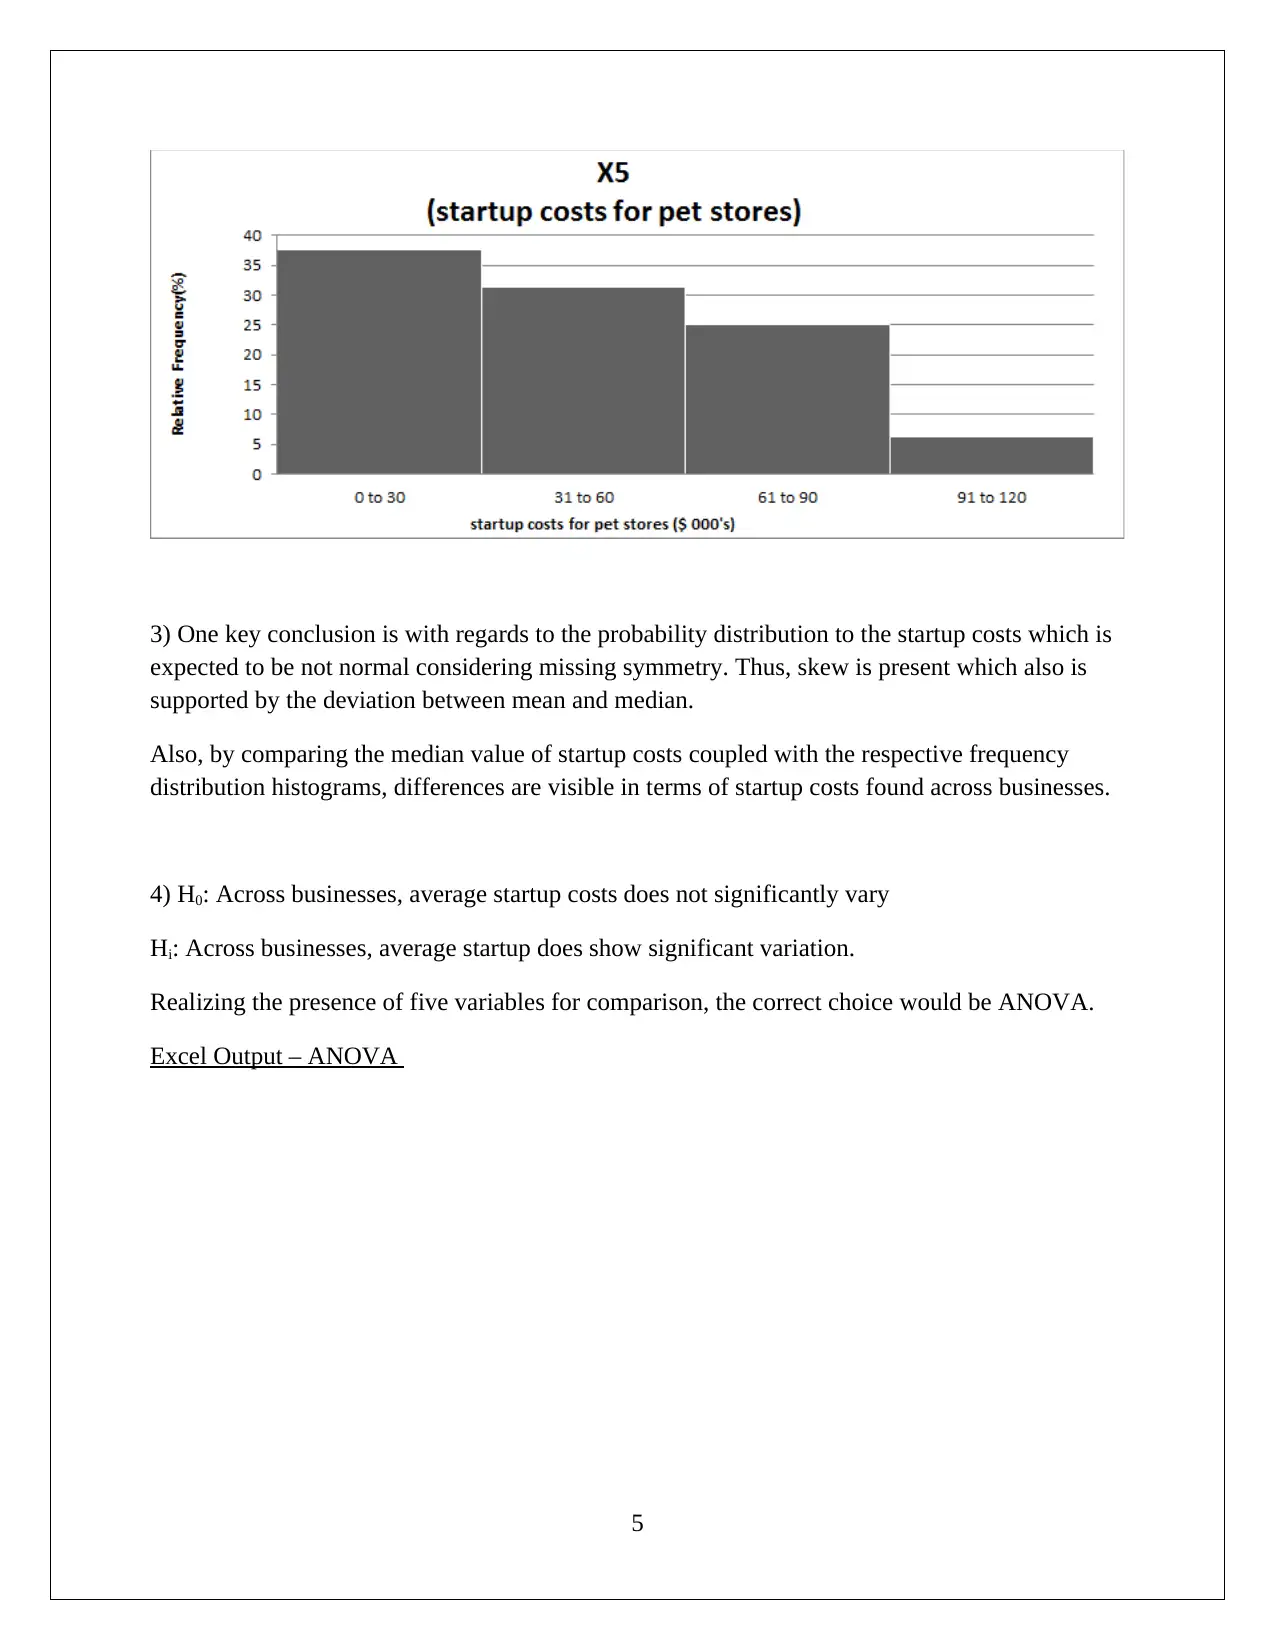
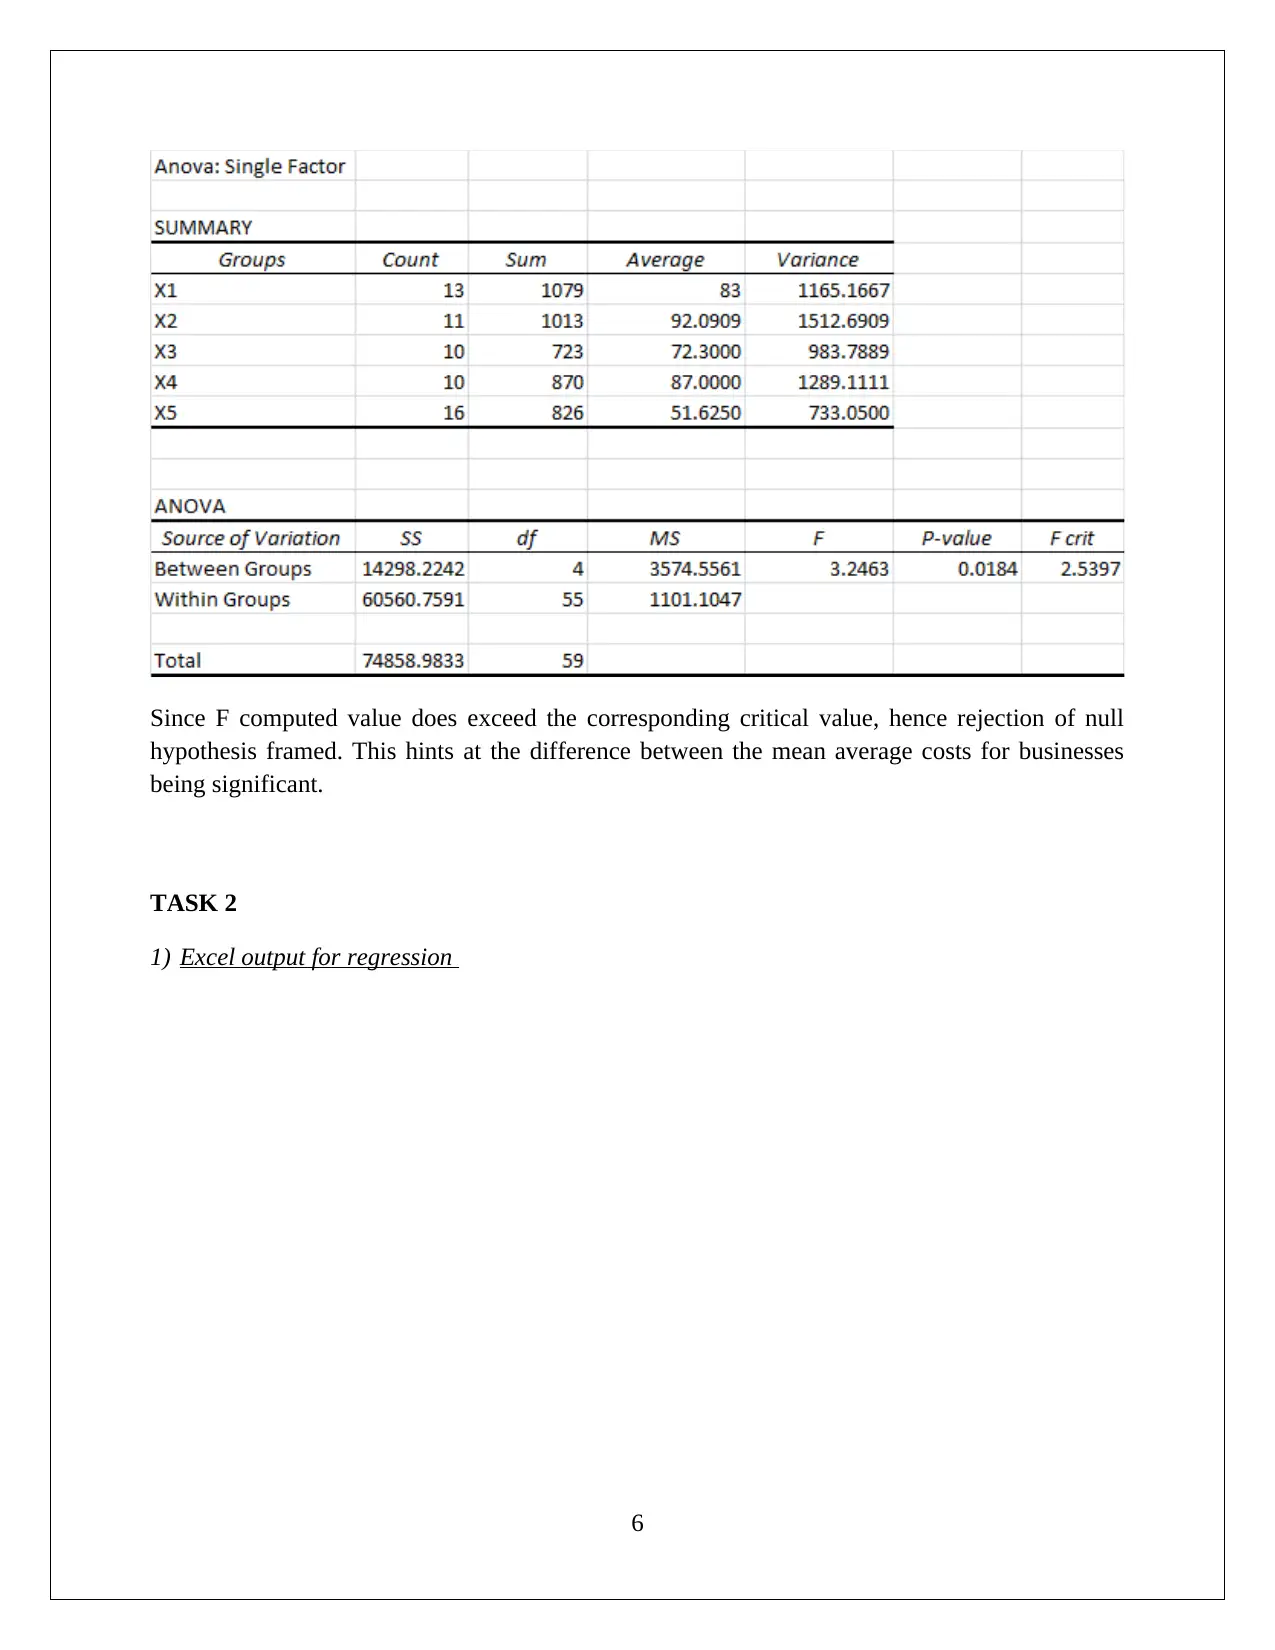
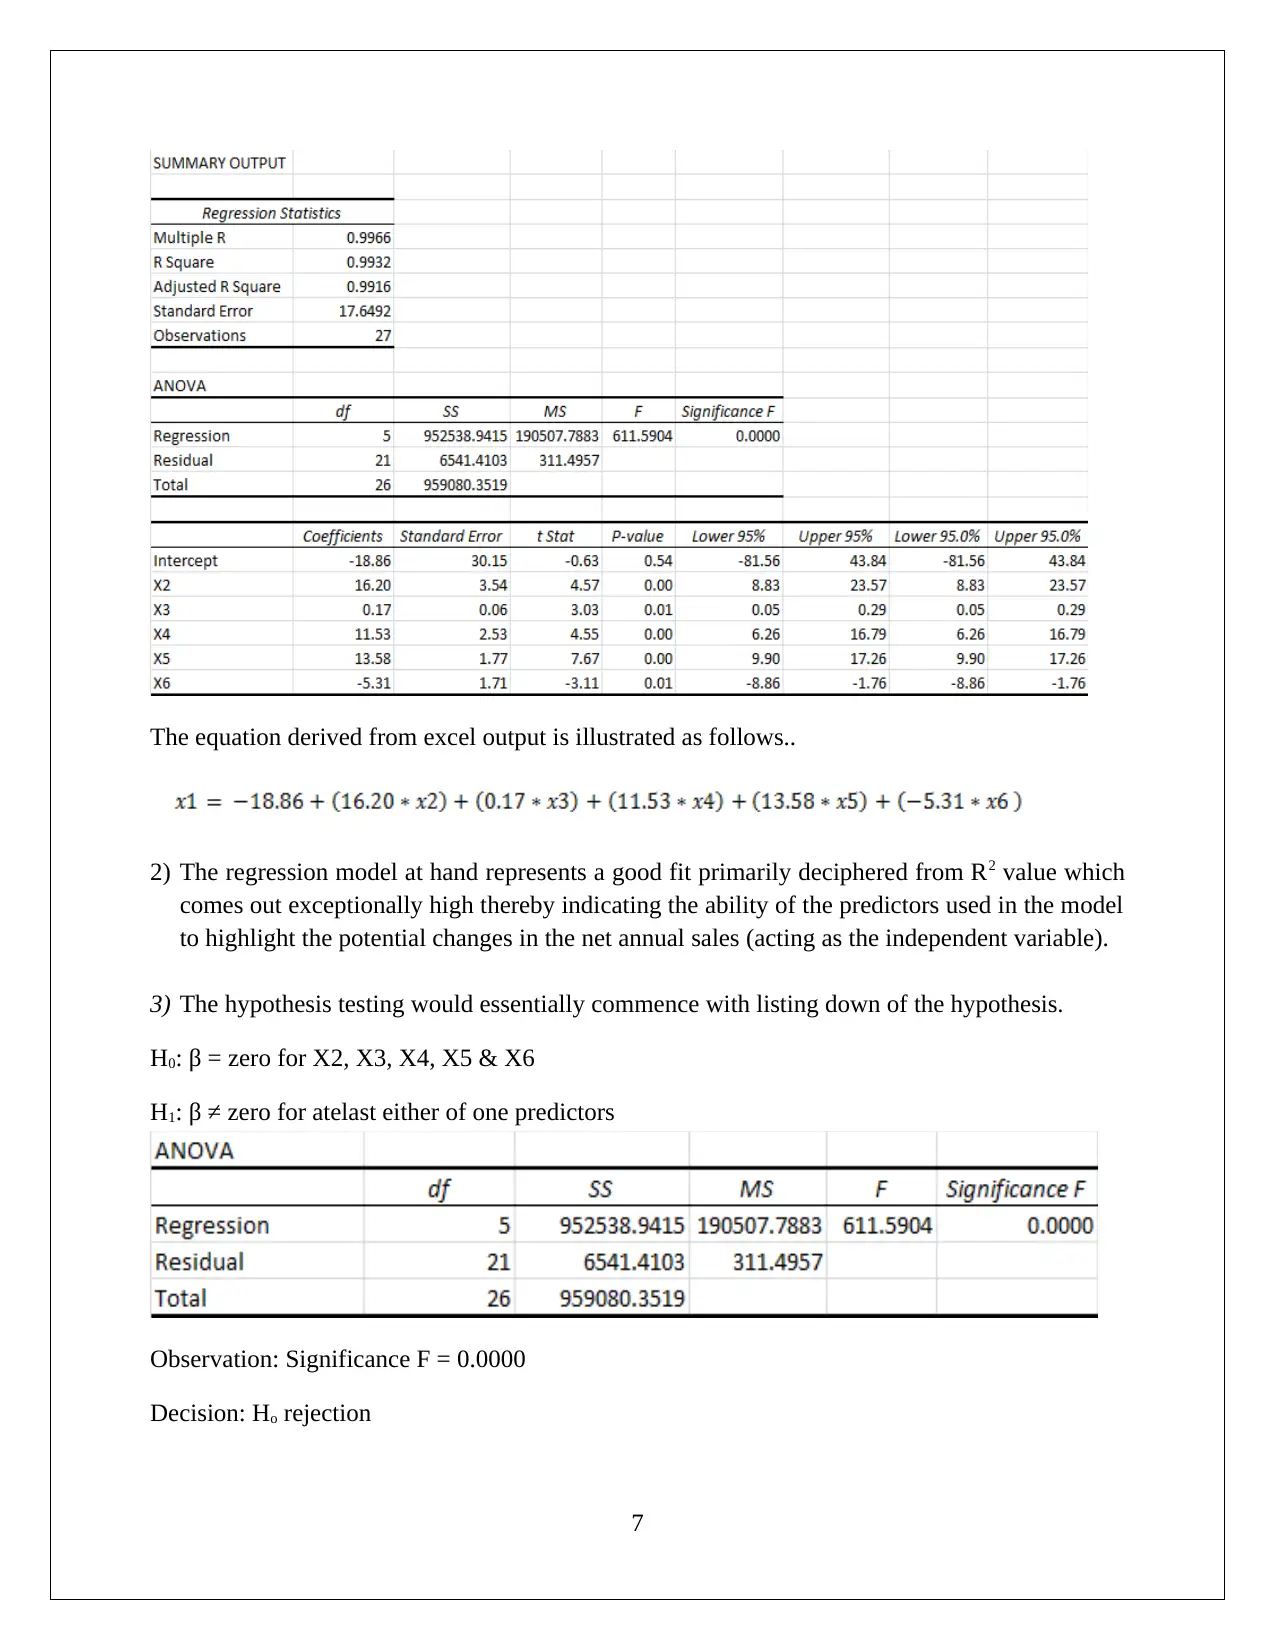
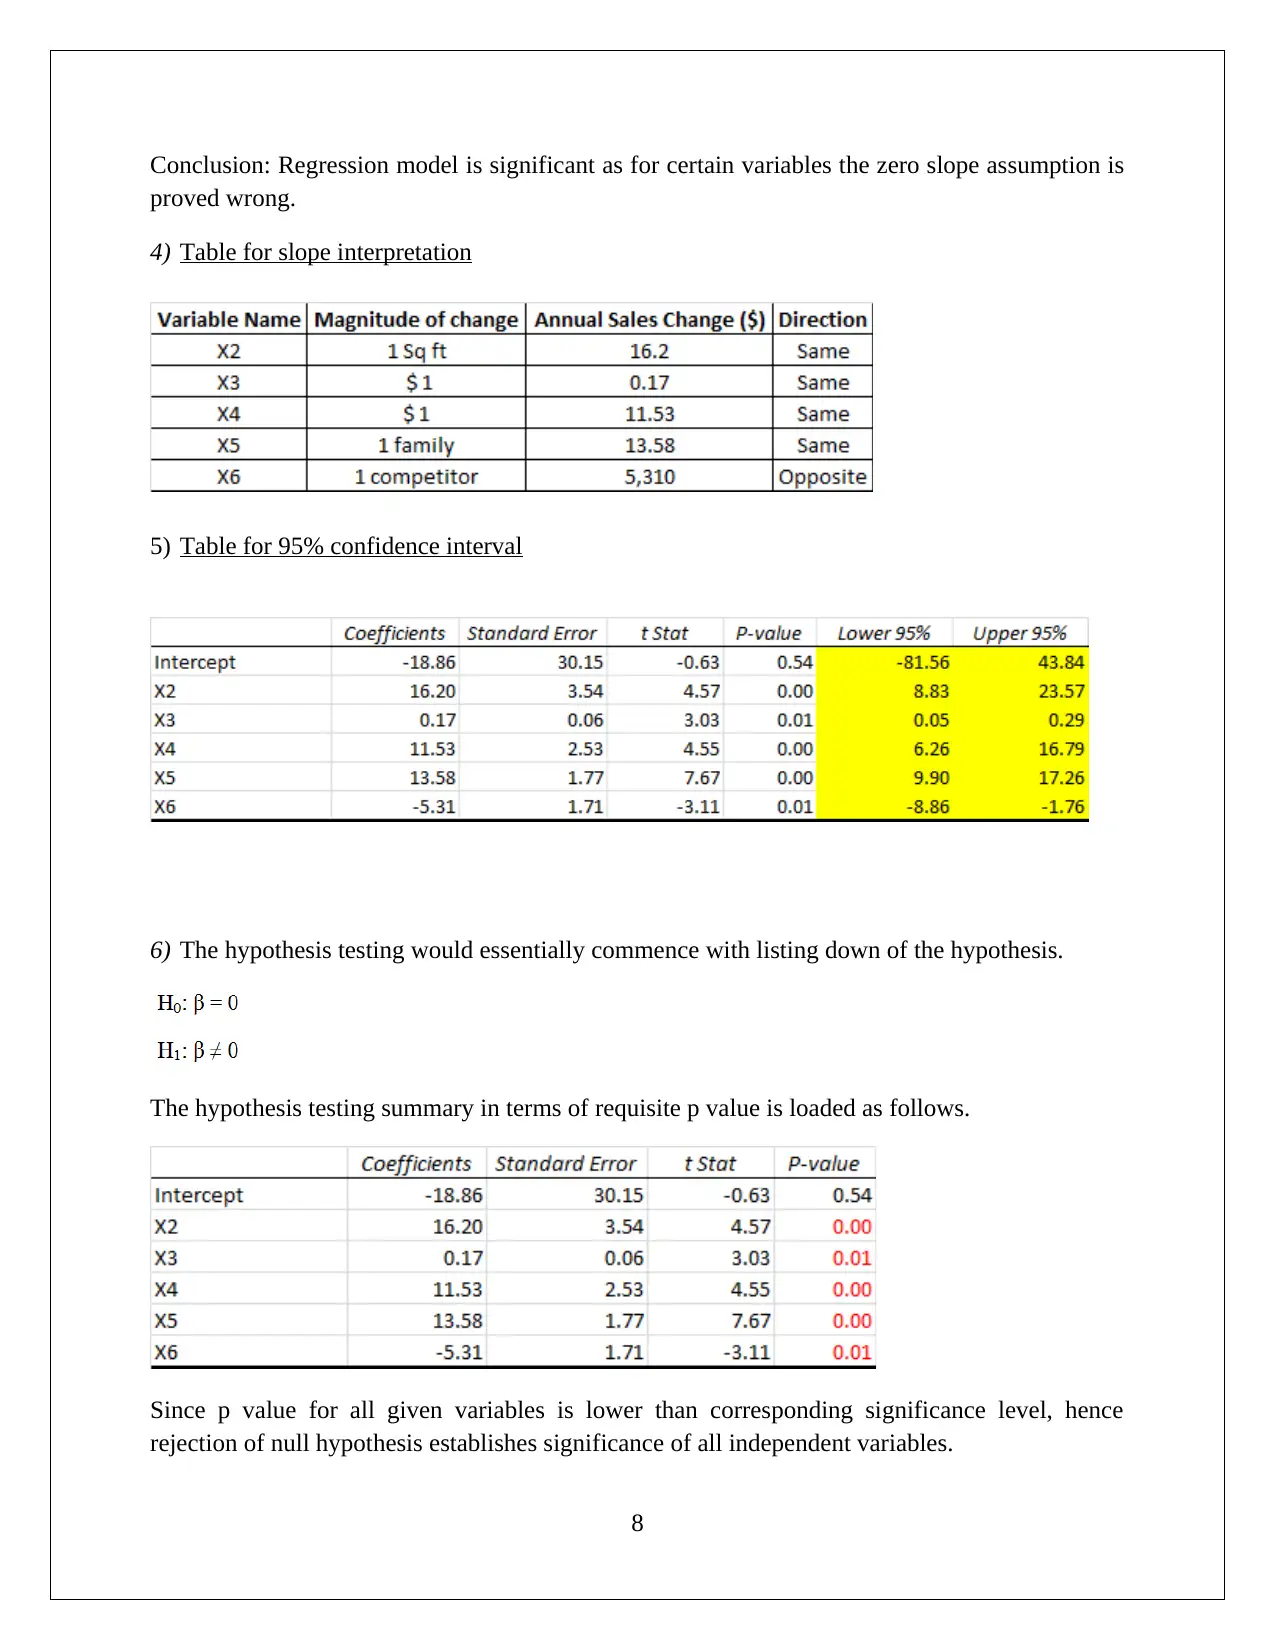
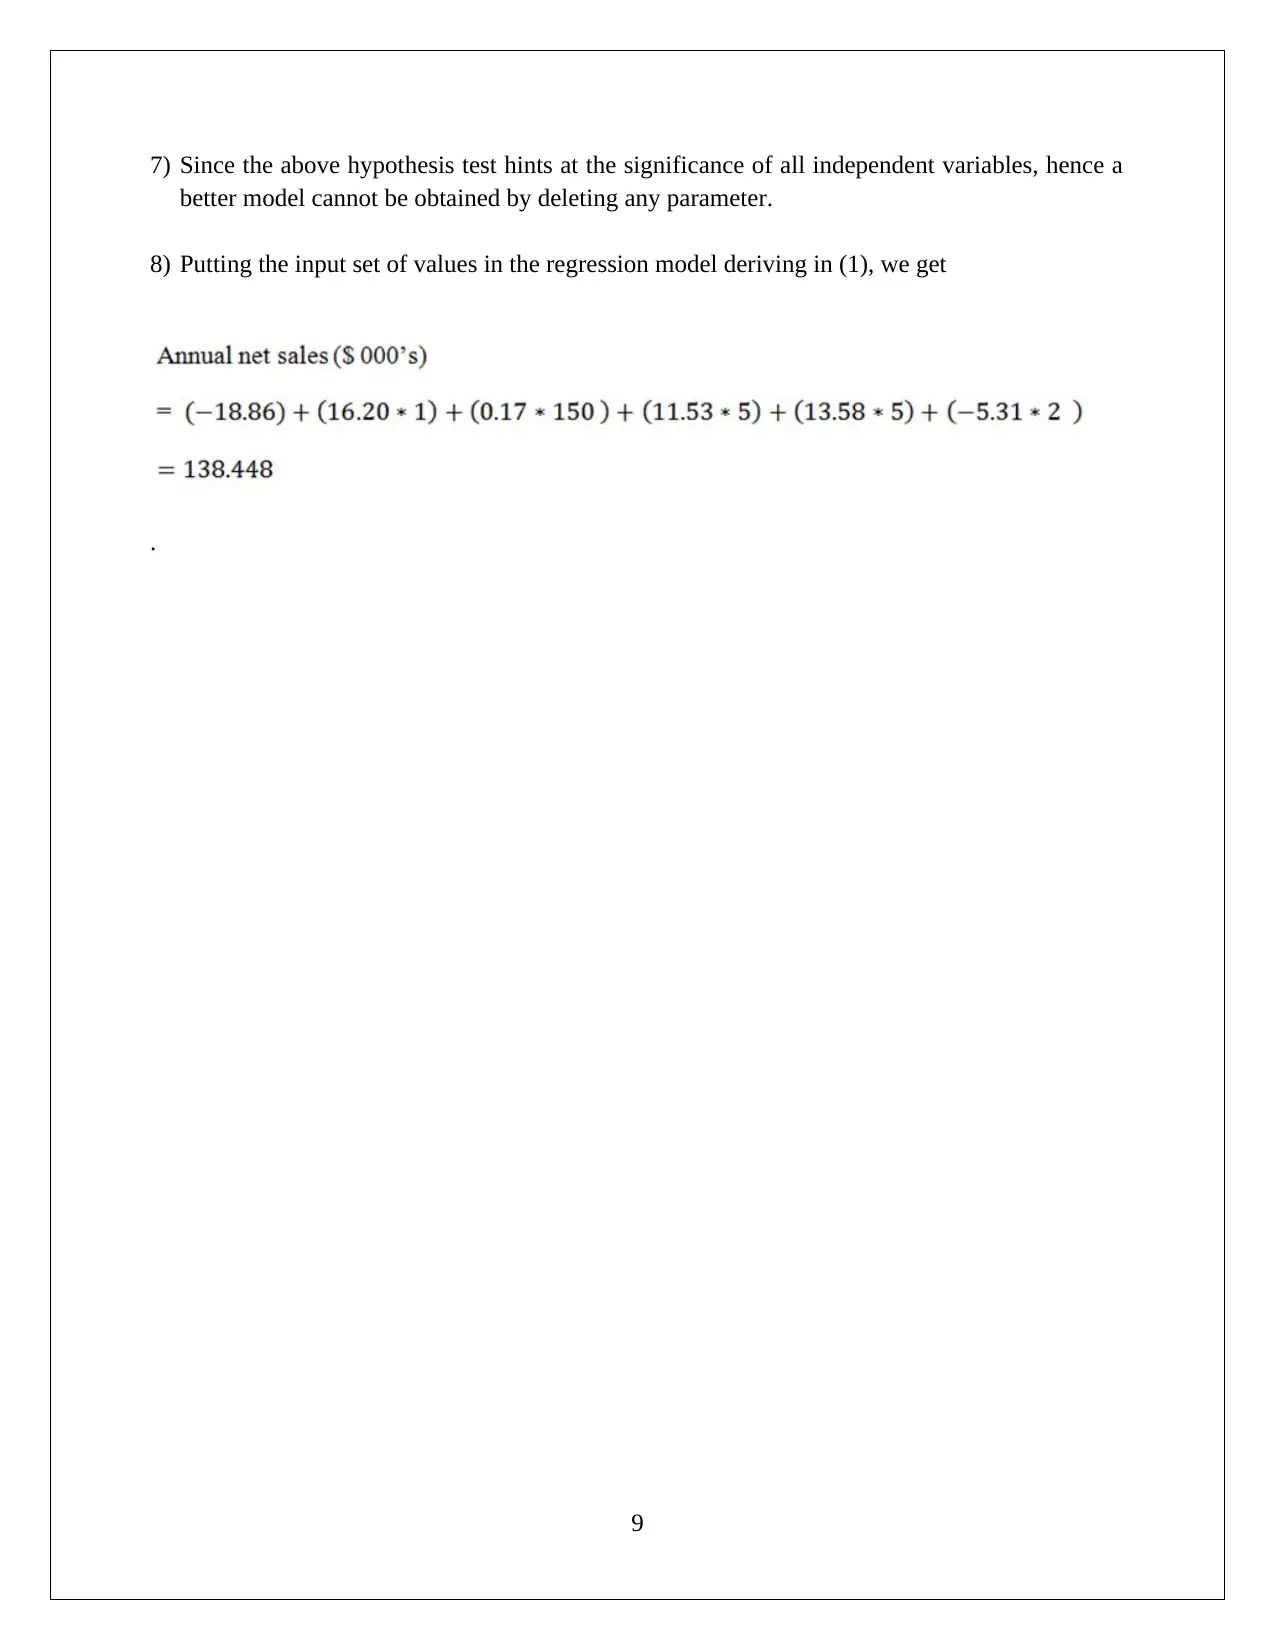
This statistics assignment presents an analysis of data using Excel, encompassing two main tasks. Task 1 involves calculating descriptive statistics such as mean, median, mode, and variance, and performing an ANOVA test to compare average startup costs across businesses. The assignment provides tables, frequency distributions, and identifies the skewness in startup costs. Task 2 focuses on regression analysis, presenting an equation derived from Excel output, evaluating the model's fit using R2 values, and conducting hypothesis testing for the regression coefficients. The assignment includes significance tests, confidence intervals, and a conclusion on the significance of independent variables, demonstrating a comprehensive approach to statistical analysis and modeling.
tabler-icon-diamond-filled.svg

Contribute Materials

Your contribution can guide someone’s learning journey. Share your documents today.
Document Page
STATISTICS
TASK 1 & 2
STUDENT ID
[Pick the date]
tabler-icon-diamond-filled.svg

Secure Best Marks with AI Grader

Need help grading? Try our AI Grader for instant feedback on your assignments.
Document Page
Task 1
1. Through the use of the following functions in excel, requisite computations have been
performed on the given data.
Mean = Average ()
Median = Median ()
Mode = Mode ()
Variance = Var ()
Standard deviation = STDEV ()
Range = Max () Min()
1
Document Page
2. (a) Requisite tables are illustrated below for each variable.
2
Document Page
(b) Relative frequency
3
tabler-icon-diamond-filled.svg

Secure Best Marks with AI Grader

Need help grading? Try our AI Grader for instant feedback on your assignments.
Document Page
4
Document Page
3) One key conclusion is with regards to the probability distribution to the startup costs which is
expected to be not normal considering missing symmetry. Thus, skew is present which also is
supported by the deviation between mean and median.
Also, by comparing the median value of startup costs coupled with the respective frequency
distribution histograms, differences are visible in terms of startup costs found across businesses.
4) H0: Across businesses, average startup costs does not significantly vary
Hi: Across businesses, average startup does show significant variation.
Realizing the presence of five variables for comparison, the correct choice would be ANOVA.
Excel Output – ANOVA
5
Document Page
Since F computed value does exceed the corresponding critical value, hence rejection of null
hypothesis framed. This hints at the difference between the mean average costs for businesses
being significant.
TASK 2
1) Excel output for regression
6
tabler-icon-diamond-filled.svg

Paraphrase This Document

Need a fresh take? Get an instant paraphrase of this document with our AI Paraphraser
Document Page
The equation derived from excel output is illustrated as follows..
2) The regression model at hand represents a good fit primarily deciphered from R2 value which
comes out exceptionally high thereby indicating the ability of the predictors used in the model
to highlight the potential changes in the net annual sales (acting as the independent variable).
3) The hypothesis testing would essentially commence with listing down of the hypothesis.
H0: β = zero for X2, X3, X4, X5 & X6
H1: β ≠ zero for atelast either of one predictors
Observation: Significance F = 0.0000
Decision: Ho rejection
7
Document Page
Conclusion: Regression model is significant as for certain variables the zero slope assumption is
proved wrong.
4) Table for slope interpretation
5) Table for 95% confidence interval
6) The hypothesis testing would essentially commence with listing down of the hypothesis.
The hypothesis testing summary in terms of requisite p value is loaded as follows.
Since p value for all given variables is lower than corresponding significance level, hence
rejection of null hypothesis establishes significance of all independent variables.
8
Document Page
7) Since the above hypothesis test hints at the significance of all independent variables, hence a
better model cannot be obtained by deleting any parameter.
8) Putting the input set of values in the regression model deriving in (1), we get
.
9
chevron_up_icon
1 out of 10
circle_padding
hide_on_mobile
zoom_out_icon
logo.png

Your All-in-One AI-Powered Toolkit for Academic Success.

Available 24*7 on WhatsApp / Email

[object Object]