Comprehensive Statistics Assignment: Hypothesis Testing & Regression
VerifiedAdded on 2023/05/30
|16
|1819
|323
Homework Assignment
AI Summary
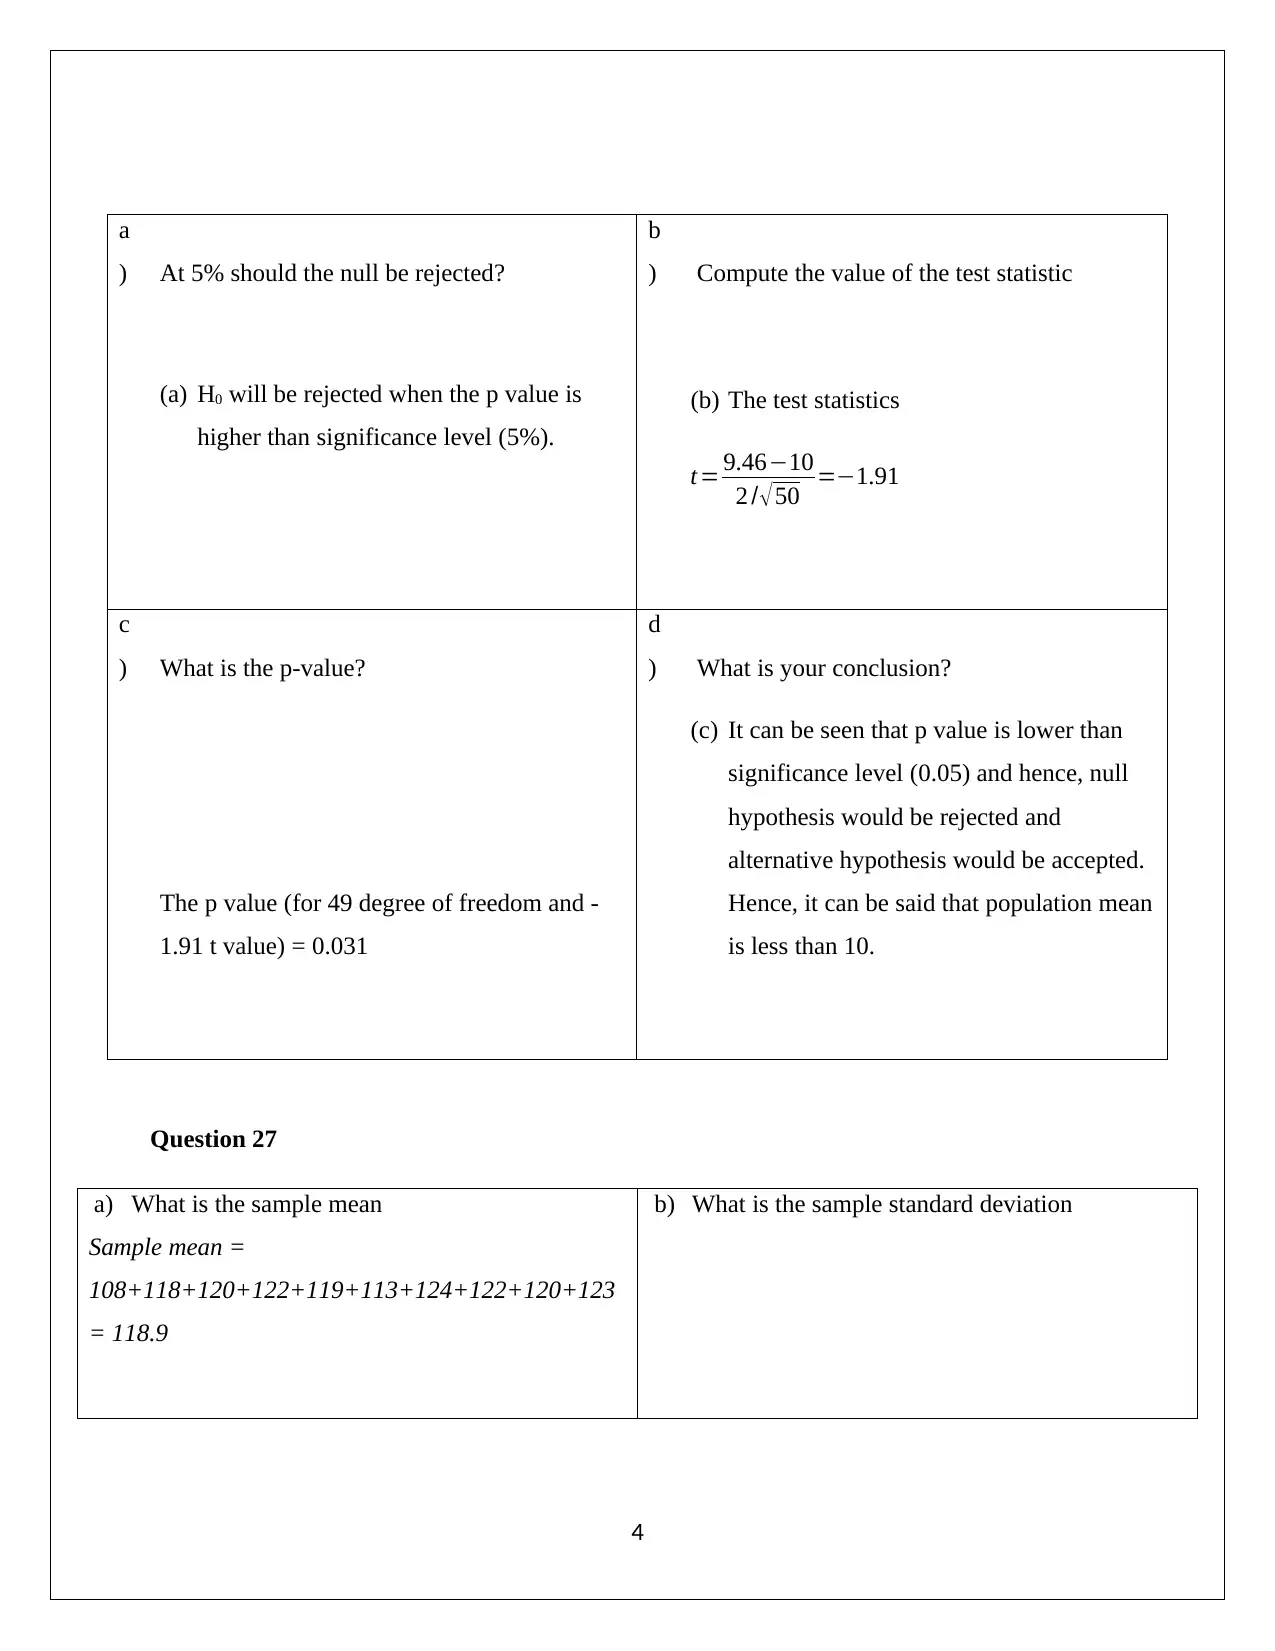
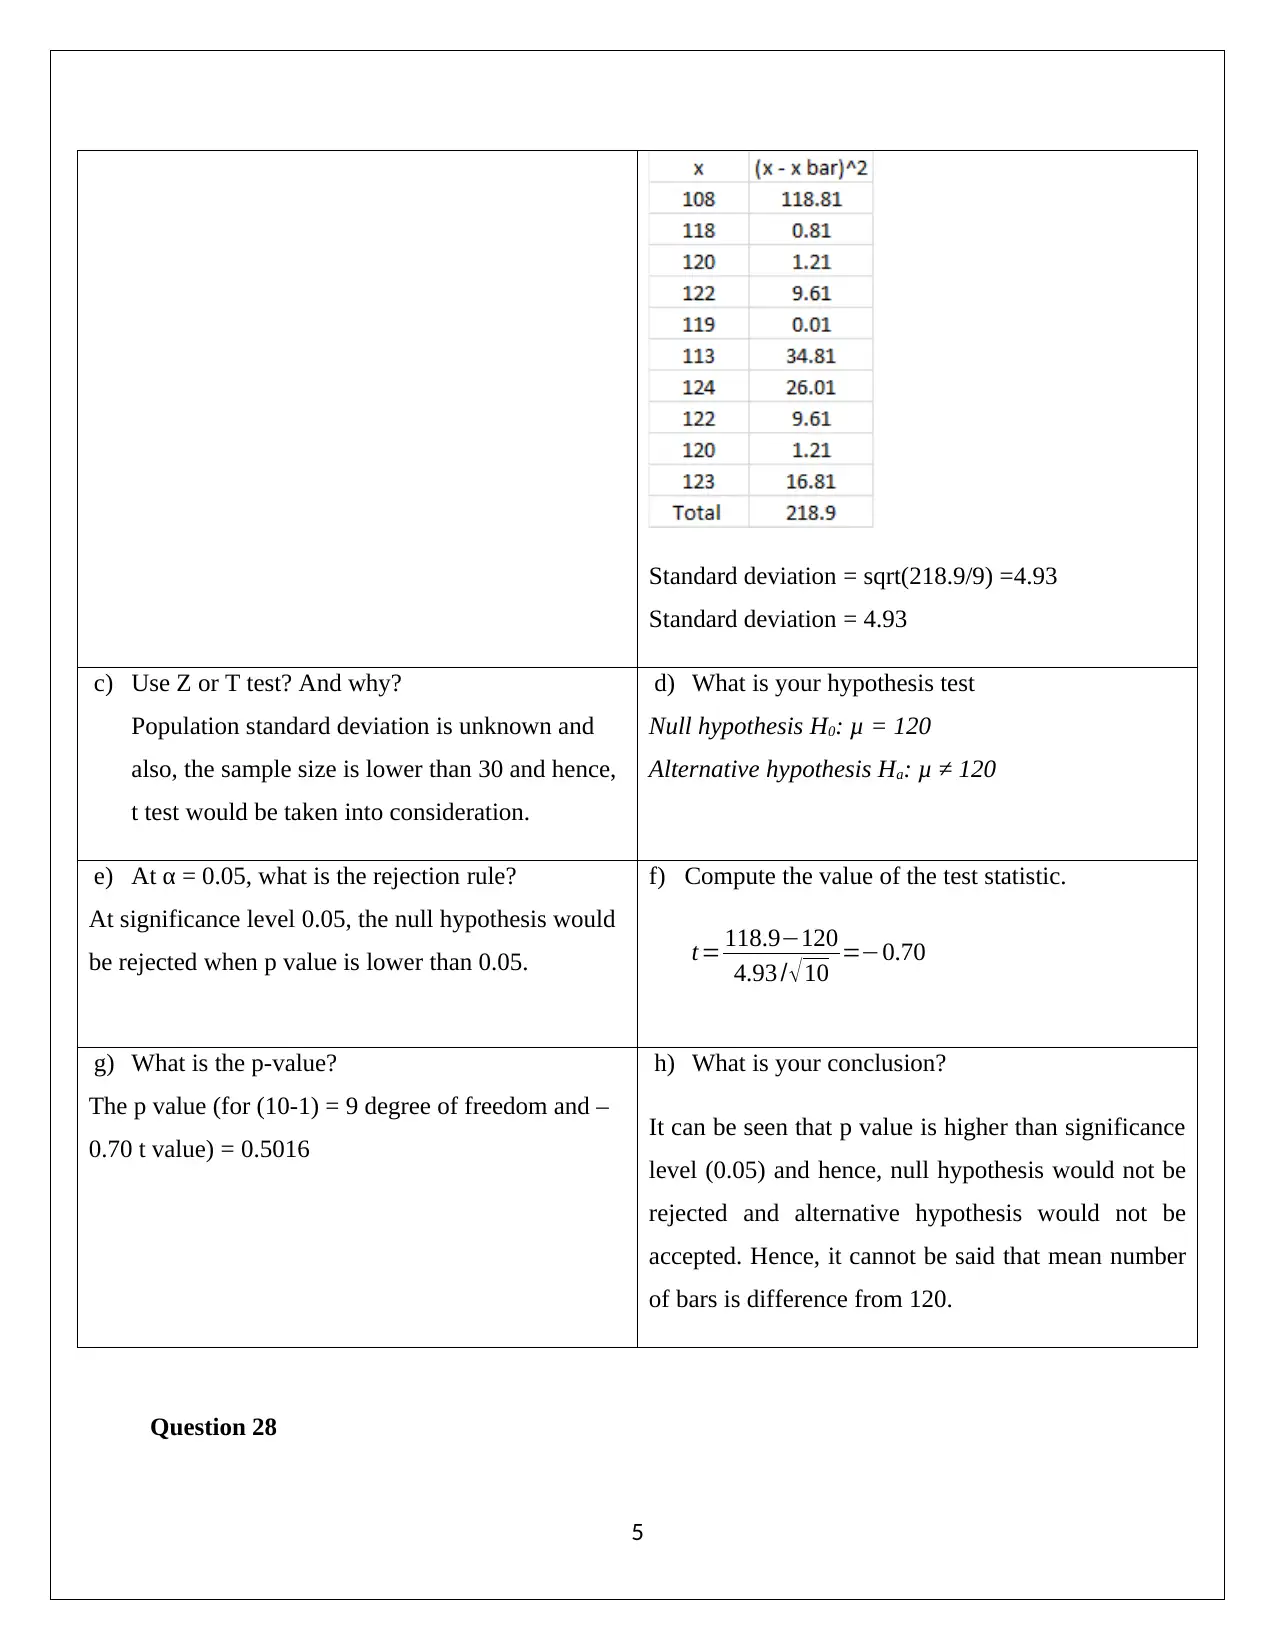
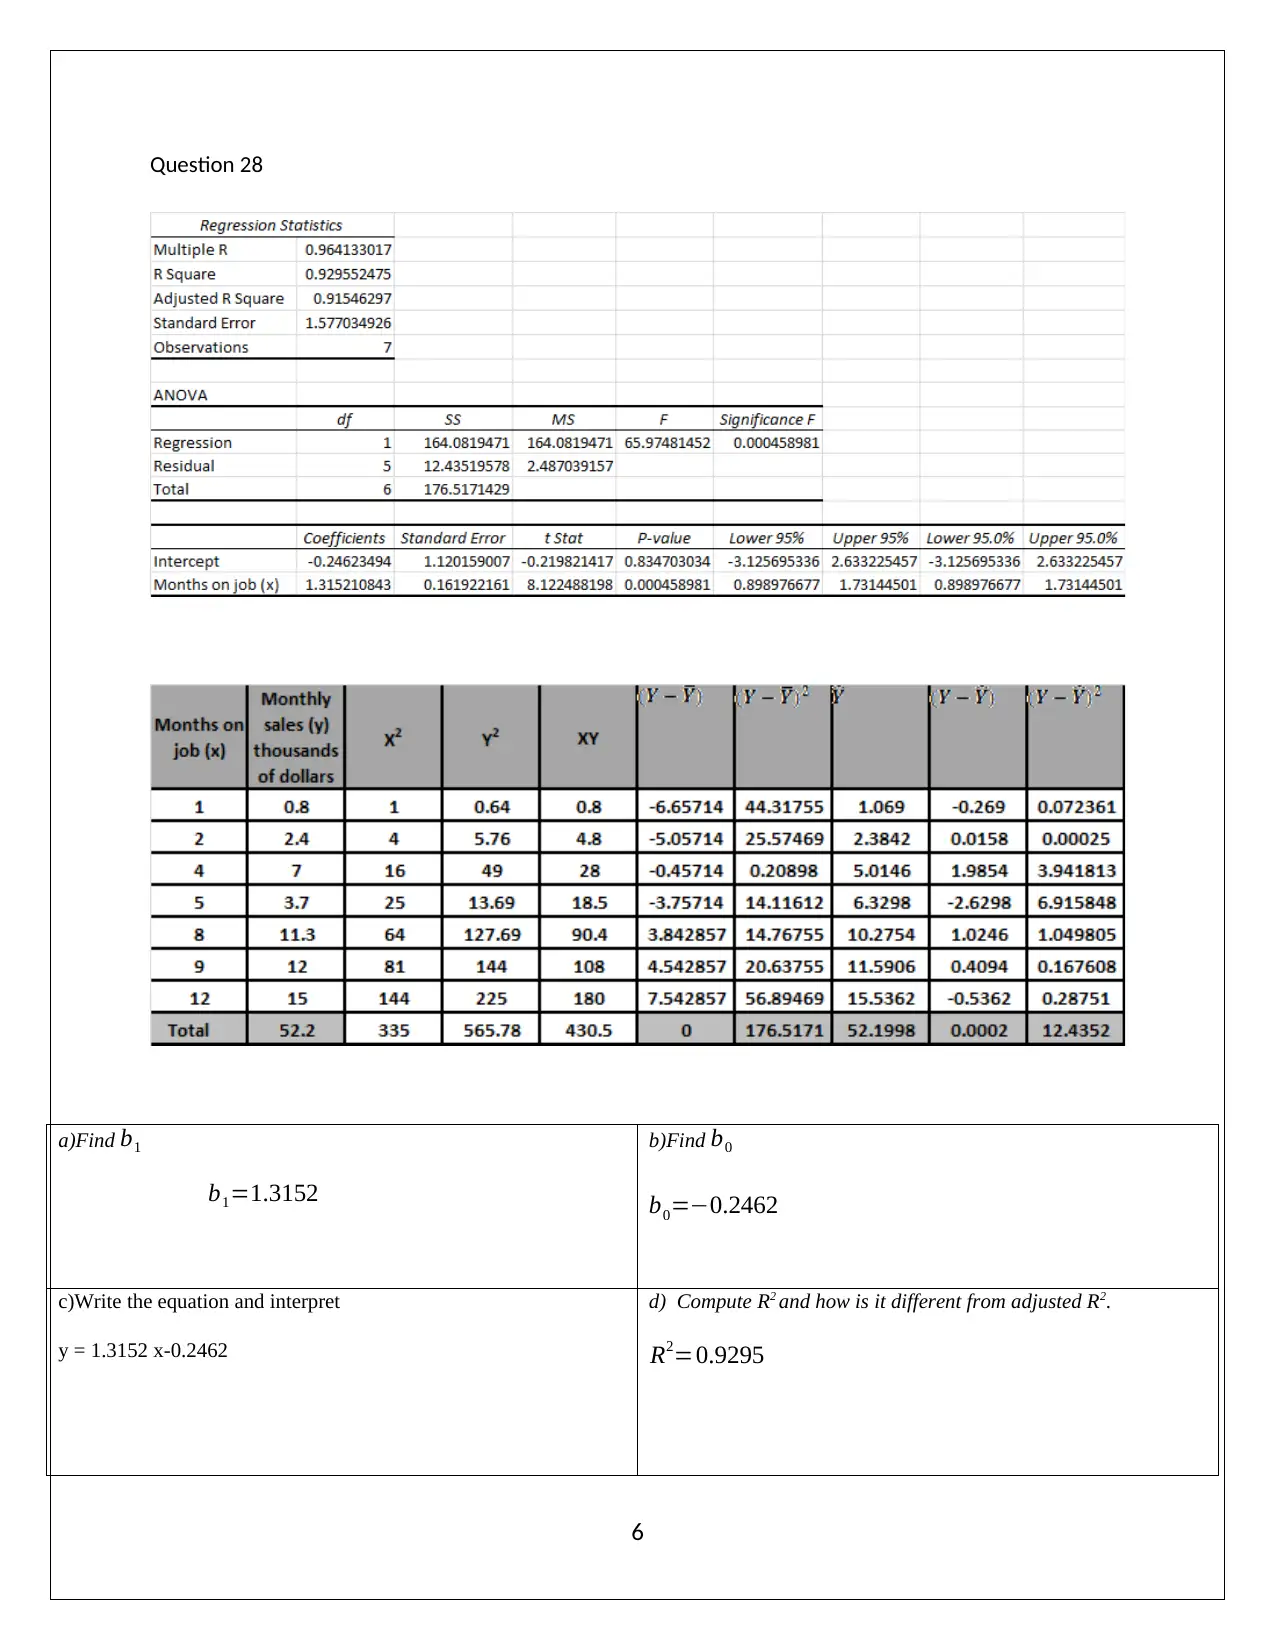
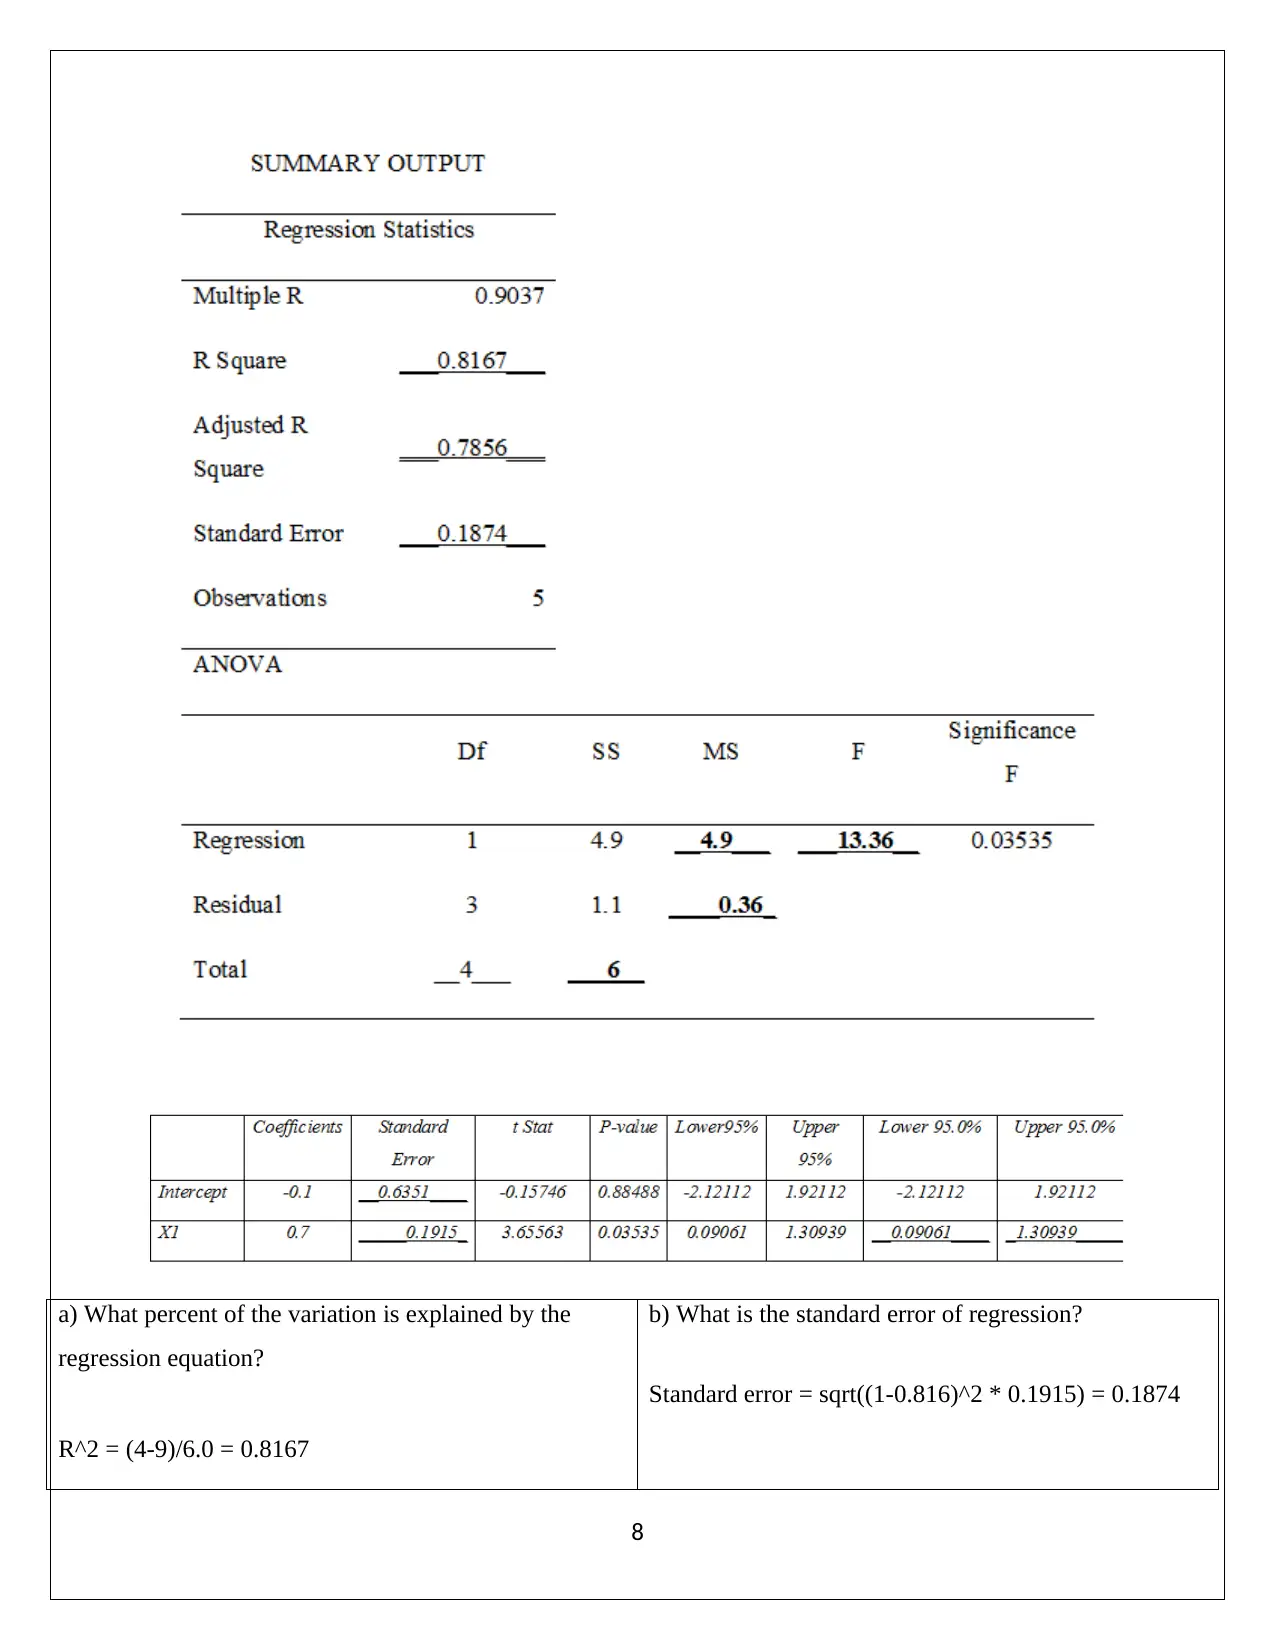
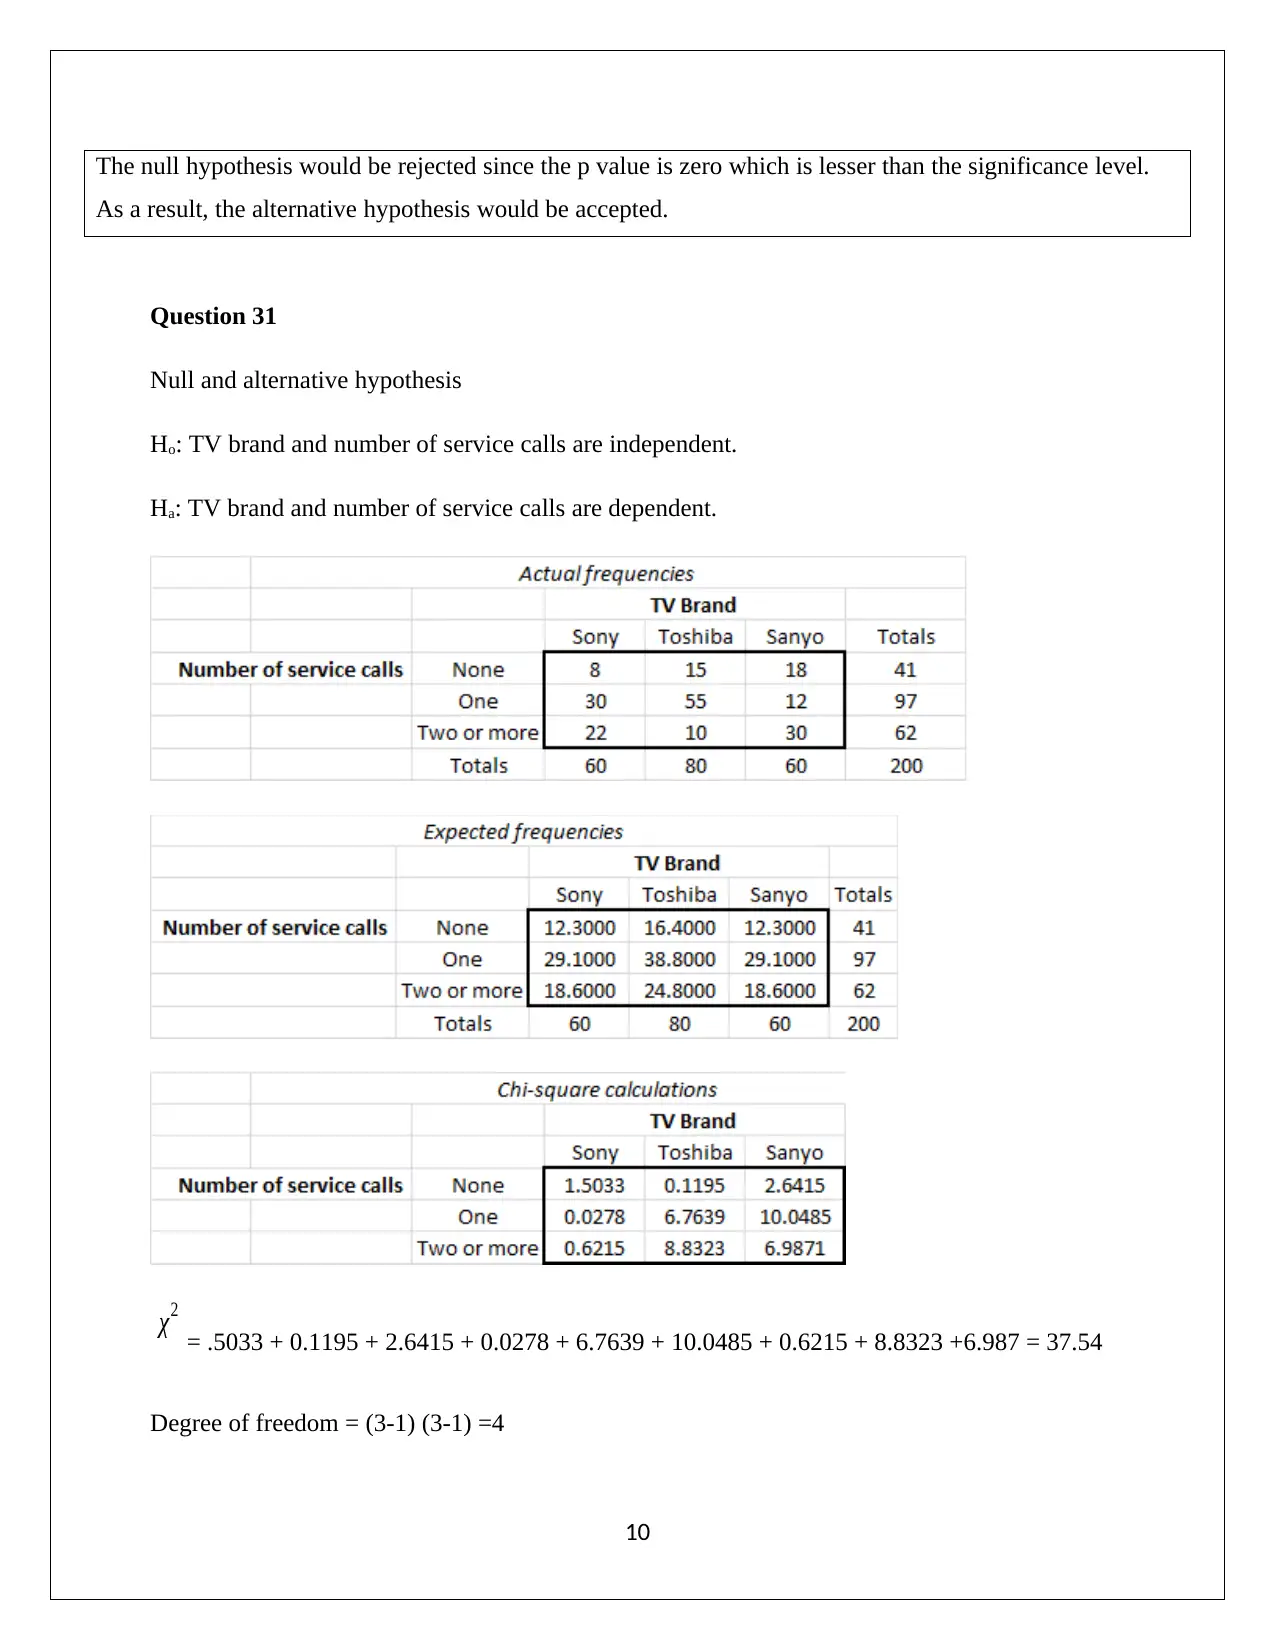
This document provides solutions to a statistics assignment covering various topics, including true/false questions, multiple-choice questions, fill-in-the-blanks, and problem-solving exercises. The solutions demonstrate hypothesis testing using t-tests and chi-square tests, regression analysis including calculating regression equations, R-squared, standard errors, and variance. Specific questions address hypothesis formulation, p-value interpretation, and decision-making based on significance levels. The assignment covers both parametric and non-parametric statistical methods and includes detailed calculations and explanations for each problem. Desklib offers a wealth of similar solved assignments and study resources for students.

STATISTICS
STUDENT NAME/ID
[Pick the date]
STUDENT NAME/ID
[Pick the date]
Paraphrase This Document
Need a fresh take? Get an instant paraphrase of this document with our AI Paraphraser

PART A: True or False
1) F
2) T
3) T
4) T
5) F
6) T
7) T
8) F
9) F
10) F
11) T
PART B: Multiple Choice
12) Option B
13) Option C
14) Option D
15) Option D
16) Option C
17) Option A
18) Option D
19) Option C
20) Option A
21) Option A
1
1) F
2) T
3) T
4) T
5) F
6) T
7) T
8) F
9) F
10) F
11) T
PART B: Multiple Choice
12) Option B
13) Option C
14) Option D
15) Option D
16) Option C
17) Option A
18) Option D
19) Option C
20) Option A
21) Option A
1

PART C: Fill in the blanks
22) a) Fail to reject
b) Reject
c) Reject
23) a) Fail to Reject
b) Fail to Reject
c) Reject
24 a) H0=The treatment are all equal.
Ha=at least one of them is not equal or all of them are not equal
b) Yes, Factor is significant
c) 20
Question 25
Ho: μ = 17
Ha: μ ≠ 17
Sample size = 25
Sample mean = 14.2
Sample variance = 25
Standard deviation = sqrt(25) = 5
a
) At 5% should the null be rejected?
b
) Compute the value of the test statistic
(a) H0 will be rejected when the p value is
higher than significance level (5%). (b) The test statistics
2
⊘ This is a preview!⊘
Do you want full access?
Subscribe today to unlock all pages.

Trusted by 1+ million students worldwide

t= 14.2−17
5/ √25 =−2.8
c
) What is the p-value?
d
) What is your conclusion? Explain.
The p value (for 24 degree of freedom and -2.8
t value) = 0.0099
It can be seen that p value is lower than
significance level (0.05) and hence, null
hypothesis would be rejected and alternative
hypothesis would be accepted. Hence, it can be
said that hypothesized mean is not same as 17.
Question 26
Ho: μ >= 10
Ha: μ < 10
Sample size = 50
Sample mean = 9.46
Sample variance = 4
Standard deviation = sqrt(4) = 2
3
Paraphrase This Document
Need a fresh take? Get an instant paraphrase of this document with our AI Paraphraser

a
) At 5% should the null be rejected?
b
) Compute the value of the test statistic
(a) H0 will be rejected when the p value is
higher than significance level (5%).
(b) The test statistics
t= 9.46−10
2 / √50 =−1.91
c
) What is the p-value?
d
) What is your conclusion?
The p value (for 49 degree of freedom and -
1.91 t value) = 0.031
(c) It can be seen that p value is lower than
significance level (0.05) and hence, null
hypothesis would be rejected and
alternative hypothesis would be accepted.
Hence, it can be said that population mean
is less than 10.
Question 27
a) What is the sample mean
Sample mean =
108+118+120+122+119+113+124+122+120+123
= 118.9
b) What is the sample standard deviation
4

Standard deviation = sqrt(218.9/9) =4.93
Standard deviation = 4.93
c) Use Z or T test? And why?
Population standard deviation is unknown and
also, the sample size is lower than 30 and hence,
t test would be taken into consideration.
d) What is your hypothesis test
Null hypothesis H0: μ = 120
Alternative hypothesis Ha: μ ≠ 120
e) At α = 0.05, what is the rejection rule?
At significance level 0.05, the null hypothesis would
be rejected when p value is lower than 0.05.
f) Compute the value of the test statistic.
t= 118.9−120
4.93 / √10 =−0.70
g) What is the p-value?
The p value (for (10-1) = 9 degree of freedom and –
0.70 t value) = 0.5016
h) What is your conclusion?
It can be seen that p value is higher than significance
level (0.05) and hence, null hypothesis would not be
rejected and alternative hypothesis would not be
accepted. Hence, it cannot be said that mean number
of bars is difference from 120.
Question 28
5
⊘ This is a preview!⊘
Do you want full access?
Subscribe today to unlock all pages.

Trusted by 1+ million students worldwide

Question 28
a)Find b1
b1=1.3152
b)Find b0
b0=−0.2462
c)Write the equation and interpret
y = 1.3152 x-0.2462
d) Compute R2 and how is it different from adjusted R2.
R2=0.9295
6
a)Find b1
b1=1.3152
b)Find b0
b0=−0.2462
c)Write the equation and interpret
y = 1.3152 x-0.2462
d) Compute R2 and how is it different from adjusted R2.
R2=0.9295
6
Paraphrase This Document
Need a fresh take? Get an instant paraphrase of this document with our AI Paraphraser

e) Compute the estimated variance of the regression.
MSE= SSE
n−2 =2.487
f) Find Se
Se=1.577
g) Compute the estimated variance of b1
Variance of b1 = MSE- Sxx
Sxx = sum(x- x bar)^2 = 94.86
Variance of b1 = MSE- Sxx = 2.487/94.86 = 0.026
h) Compute the standard error of b1
Standard error of b1= sqrt(2.487/94.86) = 0.162
Question 29
7
MSE= SSE
n−2 =2.487
f) Find Se
Se=1.577
g) Compute the estimated variance of b1
Variance of b1 = MSE- Sxx
Sxx = sum(x- x bar)^2 = 94.86
Variance of b1 = MSE- Sxx = 2.487/94.86 = 0.026
h) Compute the standard error of b1
Standard error of b1= sqrt(2.487/94.86) = 0.162
Question 29
7

a) What percent of the variation is explained by the
regression equation?
R^2 = (4-9)/6.0 = 0.8167
b) What is the standard error of regression?
Standard error = sqrt((1-0.816)^2 * 0.1915) = 0.1874
8
regression equation?
R^2 = (4-9)/6.0 = 0.8167
b) What is the standard error of regression?
Standard error = sqrt((1-0.816)^2 * 0.1915) = 0.1874
8
⊘ This is a preview!⊘
Do you want full access?
Subscribe today to unlock all pages.

Trusted by 1+ million students worldwide

Required percentage = 81.67%
c) What is the critical value of the F-statistic?
F stat = 13.36
d) What sample size is used in the print out?
Sample size = 5
Question 30
a) What percent of the variation is explained by the
regression equation?
99.4% of variation is explained by the regression
equation.
b) What is the standard error of regression? 2
Standard error of regression is 1.507.
c) Write the estimated equation.
Sales = -19.7 -0.00063outlets +1.74cars
+0.410income + 2.04age -0.034 bosses
d) What is the critical value of the F-statistic?
Critical value is 6.256 based on the given
significance level coupled with degrees of
freedom.
e) What sample size is used in the print out?
Sample size = 10
f) What is the variance of the slope coefficient of
income?
Variance = √ SE * n4 = (0.04385)0.5*104 = 2,094.04
g) Assuming that you are using a two-tailed test make a decision using the computed P-value.
9
Paraphrase This Document
Need a fresh take? Get an instant paraphrase of this document with our AI Paraphraser

The null hypothesis would be rejected since the p value is zero which is lesser than the significance level.
As a result, the alternative hypothesis would be accepted.
Question 31
Null and alternative hypothesis
Ho: TV brand and number of service calls are independent.
Ha: TV brand and number of service calls are dependent.
χ2
= .5033 + 0.1195 + 2.6415 + 0.0278 + 6.7639 + 10.0485 + 0.6215 + 8.8323 +6.987 = 37.54
Degree of freedom = (3-1) (3-1) =4
10

The p value for 37.54 chi square and 4 degree of freedom = 0.00
Significance level = 5%
It can be seen from the above that p value is lower than level of significance and hence,
sufficient evidence is present to reject the null hypothesis and to accept the alternative
hypothesis. Hence, it can be concluded that TV brand and number of service calls are dependent.
Question 32
Null and alternative hypothesis
Ho: Ridership is equally balanced.
Ha: Ridership is not equally balanced.
Expected frequency = (10+34+21+57+44)/5 = 33.2
11
⊘ This is a preview!⊘
Do you want full access?
Subscribe today to unlock all pages.

Trusted by 1+ million students worldwide
1 out of 16
Related Documents

Your All-in-One AI-Powered Toolkit for Academic Success.
+13062052269
info@desklib.com
Available 24*7 on WhatsApp / Email
Unlock your academic potential
Copyright © 2020–2025 A2Z Services. All Rights Reserved. Developed and managed by ZUCOL.